
Price Action Analysis Toolkit Development (Part 2): Analytical Comment Script
Introduction
To simplify price action analysis and accelerate market assessments, I have developed a robust tool built on the concept of the chart projector. This tool provides an efficient summary of essential market values by allowing traders to run a single script without navigating the chart. It effectively displays key metrics, including the previous day's open and close prices, significant support and resistance levels, the prior day's high and low values, and trading volume. Additionally, it features a vertical table displayed directly on the chart for easy reference.
The tool automatically draws important support and resistance lines, giving you visual cues for analysis. It also provides helpful commentary on market conditions and potential movements, adding valuable context to your trading decisions.
We will proceed with the following subtopics:
Why Focus on this tool?
After researching how certain market information impacts predictions of market direction, I've created a tool designed to quickly deliver the most critical market insights. This means you won’t have to sift through historical data or perform complicated calculations. The standout feature of this tool is its ability to provide information in just seconds.
It shows the previous day's open and close prices and highlights key resistance and support levels. Perhaps most importantly, it calculates both the current volume and the previous day's volume. Understanding volume is crucial, as it reflects market participation. When today's volume is significantly higher than yesterday's, it indicates that more traders are getting involved, which can lead to sharper price movements and strengthen the prevailing price trend, whether it's moving upward (bullish) or downward (bearish). By combining all this information, it provides insights regarding the expected price direction.
Some of the key features are outlined in the table below.
| Advantages | Description |
|---|---|
| Identification Of Key Levels | Knowing the previous day's high and low prices can help traders ascertain important psychological levels where buying or selling pressure might increase. |
| Volume Insights | Analyzing volume helps traders gauge market interest. A high volume at a particular price level often indicates strong conviction among traders, making it a crucial reference for future trades. |
| Trend Confirmation | The open and close prices provide insight into the market's sentiment. A higher close compared to the open suggests bullish sentiment, while the opposite indicates bearishness. |
| Chart Annotations | The script adds horizontal lines for support and resistance on the chart, providing visual cues that can enhance the trader's analysis. This visual support makes it easier to understand market levels and price action dynamics. |
| Clear Communications | The use of a comment box on the chart helps communicate critical analytics succinctly, which can aid in quick decision-making. |
| Learning Tool | For novice traders, the script can serve as an educational tool to help them understand how to read and interpret historical price data, volume, and the implications for future price movements. |
| Efficiency and Time-Saving | The tool automates the calculation and retrieval of key indicators, saving time. This allows traders to focus on executing their trading plans rather than gathering data. |
Overview of the Script
The MQL5 script we're going to look at helps you automatically gather important metrics from the previous trading day. This makes your analysis easier, so you can spend more time on strategy and less on collecting data. Here’s how the script does it.
1. Calculating and displaying essential technical levels by directly fetching data from the previous trading day on the trading platform.
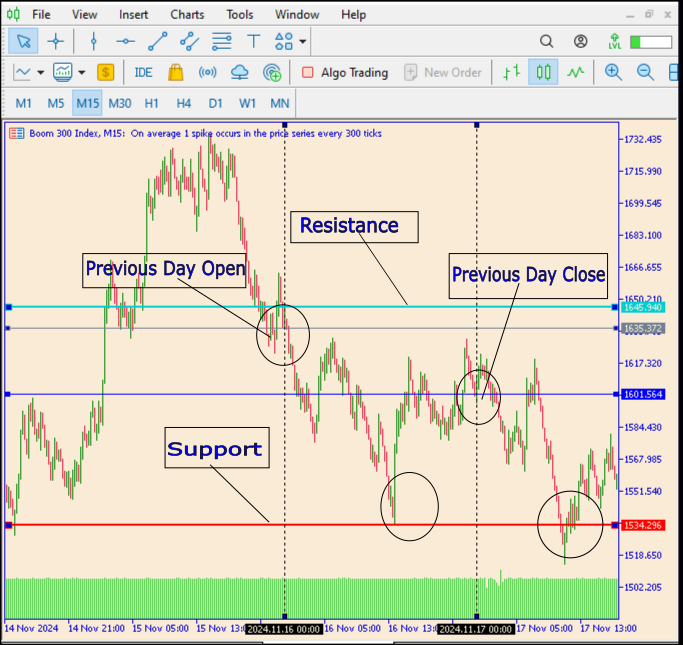
Fig 1. Essential Levels
Figure 1 displays essential information about the market, including the previous day's open and close prices, key resistance and support levels, and how the market reacts to those levels.
2. Annotating the charts for immediate reference.
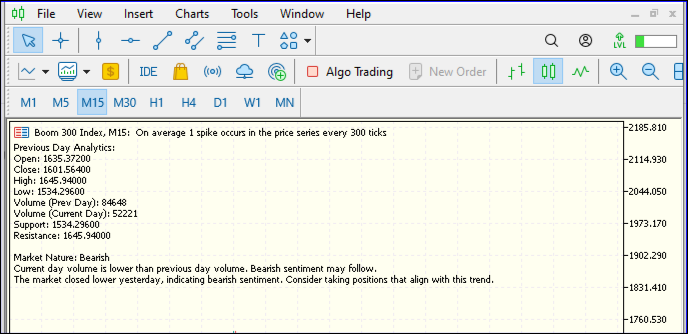
Fig 2. Quick Chart Reference
In Figure 2, we can see how immediate reference information is presented on the MetaTrader 5 chart.
Let's take a closer look at the script to understand how it functions.
The MQL5 Script
The script is designed to analyze the previous day's market performance and present key analytics to traders. It is particularly useful for day traders and technical analysts who rely on understanding recent price action and volume trends for making informed trading decisions. Below is the complete script, ready for implementation within your MetaTrader 5 platform:
//+------------------------------------------------------------------+
//|                                                          ACS.mq5 |
//|                        Copyright 2024, MetaQuotes Software Corp. |
//|                                              http://www.mql5.com |
//+------------------------------------------------------------------+
#property copyright   "2024, MetaQuotes Software Corp."
#property link        "https://www.mql5.com/en/users/lynnchris"
#property description "Script that displays previous day metrics on the current chart and predicts market direction."
#property version     "1.0"

#include <Trade\Trade.mqh>

//+------------------------------------------------------------------+
//| Input parameters                                                 |
//+------------------------------------------------------------------+
input color TableTextColor = clrBlue; // Text color for the table
input int   TableXOffset   = 10;      // X offset for the table
input int   TableYOffset   = 50;      // Y offset for the table
input color SupportColor = clrGreen; // Color for the support line
input color ResistanceColor = clrRed; // Color for the resistance line

//+------------------------------------------------------------------+
//| Global variables                                                 |
//+------------------------------------------------------------------+
double prevDayHigh, prevDayLow, prevDayOpen, prevDayClose, prevDayVolume;
double currentDayVolume;
double keySupport, keyResistance; // Initialized but will be calculated

//+------------------------------------------------------------------+
//| Main function                                                    |
//+------------------------------------------------------------------+
void OnStart()
  {
//--- Get previous day's data
   int prevDayIndex = iBarShift(NULL, PERIOD_D1, iTime(NULL, PERIOD_D1, 1));

   if(prevDayIndex == -1)
     {
      Print("Error retrieving previous day's data.");
      return;
     }

   prevDayHigh    = iHigh(NULL, PERIOD_D1, prevDayIndex);
   prevDayLow     = iLow(NULL, PERIOD_D1, prevDayIndex);
   prevDayOpen    = iOpen(NULL, PERIOD_D1, prevDayIndex);
   prevDayClose   = iClose(NULL, PERIOD_D1, prevDayIndex);
   prevDayVolume  = iVolume(NULL, PERIOD_D1, prevDayIndex);

//--- Get today's volume
   currentDayVolume = iVolume(NULL, PERIOD_D1, 0); // Current day's volume

//--- Calculate key support and resistance
   keySupport = prevDayLow;  // Support level can be set to the previous day's low
   keyResistance = prevDayHigh; // Resistance level can be set to the previous day's high

//--- Manage existing lines (if any)
//ObjectDelete("SupportLine");
//ObjectDelete("ResistanceLine");

//--- Create support line
   if(!ObjectCreate(0, "SupportLine", OBJ_HLINE, 0, 0, keySupport))
     {
      Print("Failed to create SupportLine");
     }
   ObjectSetInteger(0, "SupportLine", OBJPROP_COLOR, SupportColor);
   ObjectSetInteger(0, "SupportLine", OBJPROP_WIDTH, 2); // Set the width of the line

//--- Create resistance line
   if(!ObjectCreate(0, "ResistanceLine", OBJ_HLINE, 0, 0, keyResistance))
     {
      Print("Failed to create ResistanceLine");
     }
   ObjectSetInteger(0, "ResistanceLine", OBJPROP_COLOR, ResistanceColor);
   ObjectSetInteger(0, "ResistanceLine", OBJPROP_WIDTH, 2); // Set the width of the line

//--- Determine the day's nature (Bullish or Bearish)
   string marketNature;
   if(prevDayClose > prevDayOpen)
     {
      marketNature = "Bullish";
     }
   else
      if(prevDayClose < prevDayOpen)
        {
         marketNature = "Bearish";
        }
      else
        {
         marketNature = "Neutral";
        }

//--- Compare volumes and determine market sentiment
   string volumeCommentary;
   if(currentDayVolume > prevDayVolume)
     {
      volumeCommentary = "Current day volume is higher than previous day volume. Bullish sentiment may continue.";
     }
   else
      if(currentDayVolume < prevDayVolume)
        {
         volumeCommentary = "Current day volume is lower than previous day volume. Bearish sentiment may follow.";
        }
      else
        {
         volumeCommentary = "Current day volume is equal to previous day volume. Market sentiment remains uncertain.";
        }

//--- Generate market movement commentary
   string marketCommentary;
   if(marketNature == "Bullish")
     {
      marketCommentary = "The market closed higher yesterday, indicating bullish sentiment. Look for potential continuation patterns.";
     }
   else
      if(marketNature == "Bearish")
        {
         marketCommentary = "The market closed lower yesterday, indicating bearish sentiment. Consider taking positions that align with this trend.";
        }
      else
        {
         marketCommentary = "The market showed neutrality with little change. Watch for potential breakout opportunities.";
        }

//--- Display the information in a table-like format on the chart
   string textOutput = "Previous Day Analytics:\n";
   textOutput += "Open: " + DoubleToString(prevDayOpen, 5) + "\n";
   textOutput += "Close: " + DoubleToString(prevDayClose, 5) + "\n";
   textOutput += "High: " + DoubleToString(prevDayHigh, 5) + "\n";
   textOutput += "Low: " + DoubleToString(prevDayLow, 5) + "\n";
   textOutput += "Volume (Prev Day): " + DoubleToString(prevDayVolume, 0) + "\n";
   textOutput += "Volume (Current Day): " + DoubleToString(currentDayVolume, 0) + "\n";
   textOutput += "Support: " + DoubleToString(keySupport, 5) + "\n";
   textOutput += "Resistance: " + DoubleToString(keyResistance, 5) + "\n";
   textOutput += "\nMarket Nature: " + marketNature + "\n";
   textOutput += volumeCommentary + "\n";
   textOutput += marketCommentary;

// Draw the text output on the chart
   Comment(textOutput);
  }

//+------------------------------------------------------------------+
//+------------------------------------------------------------------+
Code Development
We develop our code using MetaEditor. In this case, we choose to create a script. Below, we'll outline the steps to achieve this.
1. Properties
These properties help you give proper credit for your work and share important details about the author or the source of the script. They also specify the script's version, which is useful for keeping track of updates and ensuring users are aware of any changes.
#property copyright "2024, MetaQuotes Software Corp"
#property link      "https://www.mql5.com/en/users/lynnchris"
#property version   "1.0"
2. Including Required Libraries
This line includes the Trade.mqh library,
Trade: This term likely refers to the various functions, classes, or objects designed to manage trade operations. These elements make it easier to execute trades, check trade statuses, and handle related tasks within your trading algorithms.
.mqh: This file extension is used for MetaQuotes Header files. In MetaTrader, .mqh files serve as a way to store reusable code, including functions, classes, or libraries. This code can be easily incorporated into other MQL programs, promoting efficiency and modularity.
#include <Trade\Trade.mqh> 3. Input Parameters:
An input parameter is a variable defined in an MQL5 program that users can adjust in the strategy tester or the input settings of an EA without changing the underlying code.
The script also allows for user input parameters, providing traders the flexibility to tailor their analysis to their preferences. This means they can choose specific symbols or colors for support and resistance lines, making the tool more personalized and easier to read.
input color TableTextColor = clrBlue; // Text color for the table
input int   TableXOffset   = 10;      // X offset for the table
input int   TableYOffset   = 50;      // Y offset for the table
input color SupportColor = clrGreen; // Color for the support line
input color ResistanceColor = clrRed; // Color for the resistance line
Next, we address Global Variables. These global variables store information about the previous day's price action and the current day's volume. The variables keySupport and keyResistance are initialized later in the code.
double prevDayHigh, prevDayLow, prevDayOpen, prevDayClose, prevDayVolume;
double currentDayVolume;
double keySupport, keyResistance; // Initialized but will be calculated
4. Main Functionality:
This is the main function where the script's execution starts. Everything inside this function will be executed when the script is run. Scripts are single-execution programs that perform specific tasks in the MetaTrader 5 environment, such as placing a trade, modifying orders, or generating signals.
void OnStart()
First, we retrieve the data from the previous trading day, including price levels and volume. This step identifies the index of the last completed daily bar, which is essential for analyzing recent market behavior and making informed trading decisions.
int prevDayIndex = iBarShift(NULL, PERIOD_D1, iTime(NULL, PERIOD_D1, 1));
It checks if the previous day’s index was retrieved successfully. If not, it prints an error message and exits the function.
if (prevDayIndex == -1)
{
   Print("Error retrieving previous day's data.");
   return;
}
Next, it retrieves data for the previous day:
prevDayHigh    = iHigh(NULL, PERIOD_D1, prevDayIndex);
prevDayLow     = iLow(NULL, PERIOD_D1, prevDayIndex);
prevDayOpen    = iOpen(NULL, PERIOD_D1, prevDayIndex);
prevDayClose   = iClose(NULL, PERIOD_D1, prevDayIndex);
prevDayVolume  = iVolume(NULL, PERIOD_D1, prevDayIndex);
Get Current Day's Volume
This retrieves the current day's volume.
currentDayVolume = iVolume(NULL, PERIOD_D1, 0); // Current day's volume
Calculate Support and Resistance Levels
Support is set as the previous day's low, while resistance is set as the previous day's high.
keySupport = prevDayLow;  // Support level can be set to the previous day's low
keyResistance = prevDayHigh; // Resistance level can be set to the previous day's high
Create support and resistance lines
This attempts to create a horizontal line representing support. If it fails, it prints an error message. The same process follows for the resistance line.
if (!ObjectCreate(0, "SupportLine", OBJ_HLINE, 0, 0, keySupport))
{
   Print("Failed to create SupportLine");
}
Determine Market Nature
The next portion determines if the market was bullish, bearish, or neutral based on the previous day's open and close prices:
if (prevDayClose > prevDayOpen)
{
   marketNature = "Bullish";
}
else if (prevDayClose < prevDayOpen)
{
   marketNature = "Bearish";
}
else
{
   marketNature = "Neutral";
}
Commentary
The Comment() function provides a way to display descriptive text directly on the trading chart. This can be used to show important information such as current values, trading signals, or status messages.
Here, a commentary on current versus previous day volumes:
if (currentDayVolume > prevDayVolume)
{
   volumeCommentary = "Current day volume is higher...";
}
else if (currentDayVolume < prevDayVolume)
{
   volumeCommentary = "Current day volume is lower...";
}
else
{
   volumeCommentary = "Current day volume is equal...";
}
The script uses the Comment function to write a clean, formatted message on the chart displaying the previous day's open, high, low, close, and previous and current day volumes. This serves as an immediate reference point for traders.
if (marketNature == "Bullish")
{
   marketCommentary = "The market closed higher yesterday...";
}
else if (marketNature == "Bearish")
{
   marketCommentary = "The market closed lower yesterday...";
}
else
{
   marketCommentary = "The market showed neutrality...";
}
Display Table
Finally, it constructs a text message containing all collected data and displays it on the chart:
string textOutput = "Previous Day Analytics:\n";
textOutput += "Open: " + DoubleToString(prevDayOpen, 5) + "\n";
...
textOutput += marketCommentary;

// Draw the text output on the chart
Comment(textOutput);
Testing
Below are the steps for successfully implementing the script.
1: Open MetaTrader 5 and navigate to the MetaEditor.
2: In the MetaEditor, create a new script by selecting New > Script.
3: Copy and paste the provided script into the editor.
4: Compile the script using the compile button. Ensure there are no errors.
5: Return to your MetaTrader platform, find the script in the Navigator panel under "Scripts," and drag it onto your desired chart. After dragging the script onto the chart, here is the result I obtained:
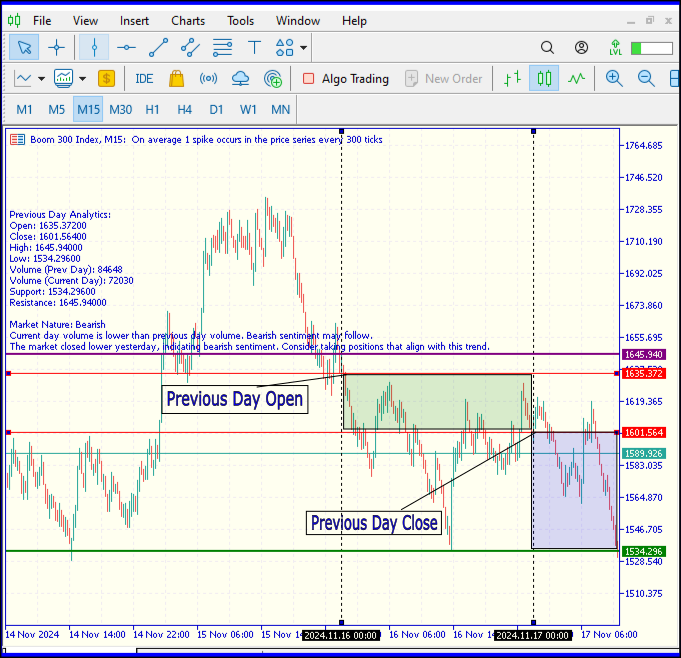
Fig 3. Tool Test Result 1
6: Set any custom input parameters (if desired) in the dialog box that appears. Below is a GIF demonstrating how I changed some parameters in MetaTrader 5.
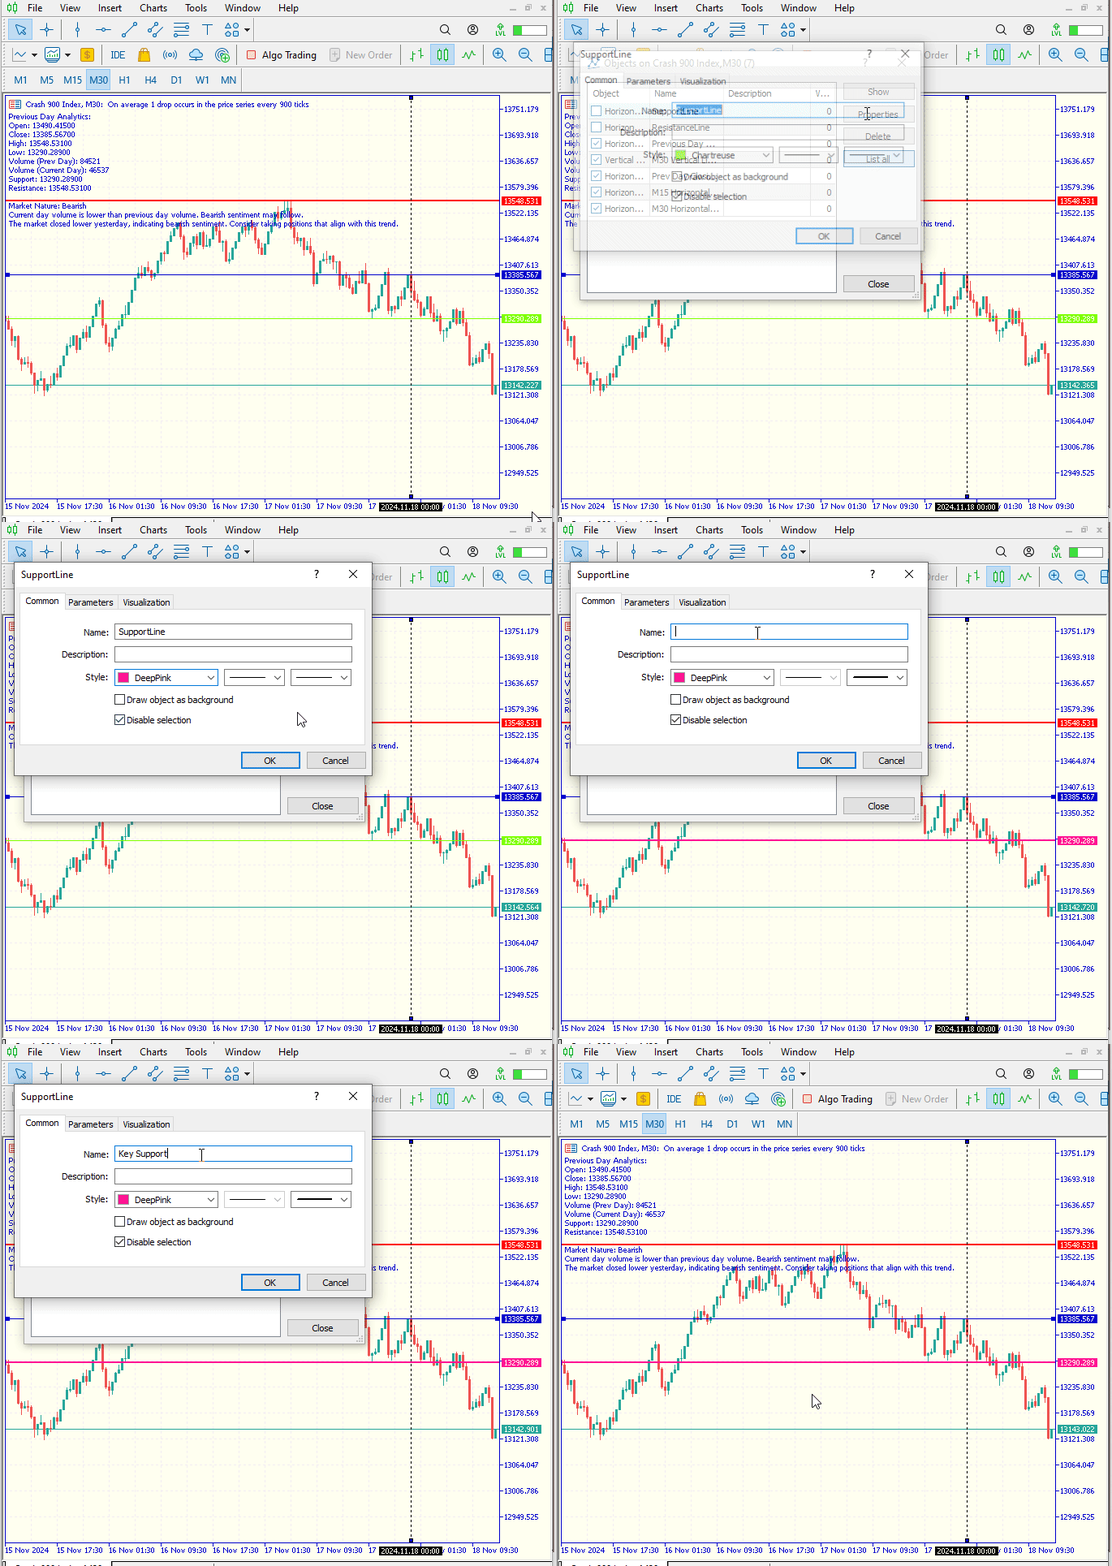
Fig 4. Setting Parameters
After running the script, the following results were obtained. I am providing three different GIFs of the various pairs that I tested the script on. The first GIF showcases a currency pair, USD/SEK, which produced the results displayed below.
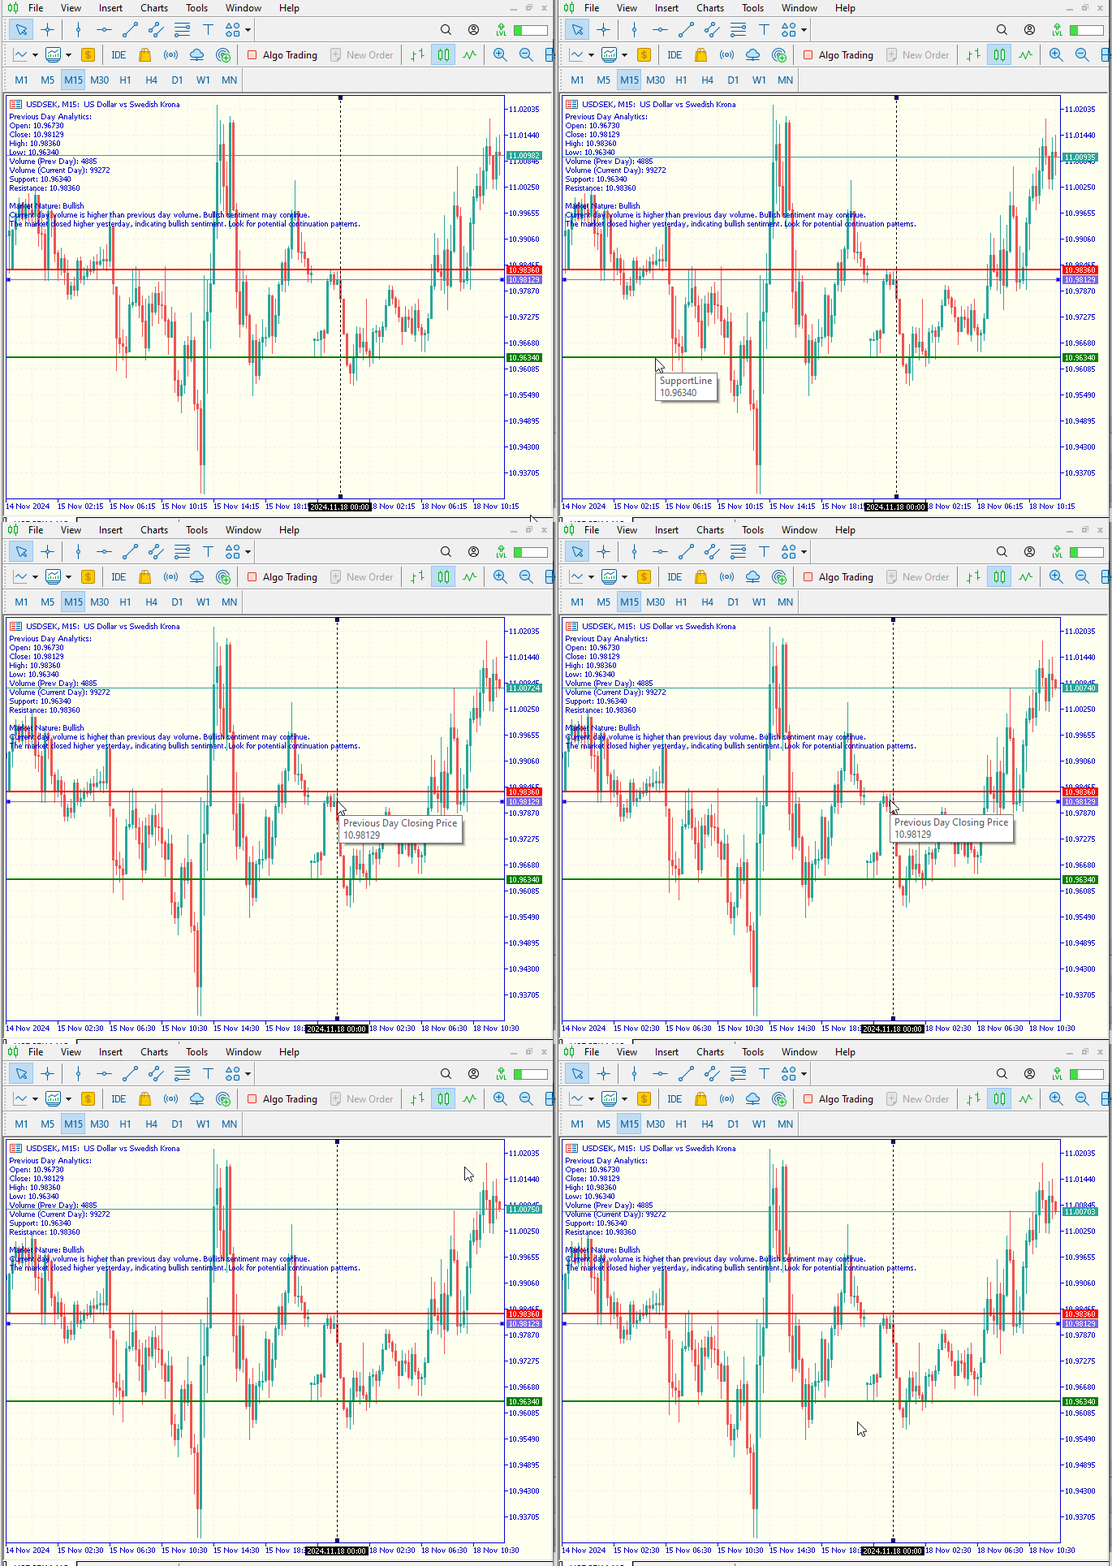
Fig 5. Tool Test Result 2
In Figure 5 above, the tool effectively presents the required information. It indicates an anticipated bullish market sentiment. The market initially experienced a slight bearish movement, but as the day progressed, it exhibited a strong bullish impulse.
Secondly, we also analyzed the Crash 900 Index.
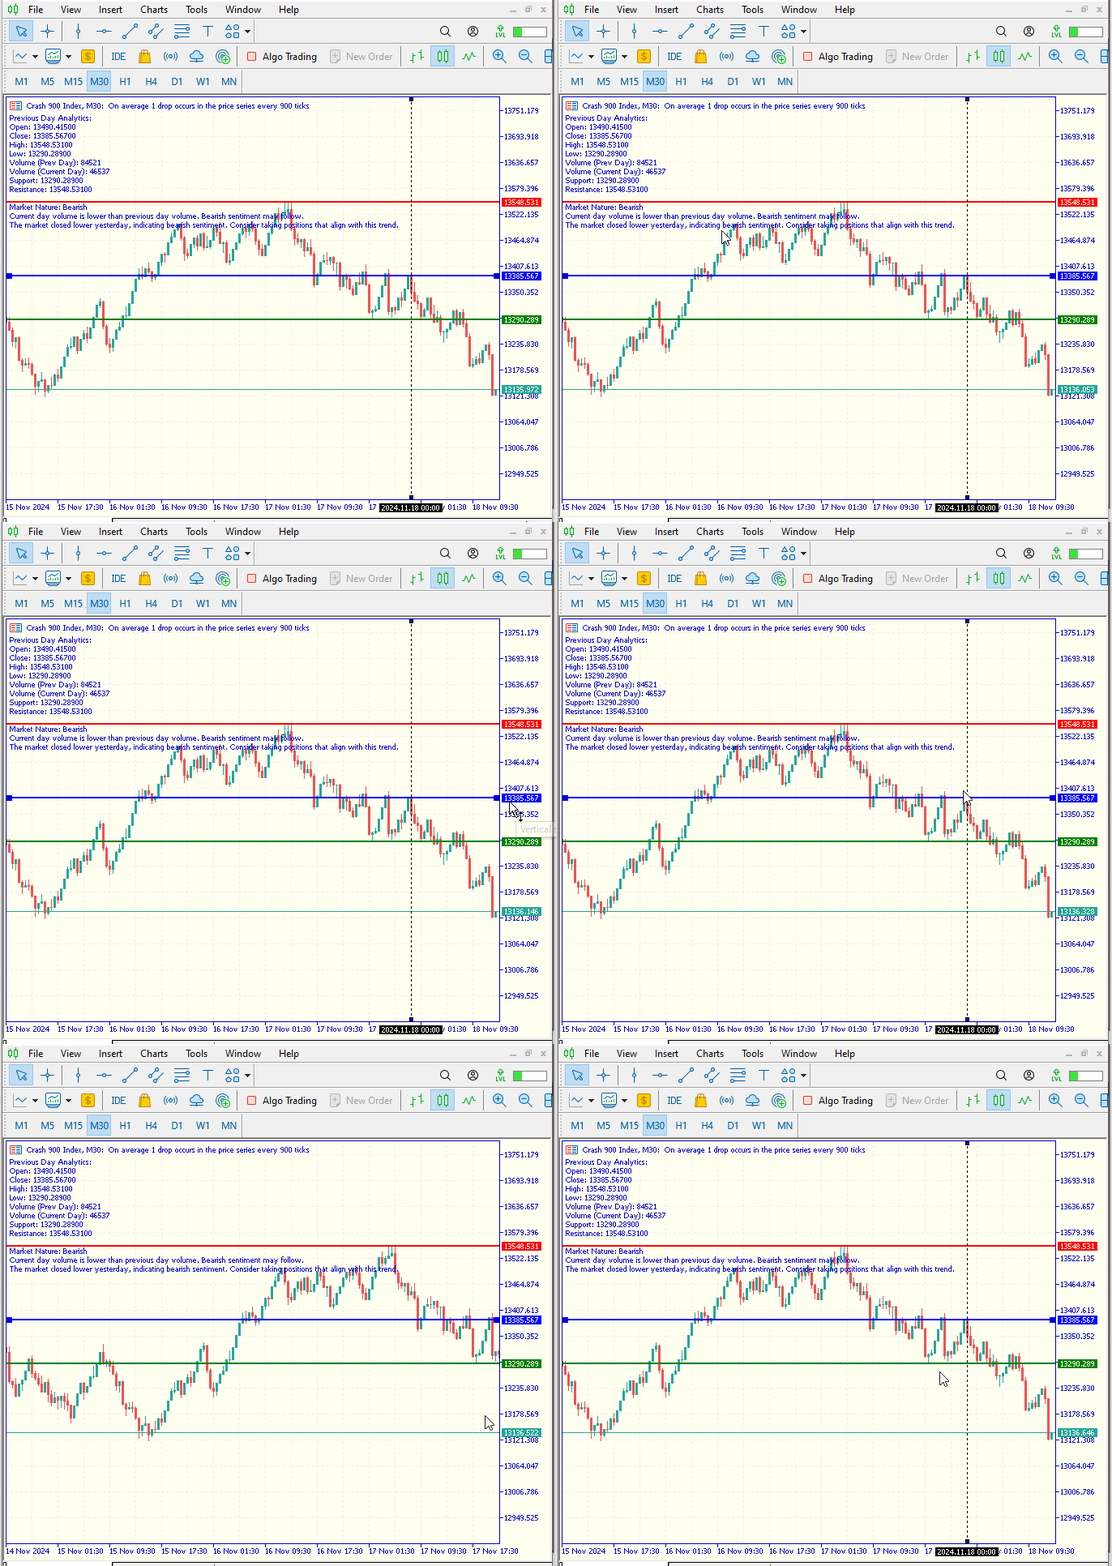
Fig 6. Tool Test Result 3
On the Crash 900 Index Fig 6, the information was also clearly presented, revealing a bearish sentiment that developed swiftly and without any reversal.
Lastly, we analyzed the USDCNH pair, as detailed below.
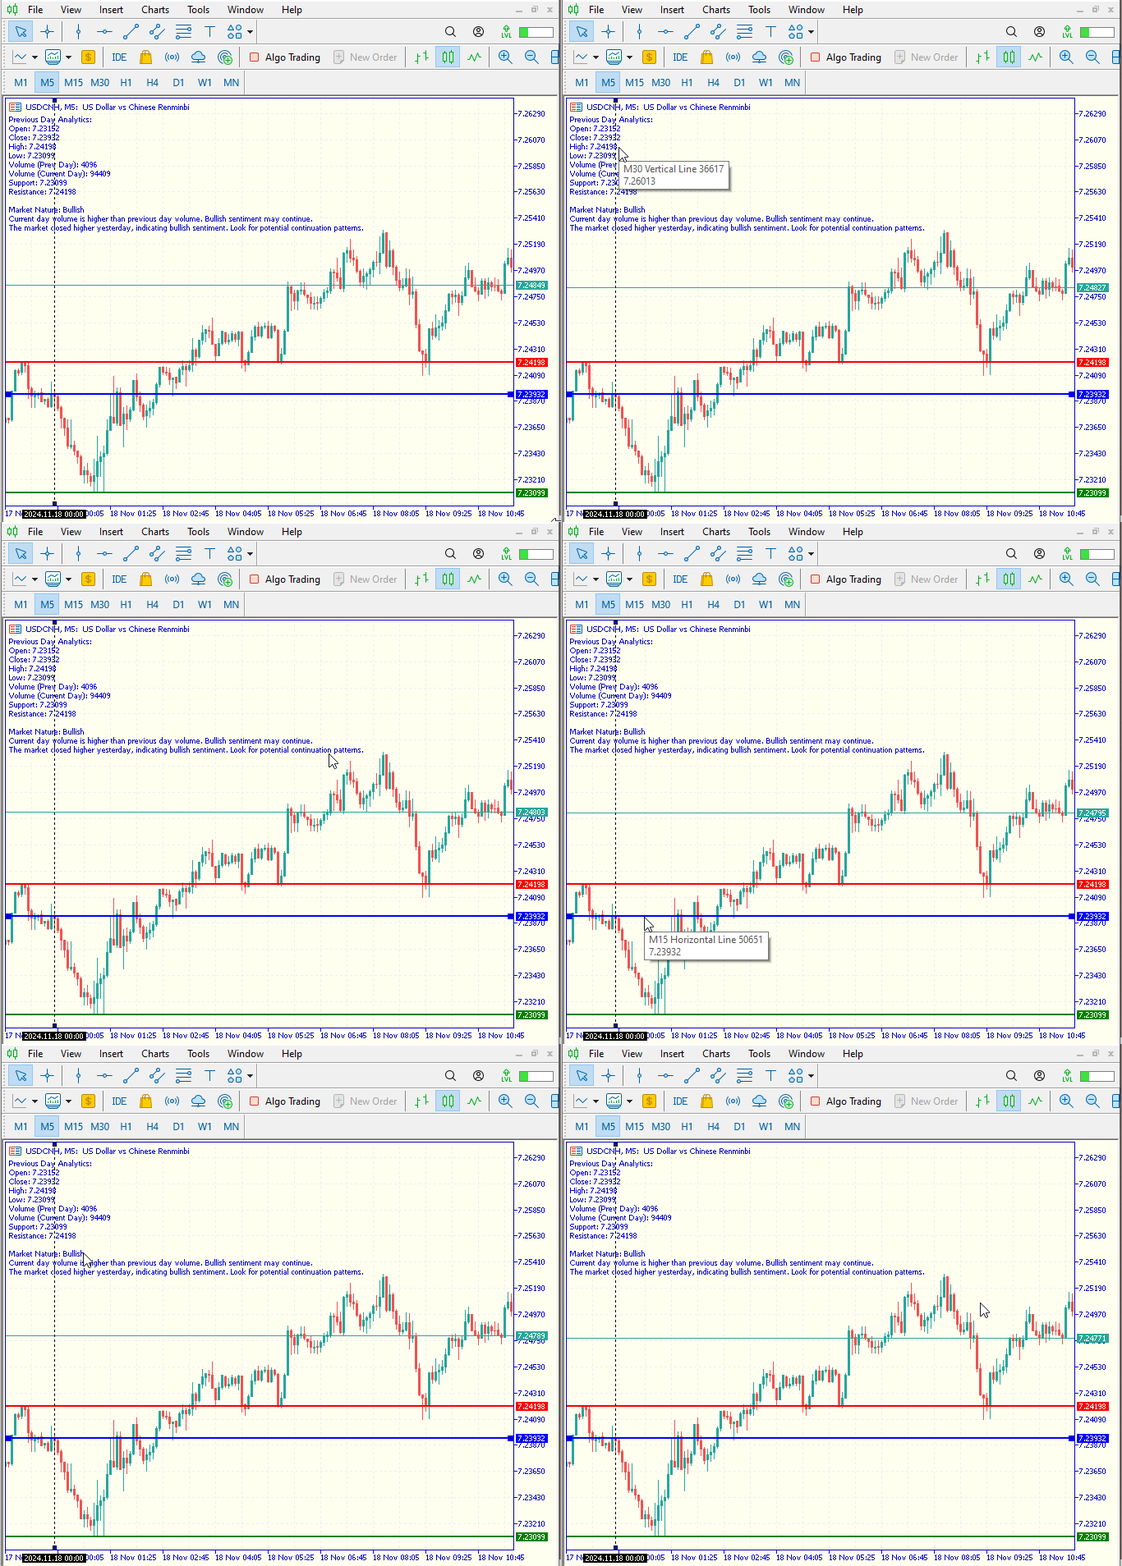
Fig 7. Tool Test Result 4
In Figure 7 above, the tool performed exceptionally well, signaling a bullish market movement. The market responded accordingly, respecting both the resistance and support levels.
Additionally, during the testing process of the tool, Figure 3 (Boom 300 index) presents some notable results. It clearly illustrates the start and end prices from the previous day, providing valuable insights into market analysis and market behavior. The data also indicates a bearish trend, as identified by the tool's navigation.
Conclusion
Having successfully developed and tested the tool, I can confidently say that the analytical comment tool is robust. Its ability to quickly analyze previous market movements, identify support and resistance levels, calculate trading volumes, and provide insights on expected future price movements based on gathered information is impressive.
The information is presented clearly, which enhances usability. I encourage traders to integrate their own trading strategies alongside this tool to improve their results and decision-making processes. Additionally, I have observed that the tool performs optimally as the day progresses, as it calculates current time volumes that may be necessary for accurate analysis.
| Date | Tool Name | Description | Version | Updates | Notes |
|---|---|---|---|---|---|
| 01/10/24 | Chart Projector | Script to overlay the previous day's price action with ghost effect. | 1.0 | Initial Release | First tool in Lynnchris Toolchest |
| 18/11/24 | Analytical Comment | It provides previous day's information in a tabular format, as well as anticipates the future direction of the market. | 1.0 | Initial Release | Second tool in the Lynnchris Tool Chest |
 Creating a Trading Administrator Panel in MQL5 (Part VI):Trade Management Panel (II)
 Mutual information as criteria for Stepwise Feature Selection
 Developing a Replay System (Part 53): Things Get Complicated (V)
 Data Science and ML (Part 32): Keeping your AI models updated, Online Learning
- Free trading apps
- Over 8,000 signals for copying
- Economic news for exploring financial markets
You agree to website policy and terms of use