William Gann methods (Part I): Creating Gann Angles indicator

Introduction
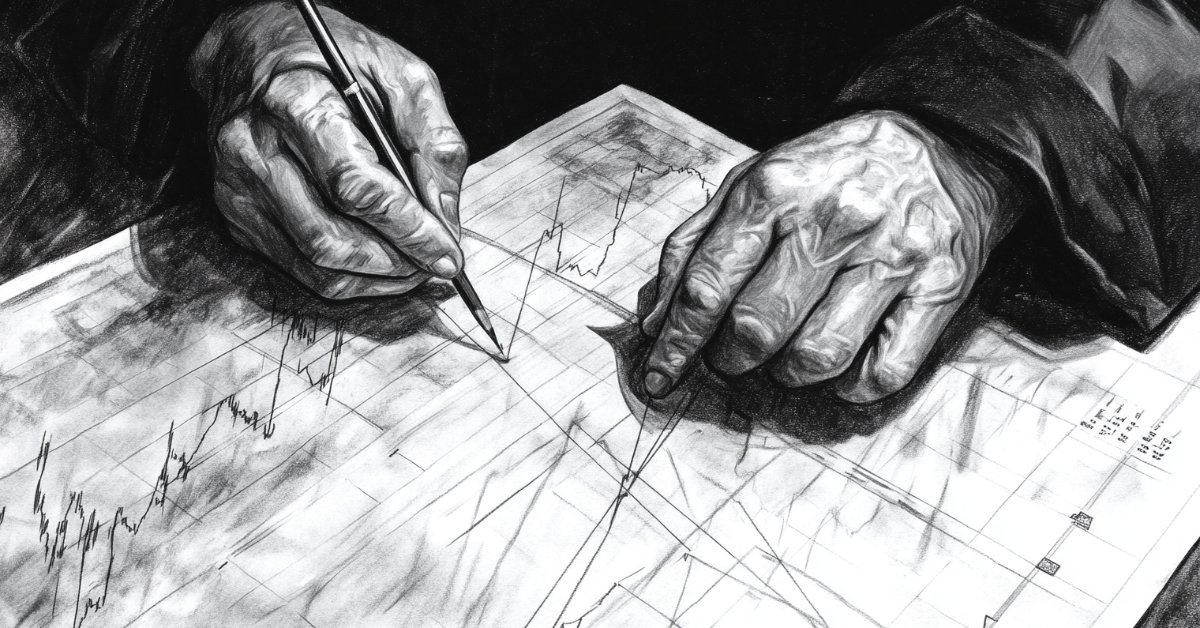
William Delbert Gann is a legendary trader and technical analyst whose innovative methods of market analysis still attract interest from modern traders. One of the key tools in Gann's arsenal were his famous angles, used to forecast price movements and identify potential support and resistance levels.
In this article, we will dive into the world of William Gann's trading methods, starting with creating Gann Angles indicator in MQL5. We will go through the theory behind this tool and implement it step by step as a custom indicator for the MetaTrader 5 platform.
Whether you are an experienced trader looking for new analysis tools or a beginner looking to expand your arsenal of technical indicators, this article will help you better understand and apply one of William Gann's most intriguing methods in your trading.
History of creating Gann angles
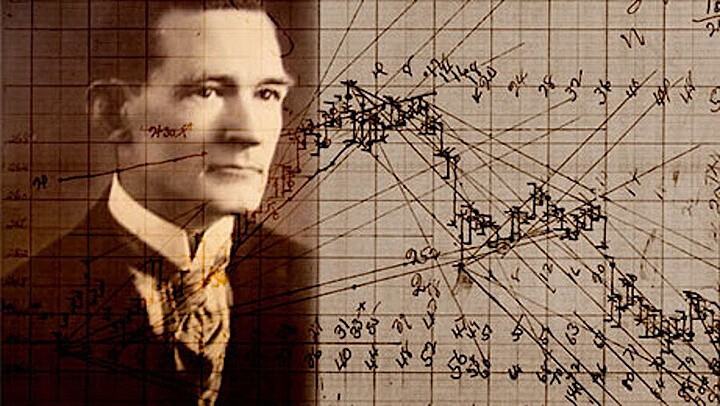
William Delbert Gann (1878-1955) developed his system of angles in the early 20th century based on years of research into market movements and his unique understanding of the relationship between time and price.
Gann believed that markets moved in predictable geometric patterns and that these movements could be predicted using a combination of mathematics, geometry and astrology. He developed the concept of angles, which are diagonal lines on a chart that reflect the perfect balance between time and price movement.
Key to Gann's theory was the idea that a 45 degree angle (known as the 1x1 angle) represented the perfect balance between time and price. He believed that when the price moves up or down at this angle, it indicates a balanced and stable trend.
Gann also developed other angles such as 2x1, 3x1, 4x1 and their reciprocals which represent different relationships between time and price. These angles became the basis for his trading system and market analysis.
While some aspects of Gann's work remain controversial, his methods, including Gann angles, continue to attract the attention of traders and analysts around the world and remain relevant in modern trading.
Gann Angle theory and its importance in technical analysis
Gann Angle theory is based on the concept that market movements follow predictable geometric patterns that can be identified using special angle plots on a chart. The theory is based on the idea of a balance between time and price, where a 1x1 angle (45 degrees) represents a perfect balance, assuming a price change of one unit per time period.
Gann developed a system of different angles such as 2x1, 3x1, 4x1 and their reciprocals, each of which reflects a specific relationship between time and price movement. These angles serve as dynamic support and resistance levels, helping traders determine the strength and direction of a trend. Steeper angles indicate a stronger trend, while flatter angles indicate a weaker movement.
Basic principles of constructing Gann angles
The construction of Gann angles is based on several key principles that allow traders to effectively use this tool in technical analysis. The choice of the starting point (which is usually a significant minimum or maximum on the chart) is of primary importance. It is from this point that the construction of angles begins.
The base angle is considered to be the 1x1 angle that forms a 45 degree line on the chart. This angle reflects the perfect balance between time and price, where the price changes by one unit in one period of time. Other angles, such as 2x1, 3x1, 4x1 and their reciprocals, are constructed relative to this base angle.
When plotting, it is important to consider the chart scale. Traders often use special templates or tools to ensure accurate angles. The angle lines continue into the future, allowing one to forecast potential support and resistance levels.
Types of Gann angles and their interpretation
William Gann developed a system of angles, each with its own unique meaning and interpretation in technical analysis. 1x1, or 45 degrees, is considered to be the main angle, which reflects the balance between time and price. This angle serves as a basic guideline for assessing the strength of the trend.
The 2x1 angle (63.75 degrees) indicates a stronger price move where the price is rising twice as fast as time. This is often interpreted as a sign of a strong bullish trend. In contrast, a 1x2 angle (26.25 degrees) indicates a slower price increase relative to time, which may indicate a weakening trend.
The 3x1 (71.25 degrees) and 4x1 (75 degrees) angles represent even more aggressive price action and are usually associated with very strong trends or potential market overheating. Their reciprocals - 1x3 (18.75 degrees) and 1x4 (15 degrees) - can indicate strong resistance or support.
The interpretation of Gann angles is not limited to their slope alone. It is also important to consider how price interacts with these lines. A price crossing the angle line may signal a potential change in trend. If the price moves along the angle line, it is often interpreted as confirmation of the strength of the current trend.
Practical application of Gann angles in trading
Traders use these tools for a variety of purposes, from identifying trends to choosing entry and exit points for positions.
To determine a trend, one usually starts by plotting a 1x1 angle from a significant minimum or maximum. If the price moves above this line, it is interpreted as an uptrend, and if below, as a downtrend. Steeper angles, such as 2x1 or 3x1, are used to confirm the strength of the trend.
When choosing entry points, many traders look for moments when the price bounces off or breaks through the Gann angle line. For example, a bounce off the 1x1 line in the direction of the trend can be seen as a potential opportunity to enter a position.
For risk management, Gann angles are often used to set stop losses. A trader can place a stop loss just below the nearest angle line for a long position or just above it for a short position.
In long-term trading, Gann angles help determine the overall direction of the market. We can use shallower angles, such as 1x2 or 1x4, to assess long-term trends and make strategic decisions.
Examples of trading strategies using Gann angles
Gann angles provide traders with a wide range of options to create a variety of trading strategies. Here are some examples of how they can be used effectively in real trading.
The Angle Bounce strategy is based on the assumption that Gann angle lines often act as support or resistance levels. A trader looks for situations where the price approaches a Gann angle line (especially 1x1 or 2x1) and bounces off it. Entry into a position is carried out after confirmation of a rebound, for example, the formation of a candlestick reversal pattern.
Another popular strategy is Angle Breakout. Here the trader waits for the price to break through an important Gann angle line, especially if this is accompanied by an increase in trading volume. An upward breakout may signal a potential long position, while a downward breakout may signal a short position.
The Gann Fan strategy uses multiple angles radiating from a single point to form a fan-shaped structure. The trader analyzes how price interacts with the various fan lines, using this to determine support, resistance levels and potential reversal points.
Combining Angles and Time Cycles is a more complex strategy where the trader combines Gann angles with the concept of time cycles, also developed by Gann. Here the intersection points of important time lines with Gann angles are analyzed to determine critical moments for entering or exiting the market.
The multi-timeframe strategy involves analyzing Gann angles on different timeframes. For example, a trader might use a 1x1 angle on a daily chart to determine the overall trend, and then switch to an hourly chart to look for entry points using steeper angles.
Creating Gann Angles indicator in MQL5: Basic steps
Creating a Gann Angles indicator in MQL5 involves several key steps. This process requires an understanding of both the principles of constructing Gann angles and the specifics of programming in the MetaTrader 5 environment.
The first step is to define the indicator structure. Here we set the basic parameters, such as the indicator name, input parameters for setting angles and the required libraries.
The main logic for constructing Gann angles is located in the OnCalculate() function. Here we define the starting point for plotting the angles, calculate the coordinates for each angle, and draw the lines on the chart.
An important aspect is the correct calculation of the coordinates of the angles, taking into account the scale of the chart and the selected time interval. This requires a precise mathematical approach and an understanding of the geometry of Gann angles.
The final stage is testing and debugging the indicator. It is necessary to check the validity of the construction of angles on different timeframes and instruments.
Indicator code structure
Here is the basic code of the Gann Angles indicator that can be used in MetaTrader 5:
#property copyright "Copyright 2024, Evgeniy Shtenco"
#property link      "https://www.mql5.com/en/users/koshtenko"
#property version   "1.00"
#property indicator_chart_window

// Input parameters
input datetime StartDate = D'2023.01.01 00:00'; // Start date for analysis
input datetime EndDate = D'2023.12.31 23:59';   // End date for analysis
input color GannFanColor = clrBlue;             // Color for Gann Fan lines

// Global variables
double extremumPrice;
datetime extremumTime;
double oppositeExtremumPrice;
datetime oppositeExtremumTime;
bool isTrendUp;

//+------------------------------------------------------------------+
//| Custom indicator initialization function                         |
//+------------------------------------------------------------------+
int OnInit()
{
    return(INIT_SUCCEEDED);
}

//+------------------------------------------------------------------+
//| Custom indicator deinitialization function                       |
//+------------------------------------------------------------------+
void OnDeinit(const int reason)
{
    ObjectsDeleteAll(0, "GannFan_");
    ObjectsDeleteAll(0, "OppositeGannFan_");
}

//+------------------------------------------------------------------+
//| Custom indicator iteration function                              |
//+------------------------------------------------------------------+
int OnCalculate(const int rates_total,
                const int prev_calculated,
                const datetime &time[],
                const double &open[],
                const double &high[],
                const double &low[],
                const double &close[],
                const long &tick_volume[],
                const long &volume[],
                const int &spread[])
{
    if(rates_total < 1) return(0);

    // Clear previous objects
    if (prev_calculated == 0)
    {
        ObjectsDeleteAll(0, "GannFan_");
        ObjectsDeleteAll(0, "OppositeGannFan_");
    }

    // Find extremums within the specified date range
    FindExtremums(rates_total, high, low, time);

    // Draw Gann Fans
    DrawGannFan(extremumPrice, extremumTime);
    DrawOppositeGannFan(oppositeExtremumPrice, oppositeExtremumTime);

    return(rates_total);
}

//+------------------------------------------------------------------+
//| Find both extremums within the specified date range              |
//+------------------------------------------------------------------+
void FindExtremums(const int rates_total, const double &high[], const double &low[], const datetime &time[])
{
    int startIndex = -1;
    int endIndex = -1;

    for (int i = 0; i < rates_total; i++)
    {
        if (time[i] >= StartDate && startIndex == -1)
        {
            startIndex = i;
        }
        if (time[i] <= EndDate)
        {
            endIndex = i;
        }
    }

    if (startIndex == -1 || endIndex == -1 || startIndex > endIndex)
    {
        Print("Error: Invalid date range or no data available in the specified range");
        return;
    }

    int highestIndex = ArrayMaximum(high, startIndex, endIndex - startIndex + 1);
    int lowestIndex = ArrayMinimum(low, startIndex, endIndex - startIndex + 1);

    // Determine the most recent extremum
    if (time[highestIndex] > time[lowestIndex])
    {
        extremumPrice = high[highestIndex];
        extremumTime = time[highestIndex];
        oppositeExtremumPrice = low[lowestIndex];
        oppositeExtremumTime = time[lowestIndex];
        isTrendUp = false;
    }
    else
    {
        extremumPrice = low[lowestIndex];
        extremumTime = time[lowestIndex];
        oppositeExtremumPrice = high[highestIndex];
        oppositeExtremumTime = time[highestIndex];
        isTrendUp = true;
    }
}

//+------------------------------------------------------------------+
//| Draw Gann Fan                                                    |
//+------------------------------------------------------------------+
void DrawGannFan(double extremum, datetime extremumTime)
{
    double angles[] = {82.5, 75, 71.25, 63.75, 45, 26.25, 18.75, 15, 7.5};
    string angleNames[] = {"1x8", "1x4", "1x3", "1x2", "1x1", "2x1", "3x1", "4x1", "8x1"};

    datetime endTime = extremumTime + PeriodSeconds() * 300;

    for(int i = 0; i < ArraySize(angles); i++)
    {
        string label = "GannFan_" + angleNames[i];
        double angle = angles[i];

        double priceShift = MathTan(angle * M_PI / 180.0) * 300 * _Point;
        double endPrice;

        if(isTrendUp)
        {
            endPrice = extremum + priceShift;
        }
        else
        {
            endPrice = extremum - priceShift;
            angle = -angle; // Invert the angle for a downtrend
        }

        if(ObjectCreate(0, label, OBJ_TREND, 0, extremumTime, extremum, endTime, endPrice))
        {
            ObjectSetInteger(0, label, OBJPROP_COLOR, GannFanColor);
            ObjectSetInteger(0, label, OBJPROP_STYLE, STYLE_SOLID);
            ObjectSetInteger(0, label, OBJPROP_WIDTH, 1);
            ObjectSetInteger(0, label, OBJPROP_RAY_RIGHT, true);
            ObjectSetString(0, label, OBJPROP_TOOLTIP, "Gann Fan " + angleNames[i]);
        }
        else
        {
            Print("Failed to create Gann Fan line: ", GetLastError());
        }
    }
}

//+------------------------------------------------------------------+
//| Draw Opposite Gann Fan                                           |
//+------------------------------------------------------------------+
void DrawOppositeGannFan(double extremum, datetime extremumTime)
{
    double angles[] = {82.5, 75, 71.25, 63.75, 45, 26.25, 18.75, 15, 7.5};
    string angleNames[] = {"1x8", "1x4", "1x3", "1x2", "1x1", "2x1", "3x1", "4x1", "8x1"};

    datetime endTime = extremumTime + PeriodSeconds() * 300;

    for(int i = 0; i < ArraySize(angles); i++)
    {
        string label = "OppositeGannFan_" + angleNames[i];
        double angle = angles[i];

        double priceShift = MathTan(angle * M_PI / 180.0) * 300 * _Point;
        double endPrice;

        if(!isTrendUp) // Opposite trend
        {
            endPrice = extremum + priceShift;
        }
        else
        {
            endPrice = extremum - priceShift;
            angle = -angle; // Invert the angle for a downtrend
        }

        if(ObjectCreate(0, label, OBJ_TREND, 0, extremumTime, extremum, endTime, endPrice))
        {
            ObjectSetInteger(0, label, OBJPROP_COLOR, GannFanColor);
            ObjectSetInteger(0, label, OBJPROP_STYLE, STYLE_SOLID);
            ObjectSetInteger(0, label, OBJPROP_WIDTH, 1);
            ObjectSetInteger(0, label, OBJPROP_RAY_RIGHT, true);
            ObjectSetString(0, label, OBJPROP_TOOLTIP, "Opposite Gann Fan " + angleNames[i]);
        }
        else
        {
            Print("Failed to create Opposite Gann Fan line: ", GetLastError());
        }
    }
}

//+------------------------------------------------------------------+
//| ChartEvent function                                              |
//+------------------------------------------------------------------+
void OnChartEvent(const int id,
                  const long &lparam,
                  const double &dparam,
                  const string &sparam)
{
    // Redraw objects when chart changes
    if(id == CHARTEVENT_CHART_CHANGE)
    {
        // Find extremums and redraw Gann Fans
        int rates_total = Bars(_Symbol, PERIOD_CURRENT);
        double high[], low[];
        datetime time[];
        ArraySetAsSeries(high, true);
        ArraySetAsSeries(low, true);
        ArraySetAsSeries(time, true);
        CopyHigh(_Symbol, PERIOD_CURRENT, 0, rates_total, high);
        CopyLow(_Symbol, PERIOD_CURRENT, 0, rates_total, low);
        CopyTime(_Symbol, PERIOD_CURRENT, 0, rates_total, time);

        FindExtremums(rates_total, high, low, time);
        DrawGannFan(extremumPrice, extremumTime);
        DrawOppositeGannFan(oppositeExtremumPrice, oppositeExtremumTime);
    }
}
Main functions and their purpose
The code is a MetaTrader 5 indicator that draws Gann Fan angles on the chart. Here is a description of the main functions and their purpose:
- OnInit() is the indicator initialization function. In this case, it simply returns a successful initialization result.
- OnDeinit() is a deinitialization function that removes all objects created by the indicator when it is removed from the chart.
- OnCalculate() is the main function of the indicator. It is called at every tick. It clears previous objects, finds extremes in a given date range and draws Gann angles.
- FindExtremums() is a function for finding extremes (maximum and minimum) of a price in a given date range. It determines which extreme is more recent and establishes the direction of the trend.
- DrawGannFan() is a function for drawing the main Gann fan from the found extremum. It creates lines for nine different angles.
- DrawOppositeGannFan() is a function for drawing the opposite Gann fan from another extremum. It also creates lines for the nine angles, but in the opposite direction.
- OnChartEvent() is a function that responds to chart events. In this case, it redraws the Gann fans when the chart changes.
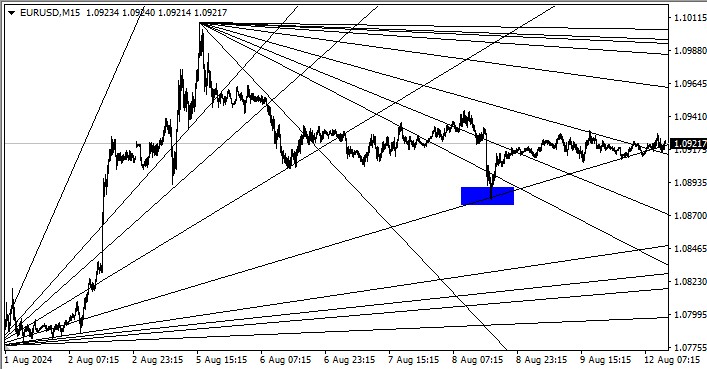
The indicator uses inputs to set the analysis date range (StartDate and EndDate) and the color of the lines (GannFanColor). It finds price extremes in this range, determines the trend direction and draws two Gann fans - one from the last extreme, the other from the opposite one. Each fan consists of nine lines corresponding to different Gann angles (82.5°, 75°, 71.25°, 63.75°, 45°, 26.25°, 18.75°, 15° and 7.5°).
The code also includes error handling and dynamic updating when the chart changes, making it quite robust and adaptive to different market conditions. Using MQL5 functions, such as ArrayMaximum() and ArrayMinimum(), ensures efficient data handling.
Gann angle calculation algorithm
The algorithm for calculating Gann angles in this indicator is based on the geometric construction of lines from the extremum point. Here are the key aspects of this algorithm:
- Determining extremes: The indicator finds the maximum and minimum price in a given time range. The later of these extremes is used as the starting point for the main Gann fan, and the earlier one for the opposite fan.
- Angle set: A fixed angle set is used: 82.5°, 75°, 71.25°, 63.75°, 45°, 26.25°, 18.75°, 15° and 7.5°. These angles correspond to the traditional Gann ratios: 1x8, 1x4, 1x3, 1x2, 1x1, 2x1, 3x1, 4x1 and 8x1.
- End point calculation: For each angle, the end point of the line is calculated. The calculation is based on the equation:
endPrice = extremum + MathTan(angle * M_PI / 180.0) * 300 * Point
- Here 300 is the conventional number of bars ahead used to construct the line.
- Inversion for a downtrend: If the trend is down, the angle is inverted (changed sign) so that the lines point downwards from the extreme point.
- Line construction: For each angle, a line object (OBJ_TREND) is created from the extreme point to the calculated end point. Lines are extended to the right to cover future data.
- Double fan: the algorithm is applied twice - once for the main fan from the last extremum, the second time for the opposite fan from the early extremum. This allows us to visualize potential support and resistance levels on both sides.
- Dynamic update: When the chart changes (for example, when new data arrives), the algorithm recalculates the extremes and rebuilds the fans, ensuring that the analysis is up-to-date.
The algorithm allows us to visualize classic Gann angles on a chart, providing the trader with a tool to analyze potential support, resistance levels and trend direction.
Is it possible to trade profitably?
Is it possible to trade profitably using Gann angles? This question does not have a clear answer, but with the right approach, profitable trading is quite possible. The key to success lies in the comprehensive use of this tool.
However, even with the most careful and meticulous analysis, one must not forget about risk management. This is the cornerstone of profitable trading. No method guarantees 100% success, so proper capital and risk management play a major role in long-term profitability.
Prospects for creating a Gann Angles-based EA

Creating an EA based on Gann Angles is an interesting and promising task for developers of algorithmic trading systems. Such an EA could automate the analysis and trading using the principles laid down in Gann's theory.
The basis for such an EA can be the already implemented Gann Angles indicator. The EA algorithm could include the analysis of the interaction of price with Gann lines, determining entry and exit points based on the intersection of these lines, as well as taking into account additional factors such as trading volume and market volatility.
One of the key benefits of an automated system based on Gann angles would be to remove the emotional factor from the trading decision making process. The EA could strictly follow the given strategy, without giving in to fear or greed, which often influences the decisions of a human trader.
However, developing such an EA faces a number of challenges. First of all, there is a need for accurate interpretation of the signals generated by Gann angles. Gann Theory is largely subjective and requires a deep understanding of the market, which is difficult to fully implement in the form of an algorithm.
Of course, the success of such an EA will largely depend on the depth of understanding of the Gann theory by the developer, as well as on their ability to effectively combine this theory with modern methods of market analysis and risk management.
Biggest challenge: Scaling angles
One of the most serious problems with creating and using indicators and EAs based on Gann angles is the difficulty in scaling them. This problem significantly affects the accuracy and efficiency of trading systems based on the Gann method.
The essence of the problem is that Gann angles, being geometric constructions, are highly dependent on the chart scale. When changing the scale of the time axis or price scale, the visual representation of angles may become significantly distorted. What looks like a perfect 1x1 (45 degree) angle at one scale may turn into a completely different angle when you change the scale.
This creates serious difficulties for software implementation. The indicator or EA should constantly take into account the current scale of the chart and adjust the angle calculations accordingly. Moreover, the very concept of "unit of time equal to unit of price" Gann angles are based on becomes ambiguous when working with different financial instruments and time frames.
Attempts to solve this problem often lead to compromises. Some developers fix the scale, which limits the applicability of the tool. Others introduce complex algorithms for recalculating angles, which can reduce the speed of the indicator or EA.
In addition, the scaling issue makes it difficult to compare analysis results across different tools or timeframes. An angle that works effectively on a daily chart of one currency pair may produce completely different results on an hourly chart, or for another trading instrument.
This issue calls into question the universal applicability of Gann angles in automated trading. It requires developers to have a deep understanding of not only Gann theory, but also the specifics of working with charts in trading platforms.
Conclusion
Gann angles are a unique technical analysis tool that continues to attract the attention of traders and trading system developers. Our review showed that creating Gann angles indicator in MQL5 is quite feasible, and the provided code serves as a good starting point for further development.
However, using Gann angles in automated trading comes with a number of significant challenges. The main one is the scaling problem, which makes it much more difficult to create a universal and reliable trading EA based on this method.
Despite these difficulties, the potential of Gann angles as a market analysis tool remains high. When used correctly, in combination with other technical analysis methods and proper risk management, they can be an effective addition to a trader's toolkit.
Translated from Russian by MetaQuotes Ltd.
Original article: https://www.mql5.com/ru/articles/15556
- Free trading apps
- Over 8,000 signals for copying
- Economic news for exploring financial markets
You agree to website policy and terms of use
Gunn was a brilliant trader, and astrologer, and numerologist, a mathematician who believed in magic numbers. A great soothsayer who predicted the beginning and end of the First and Second World Wars. He had a huge number of students, but as his followers claim, he did not give his strategy to anyone. Had a huge turnover of money, and by the end of his life came with a modest sum of $100000. I will look forward to the next articles about Gunn's genius personality, very interesting.
Forgot to mention, he had a private jet, which was a rarity in those days. Plus $100,000 back then, that's at least a multh of green now, if not 10 mulths.
P.S. - he passed on the strategy. In his writings. Who wanted, collected from different chapters of the complete TC. Gunn scattered it all so no one could get it for free.
Found a way of trading on Google
in the second picture - I don't understand the principle :-(
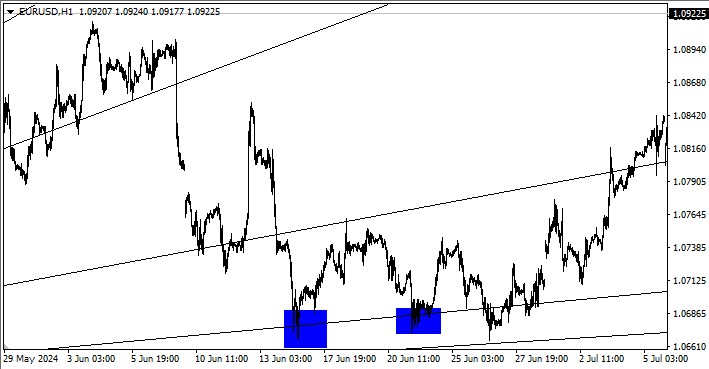
I'll give you a picture. Who understands Gunn, will immediately understand the principle of working with corners, where to look for a long entry and where to roll over.