
Building a Custom Market Regime Detection System in MQL5 (Part 1): Indicator

- Introduction
- Understanding Market Regimes
- Building the Statistical Foundation
- Implementing the Market Regime Detector
- Creating a Custom Indicator for Regime Visualization
- Conclusion
Introduction
The financial markets are in a constant state of flux, transitioning between periods of strong trends, sideways consolidation, and chaotic volatility. For algorithmic traders, this presents a significant challenge: a strategy that performs exceptionally well in trending markets often fails miserably in ranging conditions, while approaches designed for low volatility can blow up accounts when volatility spikes. Despite this reality, most trading systems are built with the implicit assumption that market behavior remains consistent over time.
This fundamental disconnect between market reality and trading system design leads to the all-too-familiar pattern of strategy performance degradation. A system works brilliantly during backtesting and initial deployment, only to falter as market conditions inevitably change. The trader then faces a difficult choice: abandon the strategy and start over, or endure drawdowns while hoping market conditions will once again favor their approach.
What if there was a better way? What if your trading system could objectively identify the current market regime and adapt its strategy accordingly? This is precisely what we'll build in this article: a comprehensive Market Regime Detection System in MQL5 that can classify market conditions into distinct regimes and provide a framework for adaptive trading strategies.
By the end of this article series, you'll have a complete implementation of a Market Regime Detection System that includes:- A robust statistical foundation for objective market classification
- A custom Market Regime Detector class that identifies trending, ranging, and volatile market conditions
- A custom indicator that visualizes regime changes directly on your charts
- An adaptive Expert Advisor that automatically selects appropriate strategies based on the current regime (Part 2)
- Practical examples of how to implement and optimize the system for your specific trading needs (Part 2)
Whether you're an experienced algorithmic trader looking to enhance your existing systems or a newcomer seeking to build more robust strategies from the start, this Market Regime Detection System will provide you with powerful tools to navigate the ever-changing landscape of financial markets.
Understanding Market Regimes
Before diving into the implementation details, it's crucial to understand what market regimes are and why they matter to traders. Markets don't behave uniformly over time; instead, they transition between distinct behavioral states or "regimes." These regimes significantly impact how price moves and, consequently, how trading strategies perform.
What Are Market Regimes?
Market regimes are distinct patterns of market behavior characterized by specific statistical properties of price movements. While there are various ways to classify market regimes, we'll focus on three primary types that are most relevant for trading strategy development:- Trending Regimes: Markets exhibit strong directional movement with minimal mean reversion. Price tends to make consistent moves in one direction with shallow pullbacks. Statistically, trending markets show positive autocorrelation in returns, meaning that price movements in one direction are likely to be followed by movements in the same direction.
- Ranging Regimes: Markets oscillate between support and resistance levels with strong mean-reverting tendencies. Price tends to bounce between defined boundaries rather than breaking out in either direction. Statistically, ranging markets show negative autocorrelation in returns, meaning that upward movements are likely to be followed by downward movements and vice versa.
- Volatile Regimes: Markets experience large, erratic price movements with unclear direction. These regimes often occur during periods of uncertainty, news events, or market stress. Statistically, volatile regimes show high standard deviation in returns with unpredictable autocorrelation patterns.
Understanding which regime the market is currently in provides crucial context for trading decisions. A strategy optimized for trending markets will likely perform poorly in ranging conditions, while mean-reversion strategies designed for ranging markets can be disastrous during strong trends.
Why Traditional Indicators Fall Short?
Most technical indicators were designed to identify specific price patterns or conditions rather than to classify market regimes. For example:- Moving averages and MACD can help identify trends but don't distinguish between trending and volatile regimes.
- RSI and Stochastic oscillators work well in ranging markets but generate false signals in trending conditions.
- Bollinger Bands adapt to volatility but don't explicitly identify regime transitions.
Statistical Foundations of Regime Detection
To build an effective regime detection system, we need to leverage statistical measures that can objectively classify market behavior. The key statistical concepts we'll use include:- Autocorrelation: Measures the correlation between a time series and a lagged version of itself. Positive autocorrelation indicates trending behavior, while negative autocorrelation suggests mean-reverting (ranging) behavior.
- Volatility: Measures the dispersion of returns, typically using standard deviation. Sudden increases in volatility often signal regime changes.
- Trend Strength: Can be quantified using various methods, including the absolute value of autocorrelation, the slope of linear regression, or specialized indicators like ADX.
By combining these statistical measures, we can create a robust framework for classifying market regimes objectively. In the next section, we'll implement these concepts in MQL5 code to build our Market Regime Detection System.
Building the Statistical Foundation
In this section, we'll implement the core statistical components needed for our Market Regime Detection System. We'll create a robust CStatistics class that will handle all the mathematical calculations required for regime classification.
The CStatistics Class
The foundation of our regime detection system is a powerful statistics class that can perform various calculations on price data. Let's examine the key components of this class:
//+------------------------------------------------------------------+
//| Class for statistical calculations                               |
//+------------------------------------------------------------------+
class CStatistics
{
private:
    double      m_data[];           // Data array for calculations
    int         m_dataSize;         // Size of the data array
    bool        m_isSorted;         // Flag indicating if data is sorted
    double      m_sortedData[];     // Sorted copy of data for percentile calculations

public:
    // Constructor and destructor
    CStatistics();
    ~CStatistics();

    // Data management methods
    bool        SetData(const double &data[], int size);
    bool        AddData(double value);
    void        Clear();

    // Basic statistical methods
    double      Mean() const;
    double      StandardDeviation() const;
    double      Variance() const;

    // Range and extremes
    double      Min() const;
    double      Max() const;
    double      Range() const;

    // Time series specific methods
    double      Autocorrelation(int lag) const;
    double      TrendStrength() const;
    double      MeanReversionStrength() const;

    // Percentile calculations
    double      Percentile(double percentile);
    double      Median();
};
This class provides a comprehensive set of statistical functions that will allow us to analyze price data and determine the current market regime. Let's look at some of the key methods in detail.
Constructor and Destructor
//+------------------------------------------------------------------+
//| Constructor                                                      |
//+------------------------------------------------------------------+
CStatistics::CStatistics()
{
    m_dataSize = 0;
    m_isSorted = false;
    ArrayResize(m_data, 0);
    ArrayResize(m_sortedData, 0);
}

//+------------------------------------------------------------------+
//| Destructor                                                       |
//+------------------------------------------------------------------+
CStatistics::~CStatistics()
{
    Clear();
}
Constructor and Destructor helps in initializing the class and deinitializing the class. The constructor initializes our member variables and arrays, while the destructor ensures proper cleanup by calling the Clear() method. This pattern of proper initialization and cleanup is essential in MQL5 to prevent memory leaks and ensure reliable operation.
Data Management Methods
Next, let's implement the data management methods that allow us to set, add, and clear data:
bool CStatistics::SetData(const double &data[], int size)
{
    if(size <= 0)
        return false;

    m_dataSize = size;
    ArrayResize(m_data, size);

    for(int i = 0; i < size; i++)
        m_data[i] = data[i];

    m_isSorted = false;
    return true;
}

bool CStatistics::AddData(double value)
{
    m_dataSize++;
    ArrayResize(m_data, m_dataSize);
    m_data[m_dataSize - 1] = value;
    m_isSorted = false;
    return true;
}

void CStatistics::Clear()
{
    m_dataSize = 0;
    ArrayResize(m_data, 0);
    ArrayResize(m_sortedData, 0);
    m_isSorted = false;
}
The SetData() method allows us to replace the entire data set with a new array, which is useful when processing historical price data. The AddData() method appends a single value to the existing data, which is handy for incremental updates as new price data becomes available. The Clear() method resets the object to its initial state, freeing any allocated memory.
Notice how we set m_isSorted = false whenever the data changes. This flag helps us optimize performance by only sorting the data when necessary for percentile calculations.
Basic statistical methods
Now, let's implement the basic statistical methods for calculating mean, standard deviation, and variance:
double CStatistics::Mean() const
{
    if(m_dataSize <= 0)
        return 0.0;

    double sum = 0.0;
    for(int i = 0; i < m_dataSize; i++)
        sum += m_data[i];

    return sum / m_dataSize;
}

double CStatistics::StandardDeviation() const
{
    if(m_dataSize <= 1)
        return 0.0;

    double mean = Mean();
    double sum = 0.0;

    for(int i = 0; i < m_dataSize; i++)
        sum += MathPow(m_data[i] - mean, 2);

    return MathSqrt(sum / (m_dataSize - 1));
}

double CStatistics::Variance() const
{
    if(m_dataSize <= 1)
        return 0.0;

    double stdDev = StandardDeviation();
    return stdDev * stdDev;
}
These methods implement standard statistical formulas. The Mean() method calculates the average of all data points. The StandardDeviation() method measures the dispersion of data points around the mean, which is crucial for identifying volatile market regimes. The Variance() method returns the square of the standard deviation, providing another measure of data dispersion.
Note how we handle edge cases, such as empty data sets or single data points, by returning zero. This defensive programming approach prevents errors when working with insufficient data.Range and Extremes Methods
//+------------------------------------------------------------------+
//| Calculate minimum value in the data                              |
//+------------------------------------------------------------------+
double CStatistics::Min() const
{
    if(m_dataSize <= 0)
        return 0.0;

    double min = m_data[0];
    for(int i = 1; i < m_dataSize; i++)
        if(m_data[i] < min)
            min = m_data[i];

    return min;
}

//+------------------------------------------------------------------+
//| Calculate maximum value in the data                              |
//+------------------------------------------------------------------+
double CStatistics::Max() const
{
    if(m_dataSize <= 0)
        return 0.0;

    double max = m_data[0];
    for(int i = 1; i < m_dataSize; i++)
        if(m_data[i] > max)
            max = m_data[i];

    return max;
}

//+------------------------------------------------------------------+
//| Calculate range (max - min) of the data                          |
//+------------------------------------------------------------------+
double CStatistics::Range() const
{
    return Max() - Min();
}
These methods provide additional insights into the data distribution. The Min() and Max() methods find the smallest and largest values in the data set, while the Range() method calculates the difference between them. These measures can be useful for identifying price boundaries in ranging markets.
Time Series Specific Methods
Now, let's implement the time series specific methods that are crucial for regime detection:
double CStatistics::Autocorrelation(int lag) const
{
    if(m_dataSize <= lag || lag <= 0)
        return 0.0;

    double mean = Mean();
    double numerator = 0.0;
    double denominator = 0.0;

    for(int i = 0; i < m_dataSize - lag; i++)
    {
        numerator += (m_data[i] - mean) * (m_data[i + lag] - mean);
    }

    for(int i = 0; i < m_dataSize; i++)
    {
        denominator += MathPow(m_data[i] - mean, 2);
    }

    if(denominator == 0.0)
        return 0.0;

    return numerator / denominator;
}

double CStatistics::TrendStrength() const
{
    // Use lag-1 autocorrelation as a measure of trend strength
    double ac1 = Autocorrelation(1);

    // Positive autocorrelation indicates trending behavior
    return ac1;
}

double CStatistics::MeanReversionStrength() const
{
    // Negative autocorrelation indicates mean-reverting behavior
    double ac1 = Autocorrelation(1);

    // Return the negative of autocorrelation, so positive values
    // indicate stronger mean reversion
    return -ac1;
}
The Autocorrelation() method calculates the correlation between the data series and a lagged version of itself. This is a powerful measure for distinguishing between trending and ranging markets. Positive autocorrelation (values greater than zero) indicates trending behavior, while negative autocorrelation (values less than zero) suggests mean-reverting or ranging behavior.
The TrendStrength() method uses lag-1 autocorrelation as a direct measure of trend strength. Higher positive values indicate stronger trends. The MeanReversionStrength() method returns the negative of autocorrelation, so positive values indicate stronger mean reversion tendencies.
These methods form the statistical backbone of our regime detection system, providing objective measures of market behavior that we'll use to classify regimes.
Percentile Calculations
Finally, let's implement methods for calculating percentiles and the median:
double CStatistics::Percentile(double percentile)
{
    if(m_dataSize <= 0 || percentile < 0.0 || percentile > 100.0)
        return 0.0;

    // Sort data if needed
    if(!m_isSorted)
    {
        ArrayResize(m_sortedData, m_dataSize);
        for(int i = 0; i < m_dataSize; i++)
            m_sortedData[i] = m_data[i];

        ArraySort(m_sortedData);
        m_isSorted = true;
    }

    // Calculate position
    double position = (percentile / 100.0) * (m_dataSize - 1);
    int lowerIndex = (int)MathFloor(position);
    int upperIndex = (int)MathCeil(position);

    // Handle edge cases
    if(lowerIndex == upperIndex)
        return m_sortedData[lowerIndex];

    // Interpolate
    double fraction = position - lowerIndex;
    return m_sortedData[lowerIndex] + fraction * (m_sortedData[upperIndex] - m_sortedData[lowerIndex]);
}

double CStatistics::Median()
{
    return Percentile(50.0);
}
The Percentile() method calculates the value below which a given percentage of observations fall. It first sorts the data (if not already sorted) and then uses linear interpolation to find the precise percentile value. The Median() method is a convenience function that returns the 50th percentile, representing the middle value of the data set.
Note the optimization with the m_isSorted flag, which ensures we only sort the data once, even if we calculate multiple percentiles. This is an example of how careful implementation can improve performance in MQL5 code.
With our CStatistics class complete, we now have a powerful set of tools for analyzing price data and detecting market regimes. In the next section, we'll build on this foundation to create the Market Regime Detector class.
Implementing the Market Regime Detector
Now that we have our statistical foundation in place, we can build the core component of our system: the Market Regime Detector. This class will use the statistical measures we've implemented to classify market conditions into specific regimes.
Market Regime Enumeration
First, let's define the market regime types that our system will identify. We'll create a separate file called MarketRegimeEnum.mqh to ensure the enum definition is available to all components of our system:
// Define market regime types
enum ENUM_MARKET_REGIME
{
    REGIME_TRENDING_UP = 0,    // Trending up regime
    REGIME_TRENDING_DOWN = 1,  // Trending down regime
    REGIME_RANGING = 2,        // Ranging/sideways regime
    REGIME_VOLATILE = 3,       // Volatile/chaotic regime
    REGIME_UNDEFINED = 4       // Undefined regime (default)
};
This enumeration defines the five possible market regimes that our system can detect. We'll use these values throughout our implementation to represent the current market state.
The CMarketRegimeDetector Class
The Market Regime Detector class combines our statistical tools with regime classification logic. Let's examine its structure:
class CMarketRegimeDetector
{
private:
    // Configuration
    int         m_lookbackPeriod;       // Period for calculations
    int         m_smoothingPeriod;      // Period for smoothing regime transitions
    double      m_trendThreshold;       // Threshold for trend detection
    double      m_volatilityThreshold;  // Threshold for volatility detection

    // Data buffers
    double      m_priceData[];          // Price data buffer
    double      m_returns[];            // Returns data buffer
    double      m_volatility[];         // Volatility buffer
    double      m_trendStrength[];      // Trend strength buffer
    double      m_regimeBuffer[];       // Regime classification buffer

    // Statistics objects
    CStatistics m_priceStats;           // Statistics for price data
    CStatistics m_returnsStats;         // Statistics for returns data
    CStatistics m_volatilityStats;      // Statistics for volatility data

    // Current state
    ENUM_MARKET_REGIME m_currentRegime; // Current detected regime

    // Helper methods
    void        CalculateReturns();
    void        CalculateVolatility();
    void        CalculateTrendStrength();
    ENUM_MARKET_REGIME DetermineRegime();

public:
    // Constructor and destructor
    CMarketRegimeDetector(int lookbackPeriod = 100, int smoothingPeriod = 10);
    ~CMarketRegimeDetector();

    // Configuration methods
    void        SetLookbackPeriod(int period);
    void        SetSmoothingPeriod(int period);
    void        SetTrendThreshold(double threshold);
    void        SetVolatilityThreshold(double threshold);

    // Processing methods
    bool        Initialize();
    bool        ProcessData(const double &price[], int size);

    // Access methods
    ENUM_MARKET_REGIME GetCurrentRegime() const { return m_currentRegime; }
    string      GetRegimeDescription() const;
    double      GetTrendStrength() const;
    double      GetVolatility() const;

    // Buffer access for indicators
    bool        GetRegimeBuffer(double &buffer[]) const;
    bool        GetTrendStrengthBuffer(double &buffer[]) const;
    bool        GetVolatilityBuffer(double &buffer[]) const;
};
This class encapsulates all the functionality needed to detect market regimes. Let's implement each method in detail.
Constructor and Destructor
First, let's implement the constructor and destructor:
CMarketRegimeDetector::CMarketRegimeDetector(int lookbackPeriod, int smoothingPeriod)
{
    // Set default parameters
    m_lookbackPeriod = (lookbackPeriod > 20) ? lookbackPeriod : 100;
    m_smoothingPeriod = (smoothingPeriod > 0) ? smoothingPeriod : 10;
    m_trendThreshold = 0.2;
    m_volatilityThreshold = 1.5;

    // Initialize current regime
    m_currentRegime = REGIME_UNDEFINED;

    // Initialize buffers
    ArrayResize(m_priceData, m_lookbackPeriod);
    ArrayResize(m_returns, m_lookbackPeriod - 1);
    ArrayResize(m_volatility, m_lookbackPeriod - 1);
    ArrayResize(m_trendStrength, m_lookbackPeriod - 1);
    ArrayResize(m_regimeBuffer, m_lookbackPeriod);

    // Initialize buffers with zeros
    ArrayInitialize(m_priceData, 0.0);
    ArrayInitialize(m_returns, 0.0);
    ArrayInitialize(m_volatility, 0.0);
    ArrayInitialize(m_trendStrength, 0.0);
    ArrayInitialize(m_regimeBuffer, (double)REGIME_UNDEFINED);
}

CMarketRegimeDetector::~CMarketRegimeDetector()
{
    // Free memory (not strictly necessary in MQL5, but good practice)
    ArrayFree(m_priceData);
    ArrayFree(m_returns);
    ArrayFree(m_volatility);
    ArrayFree(m_trendStrength);
    ArrayFree(m_regimeBuffer);
}
The constructor initializes all member variables and arrays with default values. It includes parameter validation to ensure the lookback period is at least 20 bars (for statistical significance) and the smoothing period is positive. The destructor frees the memory allocated for the arrays, which is good practice even though MQL5 has automatic garbage collection.
Configuration Methods
Next, let's implement the configuration methods that allow users to customize the detector's behavior:
void CMarketRegimeDetector::SetLookbackPeriod(int period)
{
    if(period <= 20)
        return;

    m_lookbackPeriod = period;

    // Resize buffers
    ArrayResize(m_priceData, m_lookbackPeriod);
    ArrayResize(m_returns, m_lookbackPeriod - 1);
    ArrayResize(m_volatility, m_lookbackPeriod - 1);
    ArrayResize(m_trendStrength, m_lookbackPeriod - 1);
    ArrayResize(m_regimeBuffer, m_lookbackPeriod);

    // Re-initialize
    Initialize();
}

void CMarketRegimeDetector::SetSmoothingPeriod(int period)
{
    if(period <= 0)
        return;

    m_smoothingPeriod = period;
}

void CMarketRegimeDetector::SetTrendThreshold(double threshold)
{
    if(threshold <= 0.0)
        return;

    m_trendThreshold = threshold;
}

void CMarketRegimeDetector::SetVolatilityThreshold(double threshold)
{
    if(threshold <= 0.0)
        return;

    m_volatilityThreshold = threshold;
}
These methods allow users to customize the detector's parameters to suit their specific trading instruments and timeframes. The SetLookbackPeriod() method is particularly important as it resizes all the internal buffers to match the new period. The other methods simply update the corresponding parameters after validating the input values.
Initialization and Processing Methods
Now, let's implement the initialization and data processing methods:
bool CMarketRegimeDetector::Initialize()
{
    // Initialize buffers with zeros
    ArrayInitialize(m_priceData, 0.0);
    ArrayInitialize(m_returns, 0.0);
    ArrayInitialize(m_volatility, 0.0);
    ArrayInitialize(m_trendStrength, 0.0);
    ArrayInitialize(m_regimeBuffer, (double)REGIME_UNDEFINED);

    // Reset current regime
    m_currentRegime = REGIME_UNDEFINED;

    return true;
}

bool CMarketRegimeDetector::ProcessData(const double &price[], int size)
{
    if(size < m_lookbackPeriod)
        return false;

    // Copy the most recent price data
    for(int i = 0; i < m_lookbackPeriod; i++)
        m_priceData[i] = price[size - m_lookbackPeriod + i];

    // Calculate returns, volatility, and trend strength
    CalculateReturns();
    CalculateVolatility();
    CalculateTrendStrength();

    // Determine the current market regime
    m_currentRegime = DetermineRegime();

    // Update regime buffer for indicator display
    for(int i = 0; i < m_lookbackPeriod - 1; i++)
        m_regimeBuffer[i] = m_regimeBuffer[i + 1];

    m_regimeBuffer[m_lookbackPeriod - 1] = (double)m_currentRegime;

    return true;
}
The Initialize() method resets all buffers and the current regime to their default values. The ProcessData() method is the heart of the detector, processing new price data and updating the regime classification. It first copies the most recent price data, then calculates returns, volatility, and trend strength, and finally determines the current market regime. It also updates the regime buffer for indicator display, shifting the values to make room for the new regime.
Calculation Methods
Let's implement the calculation methods that compute the statistical measures used for regime detection:
void CMarketRegimeDetector::CalculateReturns()
{
    for(int i = 0; i < m_lookbackPeriod - 1; i++)
    {
        // Calculate percentage returns
        if(m_priceData[i] != 0.0)
            m_returns[i] = (m_priceData[i + 1] - m_priceData[i]) / m_priceData[i] * 100.0;
        else
            m_returns[i] = 0.0;
    }

    // Update returns statistics
    m_returnsStats.SetData(m_returns, m_lookbackPeriod - 1);
}

void CMarketRegimeDetector::CalculateVolatility()
{
    // Use a rolling window for volatility calculation
    int windowSize = MathMin(20, m_lookbackPeriod - 1);

    for(int i = 0; i < m_lookbackPeriod - 1; i++)
    {
        if(i < windowSize - 1)
        {
            m_volatility[i] = 0.0;
            continue;
        }

        double sum = 0.0;
        double mean = 0.0;

        // Calculate mean
        for(int j = 0; j < windowSize; j++)
            mean += m_returns[i - j];

        mean /= windowSize;

        // Calculate standard deviation
        for(int j = 0; j < windowSize; j++)
            sum += MathPow(m_returns[i - j] - mean, 2);

        m_volatility[i] = MathSqrt(sum / (windowSize - 1));
    }

    // Update volatility statistics
    m_volatilityStats.SetData(m_volatility, m_lookbackPeriod - 1);
}

void CMarketRegimeDetector::CalculateTrendStrength()
{
    // Use a rolling window for trend strength calculation
    int windowSize = MathMin(50, m_lookbackPeriod - 1);

    for(int i = 0; i < m_lookbackPeriod - 1; i++)
    {
        if(i < windowSize - 1)
        {
            m_trendStrength[i] = 0.0;
            continue;
        }

        double window[];
        ArrayResize(window, windowSize);

        // Copy data to window
        for(int j = 0; j < windowSize; j++)
            window[j] = m_returns[i - j];

        // Create temporary statistics object
        CStatistics tempStats;
        tempStats.SetData(window, windowSize);

        // Calculate trend strength using autocorrelation
        m_trendStrength[i] = tempStats.TrendStrength();
    }

    // Update price statistics
    m_priceStats.SetData(m_priceData, m_lookbackPeriod);
}
These methods calculate the key statistical measures used for regime detection:
- CalculateReturns() computes percentage returns from the price data, which are more suitable for statistical analysis than raw prices.
- CalculateVolatility() uses a rolling window approach to calculate the standard deviation of returns at each point in time, providing a measure of market volatility.
- CalculateTrendStrength() also uses a rolling window approach, but it creates a temporary CStatistics object for each window and uses its TrendStrength() method to compute the autocorrelation-based trend strength.
These rolling window calculations provide a more responsive and accurate assessment of market conditions than using the entire lookback period for each calculation.
Regime Classification
The heart of our system is the DetermineRegime() method, which classifies the current market state based on statistical measures:
ENUM_MARKET_REGIME CMarketRegimeDetector::DetermineRegime()
{
    // Get the latest values
    double latestTrendStrength = m_trendStrength[m_lookbackPeriod - 2];
    double latestVolatility = m_volatility[m_lookbackPeriod - 2];

    // Get the average volatility for comparison
    double avgVolatility = 0.0;
    int count = 0;

    for(int i = m_lookbackPeriod - 22; i < m_lookbackPeriod - 2; i++)
    {
        if(i >= 0)
        {
            avgVolatility += m_volatility[i];
            count++;
        }
    }

    if(count > 0)
        avgVolatility /= count;
    else
        avgVolatility = latestVolatility;

    // Determine price direction
    double priceChange = m_priceData[m_lookbackPeriod - 1] - m_priceData[m_lookbackPeriod - m_smoothingPeriod - 1];

    // Classify the regime
    if(latestVolatility > avgVolatility * m_volatilityThreshold)
    {
        // Highly volatile market
        return REGIME_VOLATILE;
    }
    else if(MathAbs(latestTrendStrength) > m_trendThreshold)
    {
        // Trending market
        if(priceChange > 0)
            return REGIME_TRENDING_UP;
        else
            return REGIME_TRENDING_DOWN;
    }
    else
    {
        // Ranging market
        return REGIME_RANGING;
    }
}
This method implements a hierarchical classification approach: - First, it checks if the market is highly volatile by comparing the latest volatility to the average volatility over the past 20 bars. If volatility exceeds the threshold, the market is classified as volatile.
- If the market is not volatile, it checks if there's a significant trend by comparing the absolute trend strength to the trend threshold. If a trend is detected, it determines the direction (up or down) based on the price change over the smoothing period.
- If neither volatility nor trend is detected, the market is classified as ranging.
This hierarchical approach ensures that volatility takes precedence over trend detection, as trend-following strategies are particularly vulnerable in volatile markets.
Access Methods
Finally, let's implement the access methods that provide information about the current market regime:
string CMarketRegimeDetector::GetRegimeDescription() const
{
    switch(m_currentRegime)
    {
        case REGIME_TRENDING_UP:
            return "Trending Up";

        case REGIME_TRENDING_DOWN:
            return "Trending Down";

        case REGIME_RANGING:
            return "Ranging";

        case REGIME_VOLATILE:
            return "Volatile";

        default:
            return "Undefined";
    }
}

double CMarketRegimeDetector::GetTrendStrength() const
{
    if(m_lookbackPeriod <= 2)
        return 0.0;

    return m_trendStrength[m_lookbackPeriod - 2];
}

double CMarketRegimeDetector::GetVolatility() const
{
    if(m_lookbackPeriod <= 2)
        return 0.0;

    return m_volatility[m_lookbackPeriod - 2];
}

bool CMarketRegimeDetector::GetRegimeBuffer(double &buffer[]) const
{
    if(ArraySize(buffer) < m_lookbackPeriod)
        ArrayResize(buffer, m_lookbackPeriod);

    for(int i = 0; i < m_lookbackPeriod; i++)
        buffer[i] = m_regimeBuffer[i];

    return true;
}

bool CMarketRegimeDetector::GetTrendStrengthBuffer(double &buffer[]) const
{
    int size = m_lookbackPeriod - 1;

    if(ArraySize(buffer) < size)
        ArrayResize(buffer, size);

    for(int i = 0; i < size; i++)
        buffer[i] = m_trendStrength[i];

    return true;
}

bool CMarketRegimeDetector::GetVolatilityBuffer(double &buffer[]) const
{
    int size = m_lookbackPeriod - 1;

    if(ArraySize(buffer) < size)
        ArrayResize(buffer, size);

    for(int i = 0; i < size; i++)
        buffer[i] = m_volatility[i];

    return true;
}
These methods provide access to the current regime and its characteristics:
- GetRegimeDescription() returns a human-readable description of the current regime.
- GetTrendStrength() and GetVolatility() return the latest trend strength and volatility values.
- GetRegimeBuffer() , GetTrendStrengthBuffer() , and GetVolatilityBuffer() copy the internal buffers to external arrays, which is useful for indicator display.
With our CMarketRegimeDetector class complete, we now have a powerful tool for detecting market regimes. In the next section, we'll create a custom indicator that visualizes these regimes directly on the price chart.
Creating a Custom Indicator for Regime Visualization
Now that we have our Market Regime Detector class, let's create a custom indicator that visualizes the detected regimes directly on the price chart. This will provide traders with an intuitive way to see regime changes and adapt their strategies accordingly.
The MarketRegimeIndicator
Our custom indicator will display the current market regime, trend strength, and volatility directly on the chart. Here's the implementation:#property indicator_chart_window #property indicator_buffers 3 #property indicator_plots 3 // Include the Market Regime Detector #include "MarketRegimeEnum.mqh" #include "MarketRegimeDetector.mqh" // Indicator input parameters input int LookbackPeriod = 100; // Lookback period for calculations input int SmoothingPeriod = 10; // Smoothing period for regime transitions input double TrendThreshold = 0.2; // Threshold for trend detection (0.1-0.5) input double VolatilityThreshold = 1.5; // Threshold for volatility detection (1.0-3.0) // Indicator buffers double RegimeBuffer[]; // Buffer for regime classification double TrendStrengthBuffer[]; // Buffer for trend strength double VolatilityBuffer[]; // Buffer for volatility // Global variables CMarketRegimeDetector *Detector = NULL;The indicator uses three buffers to store and display different aspects of market regimes:
- RegimeBuffer - Stores the numerical representation of the current regime
- TrendStrengthBuffer - Stores the trend strength values
- VolatilityBuffer - Stores the volatility values
Indicator Initialization
The OnInit() function sets up the indicator buffers and creates the Market Regime Detector:
int OnInit()
{
    // Set indicator buffers
    SetIndexBuffer(0, RegimeBuffer, INDICATOR_DATA);
    SetIndexBuffer(1, TrendStrengthBuffer, INDICATOR_DATA);
    SetIndexBuffer(2, VolatilityBuffer, INDICATOR_DATA);

    // Set indicator labels
    PlotIndexSetString(0, PLOT_LABEL, "Market Regime");
    PlotIndexSetString(1, PLOT_LABEL, "Trend Strength");
    PlotIndexSetString(2, PLOT_LABEL, "Volatility");

    // Set indicator styles
    PlotIndexSetInteger(0, PLOT_DRAW_TYPE, DRAW_LINE);
    PlotIndexSetInteger(1, PLOT_DRAW_TYPE, DRAW_LINE);
    PlotIndexSetInteger(2, PLOT_DRAW_TYPE, DRAW_LINE);

    // Set line colors
    PlotIndexSetInteger(1, PLOT_LINE_COLOR, clrBlue);
    PlotIndexSetInteger(2, PLOT_LINE_COLOR, clrRed);

    // Set line styles
    PlotIndexSetInteger(1, PLOT_LINE_STYLE, STYLE_SOLID);
    PlotIndexSetInteger(2, PLOT_LINE_STYLE, STYLE_SOLID);

    // Set line widths
    PlotIndexSetInteger(1, PLOT_LINE_WIDTH, 1);
    PlotIndexSetInteger(2, PLOT_LINE_WIDTH, 1);

    // Create and initialize the Market Regime Detector
    Detector = new CMarketRegimeDetector(LookbackPeriod, SmoothingPeriod);
    if(Detector == NULL)
    {
        Print("Failed to create Market Regime Detector");
        return INIT_FAILED;
    }

    // Configure the detector
    Detector.SetTrendThreshold(TrendThreshold);
    Detector.SetVolatilityThreshold(VolatilityThreshold);
    Detector.Initialize();

    // Set indicator name
    IndicatorSetString(INDICATOR_SHORTNAME, "Market Regime Detector");

    return INIT_SUCCEEDED;
}
This function performs several important tasks:
- It binds the indicator buffers to the corresponding arrays
- It sets the visual properties of the indicator (labels, styles, colors)
- It creates and configures the Market Regime Detector with the user-specified parameters
The use of SetIndexBuffer() and various PlotIndexSetXXX() functions is standard practice in MQL5 indicator development. These functions configure how the indicator will be displayed on the chart.
Indicator Calculation
The OnCalculate() function processes price data and updates the indicator buffers:
int OnCalculate(const int rates_total,
                const int prev_calculated,
                const datetime &time[],
                const double &open[],
                const double &high[],
                const double &low[],
                const double &close[],
                const long &tick_volume[],
                const long &volume[],
                const int &spread[])
{
    // Check if there's enough data
    if(rates_total < LookbackPeriod)
        return 0;

    // Process data with the detector
    if(!Detector.ProcessData(close, rates_total))
    {
        Print("Failed to process data with Market Regime Detector");
        return 0;
    }

    // Get the regime buffer
    Detector.GetRegimeBuffer(RegimeBuffer);

    // Get the trend strength buffer
    Detector.GetTrendStrengthBuffer(TrendStrengthBuffer);

    // Get the volatility buffer
    Detector.GetVolatilityBuffer(VolatilityBuffer);

    // Display current regime in the chart corner
    string regimeText = "Current Market Regime: " + Detector.GetRegimeDescription();
    string trendText = "Trend Strength: " + DoubleToString(Detector.GetTrendStrength(), 4);
    string volatilityText = "Volatility: " + DoubleToString(Detector.GetVolatility(), 4);

    Comment(regimeText + "\n" + trendText + "\n" + volatilityText);

    // Return the number of calculated bars
    return rates_total;
}
This function:
- Checks if there's enough data for calculation
- Processes the price data with the Market Regime Detector
- Retrieves the regime, trend strength, and volatility buffers
- Displays the current regime information in the chart corner
- Returns the number of calculated bars
The OnCalculate() function is called by the platform whenever new price data is available or when the chart is scrolled. It's responsible for updating the indicator buffers, which are then displayed on the chart.
Indicator Cleanup
The OnDeinit() function ensures proper cleanup when the indicator is removed:
void OnDeinit(const int reason)
{
    // Clean up
    if(Detector != NULL)
    {
        delete Detector;
        Detector = NULL;
    }

    // Clear the comment
    Comment("");
}
This function deletes the Market Regime Detector object to prevent memory leaks and clears any comments from the chart. Proper cleanup is essential in MQL5 programming to ensure that resources are released when they're no longer needed.
Interpreting the Indicator
When using the Market Regime Indicator, traders should pay attention to the following:- Regime Line: This line represents the current market regime. The numerical values correspond to different regimes:
- 0: Trending Up
- 1: Trending Down
- 2: Ranging
- 3: Volatile
- 4: Undefined
- Trend Strength Line: This blue line shows the strength of the trend. Higher positive values indicate stronger uptrends, while lower negative values indicate stronger downtrends. Values near zero suggest weak or no trend.
- Volatility Line: This red line shows the current volatility level. Spikes in this line often precede regime changes and can signal potential trading opportunities or risks.
- Chart Comment: The indicator displays the current regime, trend strength, and volatility values in the upper-left corner of the chart for easy reference.
By monitoring these elements, traders can quickly identify the current market regime and adjust their strategies accordingly. For example, trend-following strategies should be employed during trending regimes, while mean-reversion strategies are more appropriate during ranging regimes. During volatile regimes, traders might consider reducing position sizes or staying out of the market altogether.
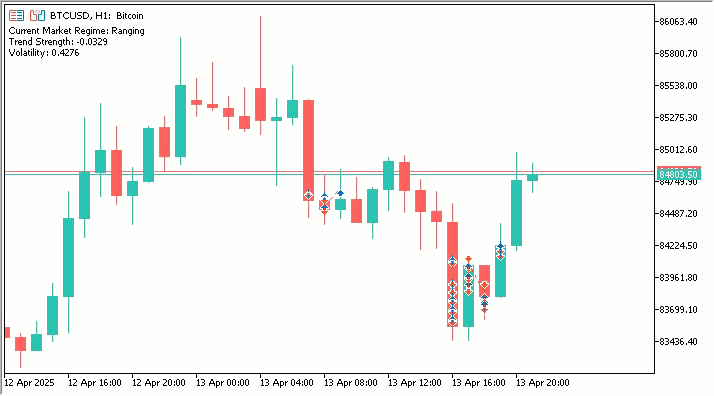
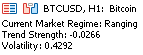
This is where we can clearly see that the currect market is Ranging as we can clearly see on the chart as well.
Conclusion
Throughout this article, we've embarked on a journey to solve one of the most challenging problems in algorithmic trading: adapting to changing market conditions. We began with the recognition that markets don't behave uniformly over time, but rather transition between distinct behavioral states or "regimes." This insight led us to develop a comprehensive Market Regime Detection System that can identify these transitions and in the next part we will see how to adapt trading strategies according to out detections of the regimes.
The Journey from Problem to Solution
When we started, we identified a critical gap in most trading systems: the inability to objectively classify market conditions and adapt to them. Traditional indicators and strategies are typically optimized for specific market conditions, leading to inconsistent performance as markets evolve. This is the problem that traders face daily—strategies that work brilliantly in one market environment can fail spectacularly in another.
Our solution to this problem was to build a robust Market Regime Detection System from the ground up. We began with a solid statistical foundation, implementing key measures like autocorrelation and volatility that can objectively classify market behavior. We then developed a comprehensive Market Regime Detector class that uses these statistical measures to identify trending, ranging, and volatile market conditions.
Finally, To make this system practical and accessible, we created a custom indicator that visualizes regime changes directly on the price chart, providing traders with immediate visual feedback about current market conditions. We then demonstrated how to build an adaptive Expert Advisor that automatically selects and applies different trading strategies based on the detected regime.
Now, In the next part of the article, we will explore practical considerations for implementing and optimizing the system, including parameter optimization, regime transition handling, and integration with existing trading systems. These practical insights will help you implement the Market Regime Detection System effectively in your own trading automatically. Meanwhile play around with the manual approach of indicator for now.
File Overview
Here's a summary of all the files created in this article: | File Name | Description |
|---|---|
| MarketRegimeEnum.mqh | Defines the market regime enumeration types used throughout the system |
| CStatistics.mqh | Statistical calculations class for market regime detection |
| MarketRegimeDetector.mqh | Core market regime detection implementation |
| MarketRegimeIndicator.mq5 | Custom indicator for visualizing regimes on charts |
- Free trading apps
- Over 8,000 signals for copying
- Economic news for exploring financial markets
You agree to website policy and terms of use