Neue technische Indikatoren für den MetaTrader 4
Hello fellow trader, I have built this indicator by combining trend and entry mechanisms i have used for years. This is one of my high probability strategies. All calculations are done based on pure price action-based market structure.
Multiple confluences are used to validate and filter entries. All calculations are done behind the scenes, and you are given only buy sell signals. Accuracy becomes higher and higher as you trade higher timeframes, also based on my experience with the technique,
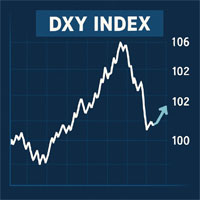
DXY Index indicator to help predict USD effect to your trade. DXY Index will help to see the power of USD.
For example if you trade XAUUSD and the DXY Index weaker, it could be the XAU will be bullish.
The same if DXY Index getting stronger, it could be that XAU will be bearish. I hope this indicator will help many trader to have better position to trade. Use this indicator wisely.

Der SMC Sessions Indicator ist ein Präzisionstool für Smart Money-Trader , die auf ICT-Konzepte, Liquiditätssuche und sitzungsbasierte Strategien vertrauen. Er bildet kritische sitzungsbasierte Handelszonen nahtlos ab und verwendet dabei die bewährtesten und beliebtesten Konzepte, die von Tradern auf institutioneller Ebene verwendet werden. Dieser All-in-One-Sitzungsindikator überlagert Ihr Diagramm mit den effektivsten und wahrscheinlichsten Bereichsstrategien, einschließlich:
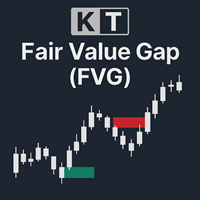
KT Fair Value Gap (FVG) identifiziert und markiert Zonen temporärer Preisungleichgewichte im Markt. Diese Gaps dienen häufig als potenzielle Bereiche für eine Preisfortsetzung – oder in einigen Fällen auch für Umkehrbewegungen (bekannt als inverse FVGs). Bullisches FVG: In grünen Kästchen dargestellt, wirken diese Gaps als Unterstützungszonen, in denen der Preis seine Aufwärtsbewegung fortsetzen kann. Nach dem Schließen des Gaps können sie auch als potenzielle Wendepunkte dienen. Bärisches FVG:

Der London Session Breakout Strategy Indicator richtet sich an Trader, die ICT (Inner Circle Trader) und Smart Money Concepts (SMC) verfolgen. Er konzentriert sich auf sitzungsbasierte Liquiditätssuche, Killzones und das Verhalten von Market Makern während der Londoner Sitzung. Dieses Tool erfasst die höchsten und niedrigsten Kursniveaus zwischen 00:00 und 07:00 Uhr GMT , die allgemein als London Killzone oder Market Maker Range bezeichnet werden. Es hilft Tr
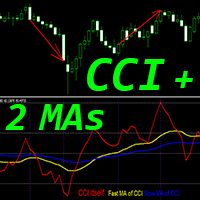
Crypto_Forex-Indikator „CCI und 2 gleitende Durchschnitte“ für MT4, kein Repaint.
– Commodity_Channel_Index (CCI) eignet sich hervorragend für Momentum-Trading in Trendrichtung. – Der Indikator „CCI und 2 gleitende Durchschnitte“ ermöglicht die Anzeige der schnellen und langsamen gleitenden Durchschnitte des CCI-Indikators. – Aufwärtstrend: Der schnelle gleitende Durchschnitt liegt über dem langsamen; Abwärtstrend: Der schnelle gleitende Durchschnitt liegt unter dem langsamen. – Der CCI ist ei
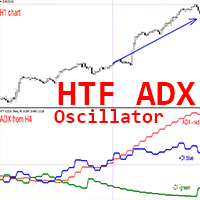
Crypto_Forex Indikator HTF ADX für MT4.
– Verbessern Sie Ihre Handelsmethoden mit dem professionellen HTF ADX Indikator für MT4. HTF steht für „Higher Time Frame“. – Der ADX (rote Linie) misst die Trendstärke. Liegt der ADX-Wert über 20 und weist eine aufwärts gerichtete Form auf, ist der Trend stark. – Liegt der +DMI (blaue Linie) über dem -DMI (grüne Linie), steigt der Kurs, und der ADX misst die Stärke des Aufwärtstrends. – Liegt der -DMI (grüne Linie) über dem +DMI (blaue Linie), fällt der

Crypto_Forex Indikator für MT4 Heiken Ashi Histo Filter – ein großartiges und effizientes Trading-Hilfstool! Kein Repainting!
– Erweiterte neue Berechnungsmethode – 10 Optionen für den Parameter „Preis für Berechnung“. – Hervorragend kombinierbar mit Price-Action-Mustern: – Grünes Histogramm – Suche nach bullischen Mustern. – Magentafarbenes Histogramm – Suche nach bärischen Mustern. – Mit diesem Indikator lassen sich selbst Standardstrategien vielfältig optimieren. – Der Indikator verfügt übe
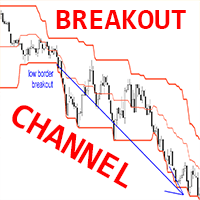
Crypto_Forex Indikator BREAKOUT CHANNEL für MT4, kein Repaint.
- Dieser Indikator kann als komplettes Handelssystem basierend auf Hoch-/Tief-Ausbrüchen verwendet werden. - Er verfügt über nur einen Parameter – HISTORY DEPTH. Dieser gibt die Anzahl der vom Indikator berücksichtigten Kerzen an. - Empfohlene Werte für den Parameter HISTORY DEPTH: Zeitrahmen D1 – 20 (ein Monat), H4 – 30 (eine Woche), H1 – 24 (ein Tag). - BREAKOUT CHANNEL besteht aus drei Linien: Obergrenze – Maximalpreis der letzt
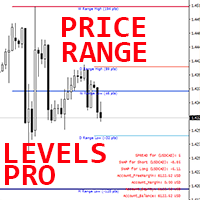
Forex-Indikator „Price Range Levels Pro“ für MT4.
- Der Indikator „Price Range Levels Pro“ ist ein äußerst nützliches professionelles Trading-Hilfstool. - Er zeigt Ihnen täglich, wöchentlich und monatlich die wahrscheinlichsten Kursniveaus (Preisspannen). - Die tägliche Kursspanne ist nützlich für Intraday-Trader. - Die wöchentliche und monatliche Kursspanne sind nützlich für Swing- und langfristige Trader. - Der Indikator eignet sich hervorragend zur Planung von Take-Profit-Zielen oder zur Fe

Crypto_Forex Indikator "RSI SPEED" für MT4 – Hervorragendes Prognosetool, kein Repainting erforderlich.
– Die Berechnung dieses Indikators basiert auf physikalischen Gleichungen. RSI SPEED ist die erste Ableitung des RSI. – RSI SPEED eignet sich gut zum Scalping von Einstiegen in Richtung des Haupttrends. – Verwenden Sie ihn in Kombination mit einem geeigneten Trendindikator, z. B. HTF MA (siehe Abbildungen). – Der RSI SPEED zeigt an, wie schnell der RSI seine Richtung ändert – er ist sehr sen
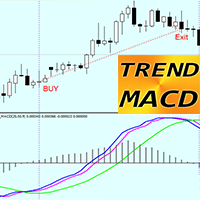
TREND MACD Indikator für MT4 – ein hervorragendes und effizientes Handelstool!
– Dieser Indikator eignet sich für Trendtrader, die große Kursbewegungen erfassen möchten. – Der TREND MACD besteht aus drei Linien: Die grüne Linie zeigt die Haupttrendrichtung an, die blauen und magentafarbenen Linien stehen für Ein- und Ausstieg. – Der Indikator ermöglicht Gewinnmaximierung, um profitable Trades nicht zu früh zu beenden. – Der Indikator verfügt über integrierte Warnmeldungen für Mobilgeräte und P
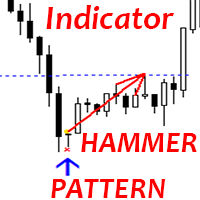
Crypto_Forex Indikator „Hammermuster“ für MT4.
– Der Indikator „Hammermuster“ ist ein sehr leistungsstarker Indikator für Price Action Trading: Keine Neuzeichnung, keine Verzögerung. – Der Indikator erkennt bullische Hammermuster im Chart: Blaues Pfeilsignal im Chart (siehe Bilder). – Mit Benachrichtigungen für PC, Handy und E-Mail. – Der Indikator „Hammermuster“ lässt sich hervorragend mit Unterstützungs-/Widerstandsniveaus kombinieren.
// Hervorragende Handelsroboter und Indikatoren finden
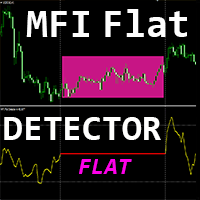
Der Crypto_Forex-Indikator „MFI FLAT Detector“ ist ein effizientes Hilfsmittel für den Handel! Kein Repainting erforderlich. Ich biete Ihnen an, Ihre Handelsmethoden mit diesem hervorragenden Indikator für MT4 zu verbessern.
– Der Indikator zeigt Kursflauten im Chart an. Er verfügt über den Parameter „Flat Sensitivity“, der für die Erkennung von Flats zuständig ist. – Der „MFI FLAT Detector“ ist sehr nützlich für die Divergenzerkennung und lässt sich hervorragend mit Price Action kombinieren.

Der New York Range Indicator ist ein sitzungsbasiertes Analysetool für Händler , die ICT-Konzepte (Inner Circle Trader) , Smart Money-Trading und institutionelle Preisaktionsmethoden anwenden. Dieser Indikator wurde speziell für die New Yorker Sitzung entwickelt und erfasst die Preisspanne zwischen 12:00 und 14:00 Uhr GMT , einem kritischen Zeitraum, der sich mit dem London Close und der New York Open überschneidet. Er identifiziert Sitzungshochs und -tiefs , er
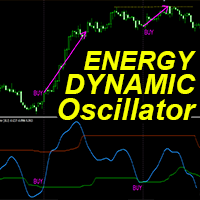
„Dynamic Energy Oscillator“ – ein fortschrittlicher, benutzerdefinierter Crypto_Forex-Indikator – ein effizientes Handelstool für MT4!
– Neue Oszillatoren-Generation – siehe Bilder zur Anwendung. – Der Dynamic Energy Oscillator verfügt über adaptive Überverkauft-/Überkauft-Zonen. – Dieser technische Momentum-Indikator ist besonders nützlich in Trendmärkten. – Der Oszillator dient als Hilfsmittel zur Ermittlung exakter Einstiegspunkte aus Überverkauft-/Überkauft-Bereichen. – Überverkauft: unter
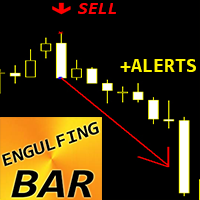
Crypto_Forex Indikator „ENGULFING Bar Pattern“ für MT4.
- Der Indikator „ENGULFING Bar“ ist ein sehr leistungsstarker Indikator für Price Action Trading: Keine Neuzeichnung, keine Verzögerung. - Der Indikator erkennt Engulfing Bar Muster im Chart: – Bullish Engulfing Bar – Blauer Pfeil im Chart (siehe Bilder). – Bearish Engulfing Bar – Roter Pfeil im Chart (siehe Bilder). – Mit Benachrichtigungen für PC, Handy und E-Mail. – Der Indikator „ENGULFING Bar Pattern“ lässt sich hervorragend mit Unte

Dieser Indikator wurde für aggressives Scalping und schnelle Einstiege im Binäroptionshandel entwickelt und erzeugt Signale bei jeder Kerze , damit du jederzeit genau weißt, was im Markt passiert.
Sieh dir den Live-Handel an: https://youtu.be/QR5F_9uIb6k Tritt dem Happy Scalping-Kanal bei: https://www.mql5.com/en/channels/forexnewadvisor
Kein Repainting : Das Signal der aktuellen Kerze wird in ECHTZEIT erzeugt. Es kann sich ändern, solange die Kerze noch offen ist, je nachdem, ob de
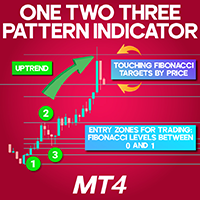
1-2-3 Pattern Indicator for MetaTrader 4
The 1-2-3 Pattern Indicator for MetaTrader 4 is a sophisticated technical tool designed to identify potential market reversals. It highlights three significant turning points, connecting them with a ZigZag pattern to visually map the price trajectory. Once the formation is complete, the indicator automatically generates Fibonacci retracement levels between the first two points to assist with trade planning. «Indicator Installation & User Guide»
MT4 Indi
FREE

Core Drift Index: Your Reliable Guide in the World of Trading Core Drift Index is an innovative trend indicator designed for precise detection of market directions and reversal points . This powerful tool enables traders to optimize their investments , minimize risk, and maximize profit. Key Features and Benefits Intuitive Trend Detection Core Drift Index clearly shows trend direction, helping traders make timely entry and exit decisions. High Probability of Success With its high accuracy
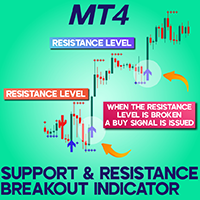
Support Resistance Breakout Indicator (SRBAI) download for MetaTrader 4
The Support Resistance Breakout Indicator (SRBAI) available for MetaTrader 4 (MT4) is designed to highlight significant pivot zones by mapping support and resistance levels on the price chart. Blue dashed lines represent support zones, while red dashed lines indicate resistance levels. Once the price breaks through a support area, the indicator generates a sell alert with a red downward-pointing arrow. Conversely, a resista
FREE

Average Daily Range (ADR) Indicator for MetaTrader 4 The Average Daily Range (ADR) Indicator for MetaTrader 4 is a vital technical analysis tool used to assess the typical price movement range an asset experience during a trading day.
By analyzing the average distance between daily highs and lows over a specified number of days, this indicator defines the ADR High (upper boundary) and ADR Low (lower boundary), helping traders identify possible support and resistance zones. «Indicator Installatio
FREE
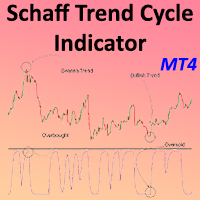
Schaff Trend Cycle Indicator for MetaTrader4 The Schaff Trend Cycle Indicator for MetaTrader4 merges the core functionalities of two widely used indicators—MACD (Moving Average Convergence Divergence) and the Stochastic Oscillator. This tool is engineered to identify trend reversals and momentum extremes with enhanced sensitivity. Readings below 25 often signal an oversold market, while values above 75 highlight overbought conditions. This makes the STC highly reliable for early trend recognitio
FREE
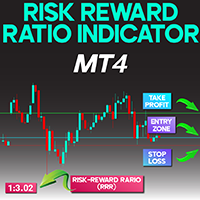
Risk Reward Indicator for MetaTrader 4
The Risk Reward Indicator for MetaTrader 4 is developed to assist traders in determining the potential risk and return of a trading position. It calculates the Risk-to-Reward Ratio (RRR) using three key levels: Entry Price (EP), Stop Loss (SL), and Take Profit (TP).
This tool graphically presents the RRR at the top-left corner of the chart and highlights the trade levels with three distinct horizontal lines:
• Green Line – Indicates the Take Profit level
•
FREE
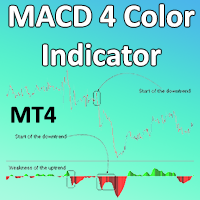
MACD 4 Color Indicator for MetaTrader 4
The MACD 4 Color Indicator for MetaTrader 4 (MACD 4C) is a refined upgrade of the traditional MACD, designed to not only indicate trend direction but also visualize the strength of the trend using four distinct color codes. These color variations are derived from the gradient of the moving average lines. It is particularly effective for identifying when a trend begins or starts to fade. The tool also incorporates divergence and convergence principles, mak
FREE
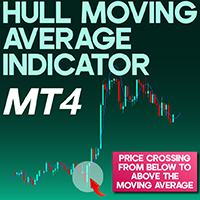
Hull Moving Average Indicator MetaTrader 4
The Hull Moving Average (Hull MA) indicator, developed by Alan Hull, is designed to minimize delay in standard moving averages and enhance responsiveness in trend evaluation. Available on the MetaTrader 4 platform, this indicator allows traders to spot short-term directional moves with greater clarity. It serves as an effective tool for identifying optimized trade entry and exit points. «Indicator Installation & User Guide»
MT4 Indicator Installation
FREE
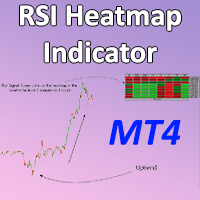
RSI Heatmap Indicator for MetaTrader4 The RSI Heatmap Indicator is a powerful technical tool in MetaTrader 4 that allows traders to assess the relative strength conditions of different currency pairs via a color-coded heatmap. By merging the Relative Strength Index (RSI) with a visual heatmap approach, this indicator simplifies market analysis by displaying strength and directional bias of multiple instruments at a glance. This indicator produces a heatmap based on calculated RSI levels across v
FREE
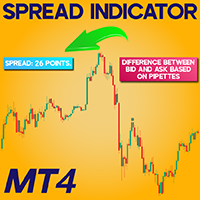
Spread Indicator download For Meta Trader 4
The Spread Indicator on MetaTrader 4 (MT4) serves to reveal the real-time gap between the Bid and Ask values. This variance, calculated in points (pipettes), appears clearly at the upper-left section of the chart window. «Indicator Installation & User Guide»
MT4 Indicator Installation | Spread Indicator Download for MT5 | ALL Products By TradingFinderLab | Best MT4 Indicator: Refined Order Block Indicator for MT4 | Best MT4 Utility: Trade
FREE
Trend detection is one of the basic challenges of every trader. Finding a way to tell when to enter a trade is very important, timing is a game changer, not too early and not too late. Sometimes, due to not knowing the market conditions, the trader closes his positions with a small profit or allows the losses to grow, these are the mistakes that novice traders make. Indicator Trend Whipper is a complete trading strategy and can improve the trader's trading process. The trend detection algorithm

Indicator defines the buy and sell arrows with high performance and consistent results . Automatic analysis of market opportunities ; Identifies a direction of a trend; Suitable for trend trading or following the trend;
This is FREE demo version of the indicator and works only on "EURUSD M5".
Forex Trend Commander full version: All details about the indicator here : Works in all symbols + free Multi Currency Scanner + free SPECIAL BONUS .
FREE
Warp Range Sensor: The Color of Your Trend Warp Range Sensor is a trend direction indicator that visually displays the current market condition by coloring bars red and blue based on trend direction. What Does Warp Range Sensor Do? Identifies the Current Trend Direction Blue bars indicate an uptrend Red bars signal a downtrend Universal Application
Compatible with all currency pairs and timeframes , from short-term scalping to long-term trading. Powered by Market Context & Historical Data
W

Rocket pro is a powerful indicator for MetaTrader 4, designed to identify the most relevant trends in the financial market. If you are looking for a tool that accurately predicts movements, Rocket pro is your ally.
Live signal: https://www.mql5.com/en/signals/2303662 How it works: This indicator combines three different methods - volume analysis, candlestick closing and symmetrical trend - to detect and signal buying and selling opportunities. Rocket pro is like a "rocket" when it detects a bu

Divergence Divergence refers to when the price of a currency pair moves in one direction while the trend indicator is moving in the opposite direction. With divergence, there can be positive and negative signals. Divergences in Forex trading are quite common signals of technical analysis. These are basic early Forex signals indicating the trend reversal and filter false signals. Application of this indicator It is usually not easy to detect divergences by the trader and it may be time-consuming
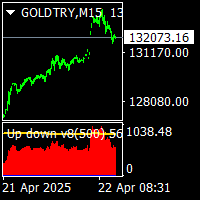
Up down v8 indicator is no repaint counter trend indicator . it try to find market up down points. it works all timeframes and all pairs. suitable for beginner and experienced trader. there is wave and c values to set defaults. minimum processed value cnt can be equal to wave value. traders can change them suitable up down points on different time frames. indicator use moving averages histograms and volatilty trigger. when red histogram is over volatility level that is tops. . when blue histogr
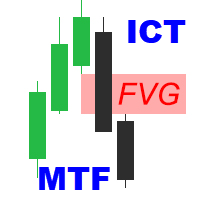
ICT Fair Value Gaps MTF Indicator Unlock the power of Fair Value Gaps (FVGs) across multiple timeframes using the ICT Fair Value Gaps Multi - Timeframe Indicator —a precision tool built for traders who follow the Smart Money Concept (SMC) . Key Features : Multi-Timeframe FVG Detection : Automatically identifies Fair Value Gaps from higher timeframes (M15, H1, H4, etc.) and plots them on your active chart for immediate insight. Break of Structure (BOS) & Change of Character (CHoCH

Convenient Dashboard for Moving Average Crossover Trading Strategy . On the panel, numbers display how many candles ago a signal occurred. The number 0 means the signal is on the current candle (it may disappear if the crossover does not hold). The number 1 means the signal was on the previous candle (arrows remain, as moving averages have confirmed the crossover). Moving averages can optionally be added, but the indicator works without them. Advantages of the indicator : Automa

Price Change Indicator Introduction The Price Change Indicator is a powerful tool designed to help traders identify significant price movements over a specified period. By calculating and visualizing percentage changes between current and historical prices, it allows traders to quickly spot potential trading opportunities when markets show unusual volatility or momentum. Features Real-time monitoring of price changes Visual histogram display when changes exceed threshold Text display showing cur
FREE
As the suggested, with this indicator you are able to switch from one symbol or timeframe to another in the same single chart. So forget about opening tons of chart on your screen! It's not designed for ICT or SMC trader, but if you are that kind of trader you still can use it. Imagine you have a strategy containing various indicators and settings, on a single chart you can screen the entry opportunity then move to the next symbol or timeframe.
FREE
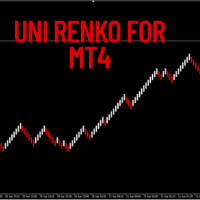
This versatile tool lets you create various Renko-style charts, including Median Renko, Mean Renko, and Traditional Renko with wicks . It offers a wide range of chart options to suit the needs of day traders, scalpers, and long-term investors.
Indicator Settings Starting Price. Box Size (in pips). Shift Percent. Timeframe Name. Show Wicks (On or Off). Amount of Bars.
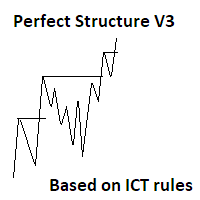
Here is the V3 of perfect structure. Whats new? (Please check added screenshots for better understanding.) 1. Coded based on ICT rules. 2. No more trend confusions...-- Added labels to show current trend 3. No more timeframe juggling and missing out important points, -- Now You can add indicator multiple times to mark multi timeframe structure on the same chart window( 1D structure on 4H or may be 4H structure on 15 min timeframe and more.....) 4. No more waiting in large range as sometimes mark
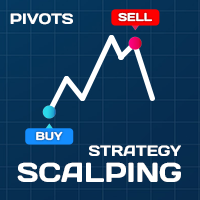
Scalping Strategy BUY SELL
Having a strategy in the market is one of the main conditions for trading. The presence of various and complicated indicators and tools sometimes makes trading difficult, and the user gets confused after trying various methods and gets stuck in a loss cycle, the result of which is usually clear. This indicator is a simple strategy based on the detection of pivots and short-term trends, which helps you to easily trade in trends. Sometimes a simple but efficient st

MACD Indicator The Moving Average Convergence and Divergence (MACD) is a trend following momentum indicator which shows the relationship between two moving averages that we chose and configure them on the indicator. The MACD is calculated by subtracting the 26-period exponential moving average and the 12 period D.A.M. These are the default parameters when you put the MACD indicator on the charts, and the period is usually 9 which means the last 9 candles. DT-Oscillator This is Robert C. Miner's
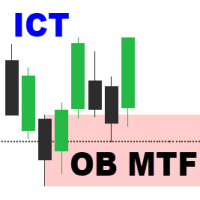
Order Block Multi Timeframe The Order Block Multi Timeframe is a powerful tool for Smart Money Concept (SMC) traders, combining high-accuracy Order Block detection with real-time Break of Structure (BOS) and Change of Character (CHoCH) analysis across multiple timeframes. Smart Money Insight, Multi-Timeframe Precision This indicator automatically identifies institutional Order Blocks —key price zones where large players have entered the market—and plots them directly on your ch

CHoCH & EQH/EQL: Market Structure and Liquidity Zones Indicator Overview: This versatile indicator is designed to help traders identify potential shifts in market structure and pinpoint key liquidity zones directly on their MetaTrader 5 charts. It automatically detects and visualizes two crucial price action concepts: Change of Character (CHoCH) for potential reversals, and Equal Highs/Lows (EQH/EQL) for significant support/resistance levels. Key Features: Change of Character (CHoCH) Detection:

The Zeta Breakout Indicator MT4 is a powerful trading breakout strategy custom indicator. It can help traders determine the level of breakout (support and resistance levels) simple, easily and accurately. Zeta Breakout Indicator MT4 is a custom indicator that created by MQL4 programming language that based on the results of our breakout trading strategy research. It uses a proven strategy with excellent result, good win rate, good risk to reward ratio and few false break out. You can proof how

H4 scalper
The H4 scalper indicator is built specifically for the H4 timeframe and works on all currency pairs.
The H4 scalper indicator is very good for scalping.
BUY and SELL signals are given by the white and yellow circles, respectively.
Take Profit can start from a minimum of 5, 10 pips.
For this indicator to work, you need to download two indicators, Trend envelopes v2 and DSS of momentum + arrows + alerts _ mtf nmc, which you can find in the first comment.
These two indicators are

Hello fellow trader, I have built this indicator by combining trend and entry mechanisms i have used for years. This is one of my high probability strategies. All calculations are done based on pure price action-based market structure.
Multiple confluences are used to validate and filter entries. All calculations are done behind the scenes, and you are given only buy sell signals. Accuracy becomes higher and higher as you trade higher timeframes, also based on my experience with the technique,

The Neural Adaptive MACD is a customized MACD indicator for MT4 that visually represents momentum strength using four color-coded histogram bars: strong bullish, bullish, strong bearish, and bearish.
It features neural adaptive signal smoothing and integrates optional real-time alerts, notifying traders of new momentum shifts along with the symbol and timeframe.
This tool enhances decision-making by highlighting trend strength and change dynamics.
Can be used any forex, crypto....
Any timefr

Simple. Informative. Instantly Visible on Your Chart. Alwinson Active Trades Info (MT4 Version) is a lightweight custom indicator that displays a real-time summary of your currently open trades —right on your chart. No more switching tabs just to see what pairs are active and how much lot size is in play.
Alwinson Active Trades Info is also available for the MetaTrader 5 (MT5) version .
Key Features: Displays a list of all symbols with open positions in your trading account. Shows th

Arrow Indicator (Buy/Sell Alerts) – Simple Yet Powerful Tool! Product Version: 1.01 Indicator Type: Trend Reversal Signals Timeframes Supported: All (Recommended: H1, H4, D1) Key Features: Buy Signal: Green upward arrow () appears below the candle Sell Signal : Red downward arrow () appears above the candle Accurate Trend Reversal Detection – Based on tried and tested SMA strategy. ️ Clean Chart View – Minimalist, non-i
FREE

Z Score Pair Trade Indicator for MT4 is a powerful statistical tool designed to help traders identify mean-reversion opportunities and overbought/oversold market conditions with precision. Based on standard deviation and mean analysis, this indicator calculates the Z-score of a selected spread, price series, or custom input to determine how far the current value deviates from its historical average.
Unlock powerful market insights with the Z Score Pair Trade Indicator — a must-have tool for tr

CDS SR Fractal Level: Enhance Your Trading Accuracy with Automatic Fractal-Based Support and Resistance Levels The CDS SR Fractal Level indicator is an advanced trading tool designed by CDS to automatically identify and visualize key Support and Resistance (SR) levels. This indicator utilizes the concept of fractals to present relevant SR levels for your trading decisions. Key Features: Automatic Fractal Level Identification: The indicator dynamically marks fractal levels as they form on the pri

The Great Oracle – Your Guide to Consistent Trend Trading Success
The Great Oracle is a powerful trend-following indicator designed for traders who seek precision in their entries and exits. Whether you’re navigating trending markets or spotting opportunities in ranging conditions, The Great Oracle provides you with accurate signals and a second chance to join strong market trends. It’s the ultimate tool for traders who want to maximize profits while keeping risks manageable.
Key Features:
•
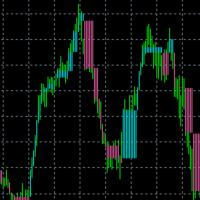
When there is no position, when changing the color, you can consider opening an order. With the fluctuation of the market, when the current color changes again, you need to close the position and leave. Suitable for different cycles, the trading rules are simple and require friends to explore on their own.
I hope friends who use this indicator can make a lot of money, rolling bigger and bigger like a snowball. thank you!

Candle Pattern Finder
Candle Pattern Finder is a powerful MT4 indicator designed to help traders easily detect key candlestick patterns in real-time. Whether you're trading trends, reversals, or consolidations, this tool highlights important price action signals directly on the chart — helping you make faster and more confident trading decisions. Detects popular candlestick patterns: Bullish/Bearish Engulfing Hammer & Inverted Hammer Shooting Star & Hanging Man Three White Soldiers Three Black
FREE

GoldStrike Momentum Trend Indicator - The Ultimate Forex Trading Tool Description: Introducing the GoldStrike Momentum Trend Indicator , a powerful and intuitive tool designed for traders seeking precision in their Forex strategies. Using a combination of momentum analysis and the RSI (Relative Strength Index) , this indicator provides buy and sell signals that help you identify optimal entry and exit points, improving your trading decisions. Perfect For: Day traders who need quick, precise sign
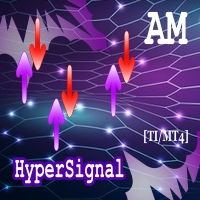
The presented indicator is an original development. The indicator gives signals to open/close a position. The indicator sensitivity can be adjusted in a literally infinite range, which allows it to be used for trading in any market. The indicator signals vary in strength depending on their consistency with the trend over three different time periods. The above indicator feature allows you to estimate the indicator signal potential in advance. Namely: If the signal is strong (coincides with the
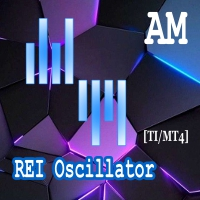
The presented product is the author's implementation of the REI (Range Expansion Index) indicator developed by Thomas DeMark. REI Oscillator AM is an indicator that measures the rate of price change and signals overbought/oversold conditions if the price shows weakness or strength. The indicator value changes within the range from -100 to +100. Thomas DeMark suggests using the default period of 8 and the following algorithm for using the indicator: When the price rises above level 60 and then fa
FREE
One of the standard ways to determine the direction of price movement at a specific point in time is to calculate the linear regression for the values of such a price for a certain period of time. This indicator displays points on the price chart, built on the basis of the linear regression values of the selected price for the selected period of time.
The indicator also displays signals at moments of change in the direction of the calculated values of linear regression. The indicator is
FREE
The presented indicator is an original development. The indicator places two types of signals on the price chart: Signals to open a position; Signals to close a position. The indicator signals appear after the bar formation is complete and are not redrawn. The signals require confirmation, namely - the price must overcome the maximum (for buying) or minimum (for selling) of the bar on which the signal was placed. The indicator can send notifications about its signals to a mobile terminal and e-
FREE
The presented indicator is the author's implementation in the oscillator format of the classic Aroon indicator. The Aroon indicator was developed in 1995 by the Indian trader Tushar Chande. Chand's origin played a role in choosing an unusual name for the oscillator. "Aroon" is translated from Sanskrit as "Light of the morning dawn". The formula for calculating the classic Aroon indicator: Aroon-Up = ((specified number of periods) – (number of periods since the maximum was formed)) / (specified n
FREE

The presented indicator is the author's implementation of the classic Aroon indicator. The Aroon indicator was developed in 1995 by the Indian trader Tushar Chand. Chand's origin played a role in choosing an unusual name for the indicator. "Aroon" is translated from Sanskrit as "Light of the morning dawn". The formula for calculating the classic Aroon indicator: Aroon-Up = ((specified number of periods) - (number of periods since the formation of the maximum)) / (specified number of periods) * 1
FREE

The presented indicator allows you to visualize the current trend. The indicator identifies the trend using the following definition as an algorithm: A trend is a situation when each subsequent maximum price rise is higher/lower than the previous one, and similarly each subsequent maximum price fall is higher/lower than the previous one; The beginning of a new trend is considered to be when the current maximum/minimum overcomes all maximums/minimums of a specified number of previous bars. The i
FREE
The presented indicator is the author's implementation of the DMI indicator. DMI (Directional movement Index) is a directional movement index. The concept of the indicator was developed by Welles Wilder. This is a technical indicator, it is used to identify the trend direction, moments of the market exiting consolidation and to confirm potential reversal points. It is an oscillator consisting of two curves. The constituent components of the Directional Movement Index: +DI (Positive Directional
FREE

NOTE: CYCLEMAESTRO is distributed only on this website, there are no other distributors. Demo version is for reference only and is not supported. Full versione is perfectly functional and it is supported CYCLEMAESTRO , the first and only indicator of Cyclic Analysis, useful for giving signals of TRADING, BUY, SELL, STOP LOSS, ADDING. Created on the logic of Serghei Istrati and programmed by Stefano Frisetti ; CYCLEMAESTRO is not an indicator like the others, the challenge was to interpret only t
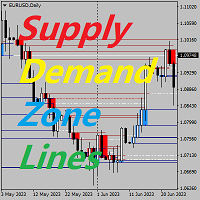
Wichtige Preisindikatoren für die Angebots- und Nachfragezone Hintergrund Das System sucht automatisch nach Angebots- und Nachfragebereichen in der K-Linie und zeichnet Schlüsselpreislinien in Echtzeit. Händler können auf Grundlage der Preishandelslinien handeln. Hauptmerkmale Das System sucht automatisch nach den Angebots- und Nachfragebereichen in der K-Linie. Das System zeichnet außerdem wichtige Preislinien in Echtzeit und Händler können auf Grundlage dieser Preishandelslinien handeln. Dahe

Der Multi Timeframe Candles Indikator ist ein leistungsstarkes Visualisierungstool, das Händlern hilft, ihre Analyse niedrigerer Zeitrahmen mit der Struktur höherer Zeitrahmen abzugleichen. Durch die Darstellung von Kerzen aus einem ausgewählten höheren Zeitrahmen (H1, H4, D1 usw.) direkt in Ihrem aktuellen Chart bietet Ihnen dieser Indikator eine klarere Perspektive auf die gesamte Marktentwicklung, ohne dass Sie zwischen Charts wechseln müssen.
Wer braucht diesen Indikator? Dieses Tool i
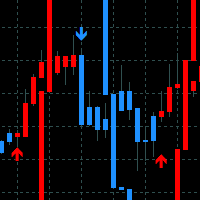
Reversal Bands - Indikator für die Volatilitätsanalyse und die Anwendung der Ergebnisse im Handel. Liefert Signale zur Preisrichtung entlang des Trends und in den frühen Phasen einer Umkehr.
Indikatorfunktionen
Der Indikator basiert auf Geschwindigkeitslinien, die nach den Prinzipien der Beschleunigung und Verzögerung der Volatilität unter Verwendung des Glättungsgrades erstellt wurden. Die treibende Kraft der Linie ist die Volatilität. Je größer diese ist, desto stärker weichen die Linien vom
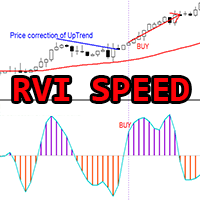
Crypto_Forex Indikator "RVI Speed" für MT4, kein Repaint.
– Die Berechnung dieses Indikators basiert auf physikalischen Gleichungen. RVI Speed ist die erste Ableitung des RVI selbst. – Relative_Vigor_Index (RVI) selbst ist ein technischer Momentum-Indikator, der in Trendmärkten sehr nützlich ist. – RVI Speed eignet sich gut für Momentum-Einstiege nach Kurskorrekturen in Richtung des Haupttrends. – Verwenden Sie ihn in Kombination mit einem geeigneten Trendindikator, z. B. dem Standard-EMA
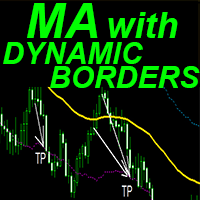
Crypto_Forex Indikator „Gleitender Durchschnitt mit dynamischen Grenzen“ für MT4.
– Der Indikator verfügt über eine einzigartige Funktion, die mit dem gleitenden Durchschnitt verknüpft ist: dynamische Volatilitätsgrenzen. – Dynamische Volatilitätsgrenzen verwenden Werte der durchschnittlichen wahren Spanne zur Berechnung. – Dieser Indikator eignet sich hervorragend für Take-Profit-Targeting und die SL-Anordnung auf Grenzlinien. – Der Indikator lässt sich auch hervorragend mit Price-Action-Sign
123456789101112131415161718192021222324252627282930313233343536373839404142434445464748495051525354555657585960616263646566676869707172737475767778798081828384858687888990919293949596979899100101102103104105106107108109110111112113114115116117118119120121122123124125126127128129130131132133134135136137138139140141142143144145146147148149
MetaTrader Market bietet jedem Entwickler eine einfache und bequeme Plattform für den Verkauf von Programmen.
Wir unterstützen Sie bei der Veröffentlichung des Produkts und beraten Sie gerne, wie man eine Beschreibung für den Market vorbereitet. Alle Produkte, die im Market verkauft werden, sind durch eine zusätzliche Verschlüsselung geschützt und können nur auf dem Rechner des Kunden gestartet werden. Illegales Kopieren ist ausgeschlossen.
Sie verpassen Handelsmöglichkeiten:
- Freie Handelsapplikationen
- Über 8.000 Signale zum Kopieren
- Wirtschaftsnachrichten für die Lage an den Finanzmärkte
Registrierung
Einloggen
Wenn Sie kein Benutzerkonto haben, registrieren Sie sich
Erlauben Sie die Verwendung von Cookies, um sich auf der Website MQL5.com anzumelden.
Bitte aktivieren Sie die notwendige Einstellung in Ihrem Browser, da Sie sich sonst nicht einloggen können.