Neue technische Indikatoren für den MetaTrader 4 - 100
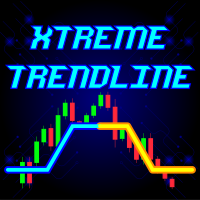
Xtreme TrendLine is an advanced powerful trend indicator. This indicator is based on candles analysis and trend channels. It can be used on any trading pair or instrument on any time-frame. This indicator is accessible in EA via iCustom functions and is fully customizable by user.
Features Any trading instrument Any timeframe Fully customizable by user More Trendlines on one chart Can be used in EA via iCustom function Can be use on more timeframe at once to catch best moment for the trade ent

PLEASE HELP REVIEW/ SUPPORT/ SHARE THIS OTHER INDICATOR HERE https://www.mql5.com/en/market/product/51637 AS YOU DOWNLOAD THIS ONE FOR FREE. THANKS.
This Indicator is based on four moving averages and the PIVOT points. The indicator provides clarity to trading, especially in ranging markets when price is very slow and tight. You can trade intensively daily, every day with this indicator. You may decide to trade with this indicator alone and get the maximum out of the market. The indicator w
FREE

SmartChanel is a universal indicator for all types of markets. This indicator should have in its arsenal every trader, since it represents a classic approach to analyzing the price of a trading instrument and is a ready-made trading strategy. The indicator forms the upper, average price movement limit.
Advantages of the indicator works with any trading tool works on any time period can be used both in the classical market and in the binary options market the indicator has no settings and is s
The Slope Scanner is a Multi-Currency, Multi-Timeframe scanner of The Slope indicator. It calculates the slope of the price, and displays its direction for each symbol and each timeframe on a display board. Check Video Below For Live Trading Demonstration. Get a 7-Day Free Trial Version: Click Here (Full Access to The Indicator for 7 Days) Key Features: Allows you to see Multiple Murrency signals from one chart Calculates the slope of the Pair on All Timeframes Get a Currency Slope Strength

Индикатор ViPa-это мощный инструмент ,который работает как в трендовых,так и флетовых рыночных условиях.Отлично подходит как для новичков,так и опытных трейдеров.
1.Очень прост в использовании. 2.Не имеет входящих параметров. 3.Визуализация с помощью понятных картинок. 4.Не требует дополнительных индикаторов. 5.Работает по всем инструментам. 6.Идеально подходит для скальпинга. 7.Не перерисовывается. 8.Входы с низким риском.

Needing to drill down further on a specific bar's behavior? No need to open another chart! The Magnifying Glass indicator can show the price action of a specific bar from a lower timeframe.
Just hover the cursor over the bar in question and one can see the lower timeframe candles that actually make up the bar on the chart. The candles display scaled to the actual bar that's hovered on to the bar's immediate right.
There is no input parameters, the selections are done entirely via buttons
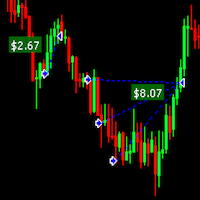
Draw Profit indicator can efficiently help those traders who want to see on the chart all closed positions output: profit or loss. If set DrawProfit on your chart managed by an Expert Advisor (EA) you will see clearly it’s performance by its profits & losses. My other products: https://www.mql5.com/en/users/hoangvudb/seller
Input parameters: Show Profit Labels : show profit of orders with a label (true/false). Profit Mode : available options: Show in currency. Show in pips. Show in currency
FREE

SIGNALINE INDICATOR This indicator for all pairs and all timeframes I have just completed the M5 timeframe for deep optimization EURJPY yet. EURJPY M5 Optimization ( TP=150 , SL=130 , IndicatorPeriod=6 , Mov1=22 , Mov2=48 ) (*)Added 20.05.2019 You can find this signal page below https://www.mql5.com/en/signals/583477 Other optimizasyon results will be added on this signalpage. Input Parameters: IndicatorPeriod: Default is 8. Mov1 : Default is 21. Mov2 : Default is 48.

The M.O.D.E stands for " Multiple Oscillator Divergence Exit ". It is an indicator which signals a divergence between the price, and multiple oscillators. It is initially an exit indicator because it signals the weakening of a trend, but it could be used as an entry signal if used analytically Key Features: Check many divergences at once Non repainting Sends Alerts and Push Notifications You could load the M.O.D.E onto a single chart, and be able to see the divergences happening on multiple os
FREE

PLEASE HELP REVIEW/ SUPPORT/ SHARE THIS OTHER INDICATOR HERE https://www.mql5.com/en/market/product/51637 AS YOU DOWNLOAD THIS ONE FOR FREE. THANKS.
The indicator was created to make trading very easy to understand. It is based on five moving average crosses and pivot points. Download the "EASY TREND" on my Product list for a more advanced and profiting trades. You can trade with this indicator alone and get the maximum out of the market. If you are a new trader, just open your chart windo
FREE
The Slope is an MT4 indicator that calculates the slope of the price, and draws a histogram so you could see when it's positive, negative, or ranging.
Key Features: Calculates Slope of the Line Chart Shows the numbers as a Histogram below the chart Choose Different Periods for calculating the slope. Sends Alerts and Push Notifications when slope changes direction Settings:
CalculationPeriod: The number of bars used to calculated the slope ( for example, if CalculationPeriod = 10, The Slope
FREE

Embark on the pinnacle of Binary Options evolution. Our indicator isn't just adaptive—it's relentless. Picture a ninja riding a serpent, shadowing its every move; that's how this tool trails the market trend, unwavering till the end. Built upon the foundational prowess of the Ichimoku indicator and honed with an array of fine-tuned oscillators, it epitomizes accuracy and precision. Dive deep without getting lost in the Ichimoku's intricacies—our indicator simplifies the process for you. Perhaps

Trend/Range Detector is an indicator that allows to determine with accuracy if the future price will range or trend in the following bars. The Indicator is drawn in a separate window where two lines are displayed : the crossing of the main signal (blue) with a moving average (orange) will determine if each zone is a trending or ranging market.
Parameters : period : the number of bars to look back (default = 20) type : type of the main signal (trend or range) (default = RangeDetector) Moving av

This indicator Super Channel Arrow and zak indicator.Indicator displays trend movement. Indicator calculates automatically line. Features
FiltPer - displays indicator channel period. FiltPer2 - displays indicator period. deviation - displays indicator channel deviation. How to understand the status: If the arrow is green, trend is up. If the arrow is red, trend is down. best FiltPer ,period timeframe M1-H1 (100);H4-MN (50) best FiltPer2, period timeframe M1-H1 (50);H4-MN (25) /////////////////

Golden Chip provides Basic Market Structure, Fibonacci, supply and Demand Zones. Letting you identify when a sell off point is approaching or whne a buy opportunity is arriving. The awesome thing about Golden Chip is that, you will see rejection levels or continuation before ANYBODY ! This indicator moves directly with price and lines up perfectly with the Chart. Some indicators would lag but NOT this one ! Golden Chip is amazing for Clean chart (Naked Chart). GOLDEN CHIP IS ONLY ON METATRADER (

EasyTrend Pro is the powerful trend indicator provided with all necessary for trade and it is very easy to use. Everyone has probably come across indicators or Expert Advisors that contain numerous input parameters that are difficult to understand. But here, input parameters are simple and it is no need to configure anything — neural network will do all for you.
Difference from a classic version
The real-time multi time frame panel is added, so you can check a trend for other timeframes witho

VR Sync Charts ist ein Dienstprogramm zum Synchronisieren von Markierungen zwischen Fenstern. Mit VR Sync Charts werden Ihre Trendebenen, horizontale Ebenen, Fibonacci-Markierung mit allen Diagrammen synchronisiert. Das Dienstprogramm erm?glicht, alle Standard-Grafikobjekte im MetaTrader-Terminal zu synchronisieren, alle Ihre Trends, Gann-Linien und andere Objekte werden genau auf benachbarte Diagramme kopiert. Sie m?ssen nicht mehr ihre Lineatur und Markierung manuell kopieren. Unten in den Abb

Attention!!! Do not try to test an Indicator in Tester, this is very difficult and mathematical calculation will consume all your Memory of computer. Test can be provide only on high performance computers. In Forward trading Indicator run without any problems. Better is rent product and test this calculation. After buy this indicator - BOILERMAKER, we will give for FREE our another indicator - Keltner MTF , contact us - after buy. PLEASE ONLY BUY LIFETIME LICENSE NO RENT!!! We add on MQL ma

Chart Patterns Detect 15 patterns (Ascending Triangle, Descending Triangle, Rising Wedge, Falling Wedge, Bullish Flag, Bearish Flag, Bullish Rectangle, Bearish Rectangle Symmetrical triangle, Head and Shoulders, Inverted Head and Shoulders, Triple top, Triple Bottom, Double Top, Double Bottom) Use historical data to calculate the probability of each pattern to succeed (possibility to filter notification according to the chance of success) gives graphic indication about the invalidation level and

Description: The indicator predicts, with a specific probability, if the actual candlestick range will expand or contract compared to the range of a previous candle. Furthermore, the indicator shows the possible high or low of the actual candle, based on trend direction. (Recommended for Daily, Weekly, or Monthly timeframes).
KEY LINKS: Indicator Manual – How to Install – Frequent Questions - All Products How to use the indicator: Determines, with a certain probability, if there will

Mars 2 is a Oscilator indicator. I s a powerful indicator of TREND for any par and any timeframe. It doesn't requires any additional indicators for the trading setup.The indicator gives clear signals about opening and closing trades.This Indicator is a unique, high quality and affordable trading tool.
Perfect For New Traders And Expert Traders Low risk entries. Never repaints signal. Never backpaints signal. Never recalculates signal. For MT4 Only Great For Scalping Great For Swing Trading

Scalpises Assistant is a complete trading system for scalping on any currency pair. The indicator itself analyzes the market and gives the trader signals to open orders. Also sends signals using email and push notifications. This indicator displays information in two windows. In the main window, the indicator draws signals in the chart in the form of arrows. In the additional window, the indicator shows the ratio of the number of profitable and loss-making signals, shows the current signal on o

Must be owned and used by Fibonacci traders who like to open position by pending order (limit order). The strategy is that you just have to wait for the automatic custom fibonacci appear then manual place your pending order, stop loss and take profit at the level of Fibonacci. The position will be opened when the price make a successful retest. Fibo Heart Indi come with pop-up alert, email and mobile push notification. Suitable for all instruments and all time frames. Don't miss the trading set

Dear traders! This indicator automatically displays multiple Anchored VWAPs (AVWAPs) on the chart. They act as strong Supports or Resistances. They add a lot of confluence to trading systems. As per feedbacks from users, we have incorporated BOTH AVWAPs in latest version. HL AVWAPs and Time AVWAP.
Let us understand about them in brief. In Inputs section, from Display Choice, user can select either or both of abovementioned AVWAPs.
1. HL AVWAPs - Anchor VWAP Bands from Swing High / Low,

Strong Retracement Points Pro edition! SRP (Strong Retracement/Reversal Points) is a powerful and unique support and resistance indicator. It displays the closest important levels which we expect the price retracement/reversal! If all level are broken from one side, it recalculates and draws new support and resistance levels, so the levels might be valid for several days depending on the market! If you are still hesitating to start using this wonderful tool, you can check this link to see how ef
The RSI Symmetric indicator approximated by function of the known Buzzer indicator.
Display for the high timeframe is provided.
2 types of signals are of interest:
1. Position of the RSI line concerning the approximated line
2. The trend direction of the approximated line
Indicator parameters:
RSI TimeF rame - the worker timeframe (it has to be equal or more than current);
RSI Period - no comments;
Buzzer Period is the period of approximation of the RSI Symmetric indicator;
B

Scalper gun - the main weapon for trade in scalping and swing, with visualization and alert of entry points. The indicator works in both trend and non-trend market conditions. Suitable for beginners and experienced traders. SCALPER GUN surpasses popular top indicators of this site in speed, quality of visualization and accuracy of entry !!!
Before buying, download the Scalper gun demo and compare it with similar indicators for scalping in the MT4 tester. Features This is a complete trading s

Voodoo Scalper Bars enjoy scalping. Color change trend changed.
Works in EURUSD/GBPUSD/XAUUSD/USOIL/US500/USDJPY/USDCAD/JP225/USDTRY/USDMXN and CFD's all pairs
The input parameters are optimized for all pairs best timeframes M1 and M5 Voodoo Scalper Bars used Bar Charts
Signal on close of a bar.
DOES NOT repaint. DOES NOT repaint. DOES NOT repaint. DOES NOT repaint.
DOES NOT recalculate. DOES NOT recalculate. DOES NOT recalculate. DOES NOT recalculate NOTE : SCALPING COLOR CHANGED FOLLOW

This indicator is just a simple ATR indicator. It calculates the Average True Range and let you tell it to show the percentage of the ATR. You will then see the % of the ATR on the screen. I like to use it to calculate different things for my trading. If I use the really great AW Recovery System ( https://www.mql5.com/en/market/product/28868 ) there is a great strategy made by the developer, where you watch the daily ATR and set the steps calculated on part of the ATR. So if you put the Part of

This is triangular moving average(TMS). TMS uses Simple Moving Averages for moving average calculation. If TMA periods is 5,five SMAs are used for calculation. TMA weights middle part of the price series. In other words,TMA is less noisy and more accurate .
Input Parameters TMAPeriods ----- Defines perids for TMA calculation.
ModeForTMA ----- Defines mode for TMA calculation.This is normally SMA.
AppliedPriceForTMA ----- Defines applied price for TMA calculation. ShowNormalMA -----Show norma

Description The indicator measures a currency’s relative strength, on different timeframes, through certain percentile spread analysis. This allows you to compare which are the strongest currency pairs, against the weakest pairs. These spreads are based on comparison against USD. KEY LINKS: Indicator Manual – How to Install – Frequent Questions - All Products How is "Clever Spread Currencies Strength" useful to you? This indicator determines a currency’s strength for different timeframe
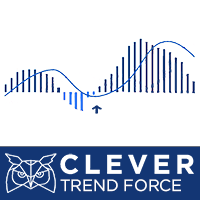
Description: Indicator which uses trend, breakout and reversal innovative indicators to show a complete visual trading strategy, with transparent metrics. It follows simple visual patterns, which will improve your trading significantly. Support: We create great tools for the entire trading community. Most of them are free. If you believe in what we do Support Us Here. KEY LINKS: Indicator Manual – How to Install – Frequent Questions - All Products
Outstanding Features Shows c

Supply Demand Zone Pro Indicator works with all products and timeframes. It is using a new calculation method, and now you can select the desired zone on any timeframe! Strongest Zones are already enabled by default This is a great advantage in trading.This indicator has a built in backtester enabled by default, just move the chart.
Supply and Demand ?
Supply is a price zone where sellers outnumbered buyers and drove the price lower. Demand is a price zone where buyers outnumbers sellers and

ZhiBiTMG ist eine Sammlung von Trends und Martingale-Indikatoren für alle Marktsegmente und alle Chartzyklen. Viele Indikatoren auf dem Markt verstoßen gegen den Trend, behaupten aber, genau zu sein, aber ist sie wirklich genau? In der Tat ist es nicht genau! Weil der Markt dem Trend folgen muss. Dieser ZhiBiTMG-Indikator gibt das Martingale-Signal unter der Voraussetzung des Trends an. Dies wird den Marktregeln entsprechen. Gebrauchsanweisung: Die rote Linie ist die Abwärtstrendlinie (Sell), in
This indicator was specially developed to support the powerful day trading strategy described in the book "The Price in Time" . The NTZ BOX indicator automatically creates: The Day separators The No Trading Zone divided with the Green Box, the Peach Box and the Turqoise Box Extensions of the long and short Take Profit levels The Yellow Box to display the range of the Asian session The Money Manager for a perfect Position Sizing calculated on your risk percentage Using the NTZ BOX indicator will

Arrow indicator for easy determination of trend estimates All arrows remain in place and after closing the candle does not disappear. Can send notifications to your phone or email Works on any currency pairs, metals and cryptocurrency Suitable for working with binary options Distinctive features Does not redraw; Defines trend changes; Sends signals to a smartphone or email; Advanced settings for fine tuning; Works on all timeframes and on all symbols; Suitable for trading currencies, metals, opt

BeST_Trend Exploiter is a Metatrader Indicator based on a smart proprietary algorithm which can detect the market Median Trend while it filters out the noise providing Buy and Sell Signals and also wherever it is applicable it provides us with TP Levels of High Probability. Additionally as it has Built Inside all the necessary features it can be used as a Complete Strategy of very Impressive Results. Essential Advantages of the Indicator
Clear and Easily Understandable trading rules. Real Time
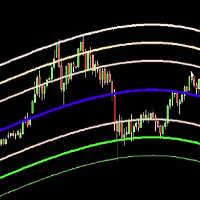
The Belkhayate center of gravity indicator is best used to confirm major turning points, and distinguish price extremes. Generally if price reaches the upper or lower levels one should expect a turn around coming soon, or at least a pull back towards the centre line if there is a strong trend. The upper and lower levels are red and green lines.
Our indicator use the same parameters as the well known trader M.Mostafa Belkhayate the inventor of the indicator, allow the use of buffers for your EA
This indicator was developed to support multiple timeframe analysis. In the indicator settings, the user can set the color, width, and style of the horizontal lines for each timeframe. This way, when the horizontal lines are inserted into the chart, they will be plotted with the timeframe settings.
MTF Lines also allows visibility control of another objets like rectangles, trend lines and texts.
This is a product developed by Renato Fiche Junior and available to all MetaTrader 4 and 5 users
I present to your attention the indicator ADX-MA Arrows MTF . The indicator is based on the two standard indicators Moving Average and Average Directional Movement Index . It represents the entry signals in the form of arrows. All signals are generated on the current bar. It is maximally simplified to use both for trading exclusively with one indicator and for using the indicator as part of your trading systems.
A feature of the indicator is that the indicator timeframe can be set independentl

CSS " currency strength slope " is a a multi currency strength indicator that use Forex major currencies, EUR, USD, CAD, AUD, NZD, JPY, CHF, GBP. it use 28 major pairs to calculate the power of every currency using a based moving averages algorithm : you will see volatility clearly between currencies. input: MA Fast & Slow. - MA Mode : simple, exponential, smoothed, linear weighted
- Applied Price : close, open, high, low, median price, typical price, weighted price.

This is a simple PriceTMA bands, non repaint! it can be used for a trend following system or sometimes reversals. as a main signal or a filter for others strategies, it depends on the trader main strategy. calculations for this indicator are a combined Algorithm between moving averages "MA" and average true range"ATR". good luck with your trading! i hope it is helpful Cheers

В основе индикатора TDI лежат следующие индикаторы: RSI, Moving Average, Bollinger bands, но основным из них нужно выделить RSI, весь расчет индикатора завязан от его значений.
Зеленая линия (линия RSI) – сглаженные простой (по умолчанию) скользящей средней значения индикатора RSI, период сглаживания 2.
Красная линия (сигнальная линия) – сглаженные простой (по умолчанию) скользящей средней значения индикатора RSI, период сглаживания 7.
Синие линии – индикатор Bollinger bands по умолчанию п
FREE

This indicator Super MA Pluss indicator.Indicator displays trend movement. Indicator calculates automatically line. Features
FiltPer - displays indicator period. How to understand the status: If the arrow is green, trend is up. If the arrow is red, trend is down. /////////////////////////////////////////////////////////////////////////////////////////////////////////////////////////////////////////////////// //////////////////////////////////////////////////////////////////////////////////////

Use of support and resistance in systematic trading is very subjective. Every trader has their own idea and way to plotting the support and resistance levels on the chart. KT Support and Resistance indicator take out this ambiguity out of the situation and automatically draws support and resistance levels following an algorithmic approach using a unique multi-timeframe analysis.
When launched on the chart, It immediately scan the most significant extreme points across all the available timefr

Индикатор внутри коробки считает количество баров и высоти коробки. фильтрация коробки происходит с помощью пробоя в пунктах или в процентах. Входные парамеиры Минмальное количество баров в нутри коробки Максимальное высота коробки Варянт величины (фылтрация коробки) величина в пунктах после пробоя коробки величина в % после пробоя коробки Максимальное количество стрелок, сигналы на покупку или на продажу.
Militärhund s-Armee wird Ihnen helfen, Einstiegspunkte für die Indische Verarbeitung zu identifizieren. Er arbeitet für alle peridos. Sie können die ADR-Level aus den Einstellungen durch Doppelklick auf die Strategie öffnen. Wenn Sie die ADR-Funktion deaktivieren, finden Sie weitere Transaktionen.
Insbesondere ermöglicht es Ihnen, neben Ihrer eigenen Strategie, Ihre verarbeitungseingänge durch einen besseren Qualitätsfilter zu übergeben.
Möchten Sie, dass der ADR-level ein bestimmtes Tagesv
Keltner MTF (Not repaint!!!) is a channel indicator that can display price channels from different timeframes on a single chart of quotes. For example, on the H1 chart, you can see at the same time the Keltner price channel from the M15 and H4 timeframe. This tactic makes it possible to more clearly understand the tendency of price movements, to determine trading goals and points for making deals. How the Keltner MTF Indicator Works The Keltner MTF indicator can be used both - for trading in

The elite (V3) multi-indicator suite from JoaquinTrading specifically geared towards Forex & binary options, including regulated exchanges such Nadex, Cantor Exchange, and other binary option brokers.
The Probability Tool Suite Elite will provide the given win/loss outcome probabilities of up to 10 strike levels, a specific expiration duration, based on a combination of up to 16 indicators, rules, or conditions and derivative behavior (i.e. expiry, touch, touch & retrace). Using this indicat

The Signal Strength Meter is a Multi-Currency, Dual Timeframe Interactive Indicator, which calculates the strength of buy and sell signals, and displays a score for each symbol on a display board. Get a 7-Day Free Trial Version: Click Here (Full Access to The Indicator for 7 Days) Check Video Below For Complete Demonstration, and User Manual here . Key Features:
Allows you to see multiple currency signals from one chart Analyses the signals from more than a dozen classic indicators Identi
Sessions PRO is a perfect tool which divide your chart screen by 3 main market sessions: 1> asian 2> european (with division for Frankfurt and London start) 3> american
Sessions PRO is perfect especially for trading indices, where main pivot points often occurs along with new market center enters the market. With Sessions PRO you see what events happened at their exact corresponding time - European and American moves and pivot points are much more important than asian. Stop analyzing your char

This indicator weigth the actual close price with the high and the low of past values then it is computed by a simple 1 lag IIR filter before being processed by a final logarithmic algorithm to order the data.
This Indicator is perfect to find precise reversals.
Rules of Trading : 1) Be sure that the yellow line is in overbought/oversold (above +5 or under -5) The higher/lower, the better. 2) Wait for the gray line to touch the yellow line then separate from it : this is the signal. 3) If t

This indicator Master XR indicator.Indicator displays trend movement. Indicator calculates automatically line. Features
FiltPer - displays indicator period. deviation - displays indicator deviation. deviation2 - displays indicator deviation. How to understand the status: If (Timeframe M1-H1) FiltPer = 100; If ( Timeframe H4-MN) FiltPer = 5-20; ////////////////////////////////////////////////////////////////////////////////////////////////////////////////////////////////////////////////////// /
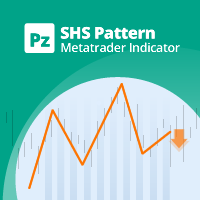
Ein Kopf-Schulter-Muster ist eine Diagrammformation, die einer Grundlinie mit drei Spitzen ähnelt, wobei die beiden äußeren in der Höhe nahe beieinander liegen und die mittlere am höchsten ist. Es prognostiziert eine zinsbullische Trendumkehr und gilt als eines der zuverlässigsten Trendumkehrmuster. Es ist eines von mehreren Topmustern, die mit unterschiedlicher Genauigkeit signalisieren, dass ein Trend sich seinem Ende nähert. [ Installationsanleitung | Update-Anleitung | Fehlerbehebung | FAQ

Description: The indicator shows the TDI indicator in a separate window, and with the RSI component, the indicator finds possible divergences with M or W patterns. KEY LINKS: How to Install - Frequent Questions - All Products Functions: Finds Market Makers patterns. Finds extremes or exhaustion into the market. Looks for a trend continuation. Content: TDI Indicator Divergence and M or W Signals Note 1: This indicator should only be considered as a part of any trading strategy. You shoul
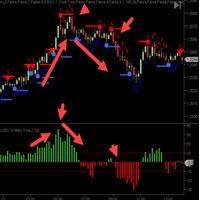
Der CycleTraderPro Close Strength Value Indicator misst die Entfernung vom ÖFFNEN eines neuen Balkens bis zum CLOSE des Balkens.
Eingabe -
Länge = 10 Standard
Wir addieren diese Werte zusammen und setzen die Längeneinstellung zurück.
Wenn der 1. Takt plus 10 Ticks und der nächste Takt minus 7 Ticks wäre, würde dies +3 sein
Es gibt zwei Möglichkeiten, den Close-Strength-Wert zu handeln:
1. Handel in Richtung niedrigerer Hochs und niedrigerer Tiefs und umgekehrt für Käufe, höhere
FREE

ZhiBi Fast Scalp stellt ein gutes schnelles Scalping-Index-System dar. Das Signal schwingt entsprechend dem Trend und die Buy- und Sell-Signale werden häufig angegeben. Geeignet für alle Marktvarianten und Zeiträume.
Der Aufwärtspfeil scheint die Bestellung zu platzieren. Der Abwärtspfeil scheint die Bestellung zu platzieren.
Parametereinstellungsbeschreibung: [Signal_line_period]: Die durchschnittliche Periode der Signalleitung mit kleinem Zyklus. [Trend_line_period]: Die durchschnittliche
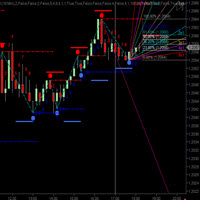
CycleTraderPro CycleWave Indicator besteht aus 9 Indikatoren in 1.
Es verwendet die CycleTraderPro-Indikatoren und -Muster, um Zyklen und mehr in Echtzeit zu identifizieren.
Die 9 Teile von CycleWave:
Zeichnet Cycle Bands und bestätigt Cycle High / Lows in Echtzeit nach jedem erfolgreichen Cycle-High oder -Low.
Diagramme Cycle Wave Price-Fenster über und unter jedem Balken mit einem geänderten% -Bereich des vorherigen Balkens.
Zeichnet das Fibonacci-Retracement automatisch
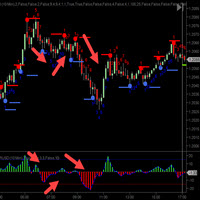
Das CycleTraderPro Tick Momentum misst die Anzahl der Ticks, die der Markt in Richtung aufeinanderfolgender Schließungen bewegt.
Wenn sich der Markt über dem Ende befindet, beginnt er in der Richtung zu zählen, um wie viele Ticks er sich bewegt hat.
Wenn sich der nächste Takt in den Zügen befindet und in die gleiche Richtung schließt, zählt das Tick-Momentum weiter hoch, bis der Markt unter seinem Markt schließt. In dieser Richtung beginnt der Countdown.
Sie können diese Bewegungen abwe
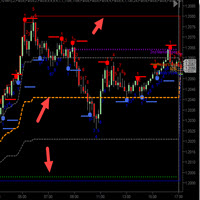
Der CycleTraderPro Open / High / Low / Medium-OHL nimmt den Tiefst- und den Höchststand des Tages und zeichnet diese Werte auf:
1. Hoch des Tages (rote Linie)
2. Tief des Tages (blaue Linie)
3. 25% vom Tiefpunkt (graue Linie)
4. 50% der Reichweite (Orange Line)
5. 75% vom Tiefpunkt (graue Linie)
Wir scheinen weit über dem 50% -Bereich und kurz darunter zu sein
Sie können diese Ebenen leicht erkennen, wenn sich der Markt bewegt. Wenn der Markt ein neues Tief oder Hoch erreich
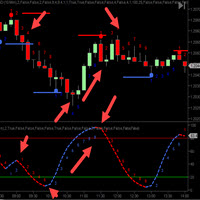
Der CycleTraderPro Power Play Indicator (PPI) - ist einer unserer beliebtesten Indikatoren. Wir nehmen alle CT-Indikatoren und kombinieren sie zu einem Indikator.
Die gesamte Auswahl an Indikatoren ist mit Ein / Aus-Funktionen ausgestattet. Sie können also Ihren eigenen Indikatormix auswählen und nur diesen Mix darstellen.
Wir nehmen einen Durchschnitt der gewählten Mischung. Bei der Auswahl von 5 Indikatoren teilt PPI die Mischungswerte durch 5.
Dann zeichnen wir eine Zykluszählung für
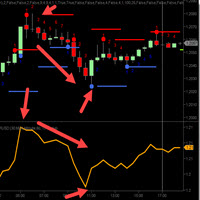
Die CycleTraderPro Orange Linie - Bressert DDS - DoubleStoch - Mein Vater Walter Bresser t hat diese DDS seit Jahren berühmt gemacht.
Sie arbeiten mit Code von Stochastic und glätten sie noch einmal mit nur einer Zeile.
Je nach Länge der Indikatoren, die länger für mehr Trends und kürzer für die Skalpierung der Märkte sind, ist die Orange Line eine Länge von 100.
Es gibt zwei Möglichkeiten, die Orange Line zu handeln:
1. Handeln Sie oberhalb und unterhalb der 50-Marke in dieselbe Ric

The principle of the indicator. The StatChannel ( SC ) indicator is a development of the Bollinger Bands indicator ( ВВ ). BB is a moving average, on both sides of which two lines are drawn, separated from it by standard deviations std multiplied by the corresponding coefficient. At the same time, a moving average with an averaging period (2n + 1) bars is always obtained lagging behind n bars. Sliding std is also lagging behind on n bars, also calculated by (2n + 1) points. Such
The original multi-indicator suite from JoaquinTrading specifically geared towards binary options, including regulated exchanges such Nadex, Cantor Exchange, and other binary option brokers.
The Probability Tool Suite Classic will provide the given win/loss outcome probabilities of up to 10 strike levels, a specific expiration duration, based on a particular indicator's parameters and derivative behavior (i.e. expiry, touch, touch & retrace). Using this indicator will give users an idea if a

FZR indicator determines fractal zigzag reversal pattern of all the time frames of the chosen symbol and shows the information in the Info label. Indicator draws the detected pattern in the chosen time frame and also you can select in the menu to draw the trend line according to FZR peaks. What it is FZR? See the first picture in the screenshots. As you can see for every peak of FZR the AO indicator must cross zero line. FZR indicator determines the trend direction.
How to use FZR for trading?
FREE

Trend Lines Cross This indicator will alert you on any cross of a Trendline. You can draw up to two trend lines and form a channel, a pennant , a triangle or a simple trend and when the price crosses either trend line the indicator will provide you with alerts that you define plus an up or down arrow when the cross happened. How to: Draw the 1st trendline and name it tl1. Draw the 2nd trendline and name it tl2. Select which type of alerts you would like in the indicator properties and you a
FREE

indicator for binary options! open a deal only for 1 - candle The indicator is already set to trade in binary options. The indicator is ideal for trading on martingale since he very accurately combines what the next candle will be if you are trading in a martingale money management, this is the indicator that you were looking for; it is just created for you and your trading style p.s it is much better than relying on the color of the candle as some not very experienced traders do (therefore, the

We stopped creatin small tools for MT4. Our focus are on MT5. Only very useful tools maybe we will develop to MT5. New Candle Alert is a simple indicator that notify you when a new candle is formed.
You can modify the notification message that will appear for you. The alarm sound is default by meta trader program.
MT5 version: https://www.mql5.com/pt/market/product/37986
Hope you enjoy it. Any doubt or suggestions please notify on private or by comments.
See ya.
FREE

iVolX indicator horizontal volumes for all time periods
Main settings of the indicator: VolumeSource - select data for volumes (tick or real) PeriodMinutes - selection period for rendering of volumes PeriodsNumber - number of periods to show on the chart StartDate - the start date of the calculations ClusterPoints - cluster width Color - color MaxVolColor - maximum volume color ValueArea - the value of the zone of balance ValueAreaColor - color of the balance zone MaxVolFontSize - fo
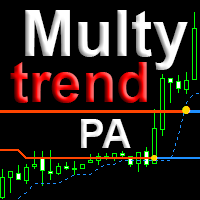
The indicator combines the principles of Price Action and a unique filtering algorithm with feedback for the three movings, this allows you to determine the pivot points and the current trend on any timeframe with a high probability. MultyTrend PA is an evolution of the Trend PA indicator and can be used on the principle of the three Elder screens, with everything you need is displayed on the same graph. Line 1 fast moving, Line 2 main moving, Line 3 - slow moving to determine the direct
Erfahren Sie, wie man einen Handelsroboter im MetaTrader AppStore, dem Shop für Applikationen für die MetaTrader Handelsplattform, kaufen kann.
Das Zahlungssystem der MQL5.community ermöglicht Zahlungen mit PayPal, Kreditkarten und den gängigen Zahlungssystemen. Wir empfehlen Ihnen eindringlich, Handelsroboter vor dem Kauf zu testen, um eine bessere Vorstellung von dem Produkt zu bekommen.
Sie verpassen Handelsmöglichkeiten:
- Freie Handelsapplikationen
- Über 8.000 Signale zum Kopieren
- Wirtschaftsnachrichten für die Lage an den Finanzmärkte
Registrierung
Einloggen
Wenn Sie kein Benutzerkonto haben, registrieren Sie sich
Erlauben Sie die Verwendung von Cookies, um sich auf der Website MQL5.com anzumelden.
Bitte aktivieren Sie die notwendige Einstellung in Ihrem Browser, da Sie sich sonst nicht einloggen können.