Neue technische Indikatoren für den MetaTrader 4 - 117
This indicator detects Inside Bar Narrow Range 4 and Inside Bar Narrow Range 7 two powerful patterns on 28 pairs on all timeframes. "Inside Bar Narrow Range 4" is an inside bar with the narrowest range out of the last 4 bars so "Inside Bar Narrow Range 7" an inside bar with the narrowest range out of the last 7 bars.
Hence, IBNR4 and better IBNR7 are an objective criterion for identifying decreased range and volatility. Once we find an IBNR4 or an IBNR7 pattern, we aim to trade the breakout

The algorithm of the indicator is based on the fact that the price is attracted to the slow moving average The same applies to a fast moving average that moves around a slow moving average These moving averages have a special smoothing algorithm. When the fast Moving average goes up and is below the slow Moving average, we have a potential signal to open a position-Buy entry When the fast Moving average goes down and is above the slow Moving average, we have a potential signal to open a positio

This cluster indicator is a next generation of CCFpExtraSuperMulti . It's improved in a way, which allows for processing mixed clusters, where symbols from various markets can be included. For example, it can handle Forex, indices, CFDs, spot at the same time. Number of visible lines increased to 16. An interactive ruler can be enabled to measure signals' strength on the history. The indicator creates a set of embedded cluster indicators (CCFpExtraIndices) with carefully selected periods and com

Realization of trend movement indication with points for potential stops in the TrendCloud indicator. It can be easily used as an independent trading system. You can interpret this: the location of the course above or below the shadows show the presence of a trend. The transition to the shadow warns of a possible reversal. Entering the price inside the shadow speaks in a flat motion. The indicator tracks the market trend with unsurpassed reliability, ignoring sharp market fluctuations and noises

Strong Pivot trend indicator is a trend indicator that uses standard pivot calculation and some indicators. The purpose of the indicator is to calculate the possible trends using the pivot point. And to give the user an idea about trend direction.
You can use this indicator as a trend indicator. Or with other indicators suitable for your strategy.
Features The blue bar represents the upward trend. The yellow bar represents the downward trend. The blue pivot point represents the upward trend. T

Super Trend Lines is an indicator that calculates trends using a set of channels and using a set of algorithms. This indicator helps to find trend return points. It generally represents an oscillator. This trend tracking system helps the investor to understand small or large trends and determines the direction according to it.
Time frames: M15, M30, H1
Parameters Period : general trend period. Bar : bar calculation setting Channel_Cal : channel calculation period. The smaller the value here, t

Always Strong indicator, an indicator that uses MacD and Bollinger bands. It is a coded indicator to find trends. It finds these trends by its own algorithm. This indicator requires visual monitoring. It does not give any warning because it needs visual follow-up. The main trendline should turn down to find the down trend. The main trend line should go under the white line and then go under the yellow line. The main trendline should turn upward to find the upward trend. The main trend line shoul

Trend Waves indicator is a trend indicator that uses Average True Range and Standard Deviation indications. It is aimed to find more healthy trends with this indicator. This indicator can be used alone as a trend indicator.
Detailed review 4 different trend colors appear on this indicator. The aqua color represents the rising trend. Dark aqua color means the train is getting weaker. pink color represents the downtrend trend. The dark pink color means the trend is weaker. Parameters Stdeviatio
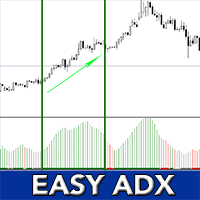
EASY AND SIMPLE STRATEGY - NON REPAINTING - HIGH TIMEFRAME FILTER - EASY TO BACKTEST
*For Desktop MT4 Only *Great For Scalping *Great For Swing Trading *Mobile Alerts, Desktop Alerts *Works On Any Timeframe *Works On Forex, Indices, Crypto *Perfect For New Traders And Expert Traders
We very often use Average Directional Movement Index (ADX) to identify a trend in forex. We use a simple rule: - If the indicator is above level 25, the market is in strong trend and we then study the values of
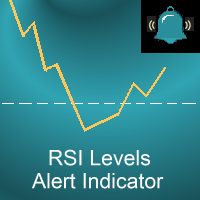
Our custom RSI indicator uses the standard RSI calculation, but it adds a few super-useful upgrades. In our opinion this is the RSI indicator that should come standard with MT4! Have a look and decide for yourself!
Our indicator has the following benefits:
Never miss another RSI set-up when you are away from your computer A colored RSI line makes it easy to see when price is overbought or oversold Get alerts when price moves into overbought/oversold, out of overbought/oversold, or both Customiz

Dynamic Support and Resistance is the collective work of three traders with several decades worth of experience trading all financial markets. The math behind these levels is unlike anything ever produced in the public trading world. Dynamic S&R is a tool to measure ranging markets, trending markets, and aids in catching the turns of the trends when combined with Dynamic PriceWraps. Dynamic S&R can be used for spot FX, futures, stocks, and is incredibly useful in options trading for all produ

Der VR Donchian -Indikator ist eine verbesserte Version des Donchian-Kanals. Die Verbesserungen betrafen fast alle Funktionen des Kanals, der Hauptbetriebsalgorithmus und die Kanalkonstruktion blieben jedoch erhalten. Je nach aktuellem Trend wurde dem Ball-Indikator eine Änderung der Farbe der Niveaus hinzugefügt – dies zeigt dem Händler deutlich eine Trendänderung oder eine Seitwärtsbewegung an. Es wurde die Möglichkeit hinzugefügt, den Händler über den Ausbruch einer von zwei Kanalebenen per S
FREE

Wir stellen Ihnen das Entry Point Dashboard Ultimate vor, einen leistungsstarken technischen Indikator, der Kauf-/Verkaufsbenachrichtigungen für 6 Währungspaare bereitstellt. Dieser Indikator analysiert 5 gleitende Durchschnitte, CCI, RSI, Stochastic, Bill Williams und Volumenindikatoren über 3 verschiedene Zeitrahmen, um genaue Signale zu generieren. Es bietet unbegrenzte Anpassungsmöglichkeiten für professionelle Händler, sodass sie den Indikator basierend auf ihrer Erfahrung und ihren Str

About
Holy Renko is a trend identifier capable of identify small and long market movements. This indicator should be use in Renko Charts.
VIDEO (information and tips) [HERE]
How to install Renko Charts [HERE]
Features
Developed for Renko Charts Easy to analyze Fast signals Not repaint (when candle close) Statistics panel Filters false signals
Alerts, emails and push notifications
Advantages of Renko Chart Easy to install Easy to analyze Filter out the noise of wicks Easy identification

Fibonacci-Erweiterung und Retracement-Analyse-Tool
Fibonacci-Retracing- und Extended-Line-Tools für die MT4-Plattform, ideal für Trader, die die und den Golden Section-Handel nutzen
Hauptmerkmale:
1. Sie können mehrere Sätze von Fibonacci-Retracements direkt zeichnen, und die Beziehung zwischen wichtigen Rückkehrpunkten ist auf einen Blick ersichtlich.
2. Kann Fibonacci-Erweiterungen zeichnen
3. Das Fibonacci-Foldback und die Verlängerung der Linie können nach links und nach rechts zur ein

This indicator based on OBV. He is essentially trending , it can "feel" the trend change. The arrow-signal does not disappear and does not redraw after a bar closes. An order may be opened towards the arrow direction at the next bar after the signal appears. Using this indicator is intuitive. Once the first turquoise arrow appears, buying is preferred. Red – selling. I recommend using the indicator on the H1 timeframe. When the first hand of the opposite color appears and the hour bar clos

Pips collector - this indicator is a complete mechanical trading system. Pips collector itself analyzes the market for 57 characteristics, determining the direction of the trend, volatility, aggressiveness, resistance and support. After this, the Pips collector displays the signals for opening buy or sell orders. Interpretation of trading with Pips collector is very simple and suitable for both professional traders and beginners. Also, the Pips collector indicator can send signals to the trader

Relative Trend Bias
The Relative Trend Bias indicator is a simple indicator that helps you identify the current directional movement bias of a financial instrument based on the number of bars specified. Helps you identify the current trend based on a bar period of your choice Shows you level "safety zones" for reversals Shows you when the trade bias changes while the indicator is active on the chart
Indicator is forward facing. It does not backdraw/backpaint but it can be tested on the indica

Description
The base of this indicator is an ZigZag algorithm based on ATR and Fibo retracement. The ZigZag can be drawn like a classic ZigZag or like Arrows or needn't be drawn at all. This indicator is not redrawing in sense that the ZigZag's last shoulder is formed right after the appropriate conditions occur on the market. The shoulder doesn't change its direction afterwards (can only continue). There are some other possibilities to show advanced information in this indicator: Auto Fibo on

"Giant" is a flexible system in relation to trading strategies. It consists of two high-quality indicators that are installed on five different timeframes of the same currency pair (see screenshot). It monitors the trend and gives signals to open. The system passed a large number of checks and showed high accuracy. Indicators are sold separately. The second word in the main name is the indicator itself. This issue sells the indicator "Nicely" .
FREE

A very useful indicator for trading, which shows the current load on the deposit. The load is calculated by the formula (margin / balance) * 100%. If necessary, the indicator beeps when the load on the deposit exceeds a certain level. The load is displayed total, taking into account all open positions.
Indicator parameters:
Color - text color. Font size - font size. Font family is a font family. Right - indent to the right. Bottom - indent bottom. Max load - the maximum load at which the sound
FREE

"Giant" is a flexible system in relation to trading strategies. It consists of two high-quality indicators that are installed on five different timeframes of the same currency pair (see screenshot). It monitors the trend and gives signals to open. The system passed a large number of checks and showed high accuracy. Indicators are sold separately. The second word in the main name is the indicator itself. This issue sells the indicator "Attention" .
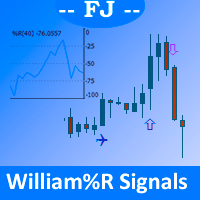
It draws on the main price chart icons indicating clearly the different crosses produced by the William% R oscillator signal as it passes through the overbought, oversold, and intermediate lines.
Allowed customization: - Position of overbought/oversold lines - Your prefered icons - The color of each icon - Periods to use in William% R
Parameters: - WilliSignalsOn_Off: It allows you to hide/show the indicator without having to delete / re-add and configure this indicator - WilliPeriods: Periods

Данный индикатор отмечает участки разворота тренда, в точках разворота давая сигнал на вход в рынок в виде стрелок соответствующего цвета и направления движения в виде линий, а также звукового оповещения. Основан на закономерностях рынка FOREX, точных определениях текущего экстремума и нахождения свечных моделей на вершинах/низах рынка. Универсальный алгоритм помогает определить точки разворота указывая стрелками где осуществить вход в рынок. Дополнительно Индикатор не перерисовывается. Выводит
The ' MTF MA Cross ADV ' indicator comes from MTF Moving Average Cross with an advanced algorithm . Fast & slow m oving average crosses are used for generating up to four arrows either at bar 0 or bar 1.
Key Features Advanced algorithm to detect changes in standard moving average cross w/arrows. There are many settings which can all be non-repaint for signals at a new bar and at bar 0. NewBarConfirm as 'true' means notifications come from bar 0 & bar 1(false). Audible Alerts, e-mail not

The Pallada Manual System indicator is a complete manual trading system that does not require the use of any other indicators. Very simple and clear to use. Estimated profitability, depending on the setting, is 5-30%. The indicator is ideal for those who want to control the trading process, but do not sit at the monitor for days. Ideal for calm measured trading without nerves and stress.
Description
The base of this indicator is an ZigZag algorithm based on ATR and Fibo retracement. This indicator is not redrawing in sense that the ZigZag's last shoulder is formed right after the appropriate conditions occur on the market. The shoulder doesn't change its direction afterwards (can only continue). Note: An indicator with advanced possibilities is also available.
Indicator input parameters
The input parameters allow to change the sensitivity of the ZigZag. ATR period ATR multip
FREE
Highly configurable Osma indicator.
Features: Highly customizable alert functions (at levels, crosses, direction changes via email, push, sound, popup) Multi timeframe ability Color customization (at levels, crosses, direction changes) Linear interpolation and histogram mode options Works on strategy tester in multi timeframe mode (at weekend without ticks also) Adjustable Levels Parameters:
Osma Timeframe: You can set the lower/higher timeframes for Osma. Osma Bar Shift: Y ou can set th
FREE
Highly configurable Momentum indicator.
Features: Highly customizable alert functions (at levels, crosses, direction changes via email, push, sound, popup) Multi timeframe ability Color customization (at levels, crosses, direction changes) Linear interpolation and histogram mode options Works on strategy tester in multi timeframe mode (at weekend without ticks also) Adjustable Levels Parameters:
Momentum Timeframe: You can set the lower/higher timeframes for Momentum. Momentum Bar Shift:
FREE
Highly configurable Demarker indicator.
Features: Highly customizable alert functions (at levels, crosses, direction changes via email, push, sound, popup) Multi timeframe ability Color customization (at levels, crosses, direction changes) Linear interpolation and histogram mode options Works on strategy tester in multi timeframe mode (at weekend without ticks also) Adjustable Levels Parameters:
Demarker Timeframe: You can set the lower/higher timeframes for Demarker. Demarker Bar Shift: Y ou
FREE
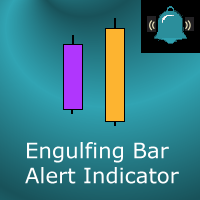
This indicator marks Engulfing Bars (bars with a higher high and a lower low than the previous bar) on your chart. It will also send alerts when one forms, including via e-mail or push notification to your phone . It's ideal for when you want to be notified of an engulfing/outside bar set-up but don't want to have to sit in front of your chart all day. You can configure all the settings including:
Whether it should be "range engulfing" (so high is higher than previous bar and low is lower than

This indicator displays Super Power Beeta trend movement.Indicator is version 2 . Features Multiplier - displays multiplier movement. Multiplier2 - displays multiplier2 movement. Trend - displays indicator trend 1 and trend 2 (true/false).
Background:color - displays background color (true/false).
separate_window - displays trend separate window.(0-1....) separate_window2 - displays trend (background color )separate window.(1-2....) X - move the trend left and right.
Y - move the trend up an

Let´s try to make some real money!
Call me profit addicted. I thought why not try to make THE dream come reality. With discipline, a clear strategy and this indicator I focus on entering the perfect trades. This indicator is very easy to use as you will get perfect entry points for Put or Call trades.
The arrows are calculated with: - Momentum parameters - Candle stick patterns - Fundamental Price action
We recommend to combine it with Parabolic, ZigZag or Elliot waves indicator

Extended VERSION
Ultimate solution on price action trade system Built Inside One Tool! Our smart algorithm tool will detect the price action pattern and alert upon potential with entry signals and exit levels including stoploss and takeprofit levels based on dynamic and unique calculation. This tool will also filters out market currency strength to ensure our entry are in a good currency conditions based on it's trend.
Benefit You Get
Easy, visual and effective price action detection. Gives
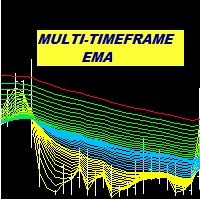
Multi Period EMA A trend indicator based on the exponential moving average. Keeping track of multiple EMA is a more effective way of detecting possible trend development. This indicator allows for the setting of as many as 6 different EMA periods. Unused period parameters can be set to zero to exclude the particular EMA from being displayed on the chart.
Features Up to 6 EMA displayed on chart. Option to select high EMA and Low EMA in order to detect crossovers Alert in event that change in sl

Wir stellen den Entry Point vor, einen leistungsstarken technischen Indikator, der Kauf-/Verkaufsbenachrichtigungen liefert. Dieser Indikator analysiert 5 gleitende Durchschnitte, CCI, RSI, Stochastic, Bill Williams und Volumenindikatoren über 3 verschiedene Zeitrahmen, um genaue Signale zu generieren. Es bietet unbegrenzte Anpassungsmöglichkeiten für professionelle Händler, sodass sie den Indikator basierend auf ihrer Erfahrung und ihren Strategien anpassen können. Der Einstiegspunkt sendet

PriceRunner-Indikator zur Trenderkennung ohne die Auswirkungen versehentlicher Preissprünge. Es verwendet Preisreihen und einige gleitende Durchschnitte zur Rauschunterdrückung. Es funktioniert in mehreren Zeitrahmen, sogar M1. Um die Effektivität zu erhöhen, wird empfohlen, Standardparameter für die M1-Grafik zu verwenden (siehe Screenshots). Sie können die Einstellungen für andere Zeitrahmen ändern. Beispiel für die Verwendung dieses Indikators: Wenn Gold nach unten zu Blau und sowohl Gold al
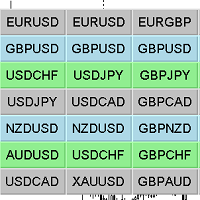
Chart Changer Indikator zur schnellen Navigation durch Finanzinstrumente. Wenn Sie auf die Schaltfläche klicken, erfolgt ein Übergang zum Chart des Finanzinstruments, dessen Name auf die Schaltfläche geschrieben wurde.
Mit anderen Worten, der Indikator öffnet oder entfaltet ein bestehendes Chartfenster, wenn es kein solches Chart gibt, öffnet der Indikator es, wenn es in der Marktüberwachung dieses Terminals vorhanden ist.
Für jedes Diagramm können Sie den Namen des Finanzinstruments, die Text

Die Struktur des Indikators. Der Cunning Krokodil Indikator (Klug Krokodil) besteht aus drei gleitenden Durchschnitten (angewandt auf den Median Preis = (hoch + niedrig) / 2): 1) ein konventioneller MA ( SMA , EMA , SMMA , LWMA ) oder durchschnittlicher <X> Prozess X und zwei Verallgemeinerungen 2) <XF> = < X / <X >> * <X> und 3) <XS> = <X * <X >> / <X>, aus der gleichen Mittelungsperiode. Alle drei Kurven kreuzen sich an einzelnen Punkten, was (eine solche Kreuzung, in der

Range Volume Profile The indicator Range Volume Profile shows the distribution of transactions on the price scale in a given time range. This tool simplifies the analysis of the market situation and helps to find the price levels where a large player is sitting. Features: shows the distribution of tick volumes relative to the price. shows the distribution of real volumes relative to the price. If your broker provides them. you can select the part of the chart that you want to explore. for cert

BinaryUniversal is a signal indicator for binary options and Forex. In its work, the indicator uses a complex algorithm for generating signals. Before forming a signal, the indicator analyzes volatility, candlestick patterns, important support and resistance levels. The indicator has the ability to adjust the accuracy of the signals, which makes it possible to apply this indicator for both aggressive and conservative trading. The indicator is set in the usual way, it works on any time period and

The arrows are calculated with: - 2 Parabolic parameters - 2 ADX parameters - 4 Stochastic parameters
We recommend to combine it with Parabolic, ZigZag or Elliot waves indicator. Always trade the trend!
If you make sure to draw your trend lines and support/resistance zones you will just have to wait for the signal to appear. Take the trade. For Binary Options it is advisable to set the expiry time to 5-15 min in M1 chart. THIS INDICATOR IS ZERO REPAINT
Best assets to trade: - EUR
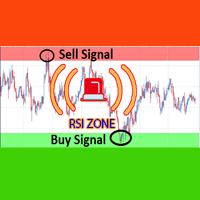
Over BS RSI Zone Alarm is an oscillator indicator which based on RSI oversold/overbought indicator.
It'll alert signal on next bar open with an audio or pop up on the chart
When RSI above 70 that the signal oversold alert.
And RSI below 30 that the signal overbought alert.
The indicator can customize Level of Relative Strength Index. Messages/Sounds (Notifications and sound settings) RSI_Period - Period of Relative Strength Index.
Level_Overbought_Zone - Level of Relative Strength Index for Ove
Highly configurable Williams %R indicator. Features: Highly customizable alert functions (at levels, crosses, direction changes via email, push, sound, popup) Multi timeframe ability Color customization (at levels, crosses, direction changes) Linear interpolation and histogram mode options Works on strategy tester in multi timeframe mode (at weekend without ticks also) Adjustable Levels Parameters:
Williams %R Timeframe: You can set the current or a higher timeframes for Williams %R. Williams
FREE

The End Point indicator is an indicator that predicts that the tired trend should now return. In this indicator law, we can easily understand that the trend which is in constant or continuous decline should now be reversed. to With these signals the user starts the trades.
Our Popular Products Super Oscillator HC Cross Signal Super Cross Trend Strong Trend Super Signal Suggestions Recommended time interval: M30, H1 Run with at least 20 pairs. Operate with a maximum of two pairs. For every coupl
FREE
Алгоритм индикатора строит уровни поддержки и сопротивления. На основе этих уровней индикатор ищет ложный пробой одного из уровней. Если условие выполнено индикатор ждет возврат в зону ложного пробоя. Если возврат произошел - индикатор выдает сигнал. Индикатор не перерисовывается. Встроен звуковой сигнал. Доступна информационная панель о торговле. Есть возможность автоматически вычислять уровни Stop Loss и Take Profit. Входные параметры Set Interval Draw Arrow - интервал уровней поддержки и сопр

The Trend Confirm indicator is a set of indicators and a set of channel movements. The purpose of the indicator is to find a healthy trend and designed to confirm these trends. There are two channels in the trend. The blue channel line is used to confirm the ascending trend. The green trend line is used to confirm the downtrend.
How to use? If the trend line in the indicator goes above the blue channel line, the trend is starting to rise. If the trend line within the indicator falls below the g

PRO VERSION This free indicator change timeframe of charts(up to 3) at the same time,by clicking a label. If you click the label(shown below),timeframe of charts will change. If you click again,timeframe of charts restore.
You can change the position of the label.
You can change charts up to 3 charts(a paid version enables up to15 charts). You can add second,third timeframe changer label.
This indicator is very useful for speed trading.
There is a more powerful PRO VERSION . The paid versio
FREE

This indicator change timeframe of charts(up to 15) at the same time,by clicking a label. If you click the label(shown below),timeframe of charts will change. If you click again,timeframe of charts restore.
You can change the position of the label.
You can change charts up to 15 charts. You can add second,third timeframe changer label.
This indicator is very useful for speed trading.
*This indicator don't work propery in strategy tester.Use Free version to know the real potential.
Input Par
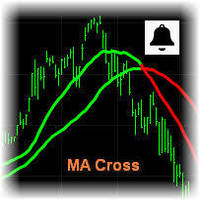
MA Cross Signal Alerts_v1.0 The Moving Average Cross displays a fast and a slow moving average (MA). A signal arrow is shown when the two MAs cross. An up arrow is displayed if the fast MA crosses above the slow MA and a down arrow is given if the fast MA crosses below the slow MA. The user may change the inputs (close), methods (EMA) and period lengths.
When two Moving Averages cross the indicator will alert once per cross between crosses and mark the cross point with down or up arrow.
Ale
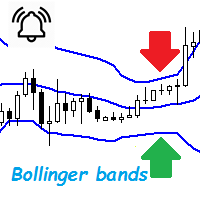
Bollinger Bands are a very common indicator in the world of online trading, this indicator gives very useful information for many forex trading strategies, but also for all other styles of strategies such as scalping and even trading medium and long term. It is calculated from a moving average calculated over n periods (20 by default). From this moving average, a standard deviation calculation is defined. By adding this standard deviation in real time to the basic moving average, we obtain the u

The Sensitive Volume indicator is an indicator designed to generate trading signals. The purpose of this indicator is to generate signals from the highest probability of trading. Using a number of price movements and a set of indicator properties to generate these signals.
Easy to use, simple and understandable to the user. With alert features, user signals can be reached quickly. Visually the user can easily recognize the signals. This indicator will not repaint. Parameters Trend_Period - pe
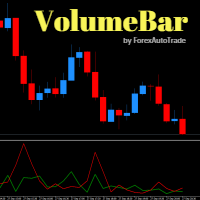
VolumeBar Hola Traders. This indicator will show line graph of each bar's volume. Indicates the volume of purchases and sales of each bar's volume. You can use this indicator with every currency pairs and every time frame. The display parameters are color customizable.
Original Parameters: ColorGreen - buy volume. ColorRed - sell volume.
Thanks Traders
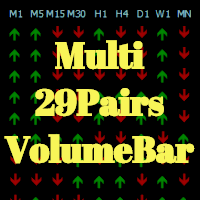
Hola Traders. This indicator Developed from VolumeBar indicator. By the signal show from the last bar complete. Show 9 time frame and 29 pairs currency. XAU,USD,EUR,GBP,AUD,NZD,CAD,CHF,JPY
The display parameters are color customizable. Original Parameters: ColorGreen - buy signal. ColorRed - sell signal. Font29PairsColor - color of font 29 pairs currency.
Thanks Traders

Oscillator Trend indicator macd, divergence and a set of algorithms is a trend indicator. The aim of the indicator is to generate signals with high reliability using the above-mentioned calculations.
The indicator is very easy to use. Red arrows give sale signal. The Aqua arrows give a buy signal. Thanks to the alert feature, you can easily reach the signals. It works without any setting. It can be used in all time frames. The recommended time frames are m15, m30 and h1.
Parameters Trendlines

The MESA Spectrum indicator calculates the power spectrum of a data series using the Maximum Entropy Spectrum Estimation method and produces a power spectrum plot. The Maximum Entropy algorithm, unlike a simple FFT transform, will include frequencies from the entire complex frequency plane and not just the Nyquist interval which, in general terms, means that it can resolve cycle periods that are larger than the data window passed to the function. In addition, MESA has the ability to fit very sha
Version 1.05 - added option to use mouse to set the Data Offset (anchor). Just hold down your SHIFT key, then double-click anywhere on the chart, then release the SHIFT key and the anchor will be set to the bar nearest to your double-click.
Version 1.04 - added fix for demo mode (i.e., operation in Strategy Tester). Use Open Prices Only and check Use Date (select a date range)
The MESA Cycles indicator calculates the power spectrum of a data series using the Maximum Entropy Spectrum Estimation m

The CCI Standard/Hidden Divergence indicator will plot the Commodity Channel Index (CCI), and will also identify and plot standard (regular) divergences between the indicator and the price action, OR it can be set to identify and plot hidden (reverse) divergences between the indicator and the price action. The divergences themselves are implemented as lines (default green for bullish divergence and red for bearish divergence) drawn in the indicator pane. If activated via the Inputs dialog, alert

BeST_Visual MAs Signal Generator MT4 Indicator is a very useful Visual Tool that can display in the Chart all ENTRY signals (BUY and SELL) and also any corresponding EXIT signal, based on a total of 12, common but also different trading strategies, in which the Entry and Exit Signals are derived exclusively by using Moving Averages (MAs). The two main groups of MAs Strategies included in this tool are: A) Crossover Signals This group includes 4 different strategies (A1-A4), where Entry and Exi

This indicator displays super power trend movement. Features Multiplier - displays multiplier movement.
Multiplier2 - displays multiplier2 movement. Trend - displays indicator trend 1 and trend 2 (true/false). separate_windor - displays trend separate window.(0-1....)
X - move the trend left and right.
Y - move the trend up and down. How to understand the status: If the Trend color is green, trend is up. If the Trend color is red, trend is down.

The MACD Standard/Hidden Divergence indicator will plot the MACD, and will also identify and plot standard (regular) divergences between the indicator and the price action, OR it can be set to identify and plot hidden (reverse) divergences between the indicator and the price action. The divergences themselves are implemented as lines (default green for bullish divergence and red for bearish divergence) drawn in the indicator pane. If activated via the Inputs dialog, alerts will be generated when

The RSI Standard/Hidden Divergence indicator will plot the Relative Strength Index (RSI), and will also identify and plot standard (regular) divergences between the indicator and the price action, OR it can be set to identify and plot hidden (reverse) divergences between the indicator and the price action. The divergences themselves are implemented as lines (default green for bullish divergence and red for bearish divergence) drawn in the indicator pane. If activated via the Inputs dialog, alert

The Momentum Standard/Hidden Divergence indicator will plot the momentum, and will also identify and plot standard (regular) divergences between the indicator and the price action, OR it can be set to identify and plot hidden (reverse) divergences between the indicator and the price action. The divergences themselves are implemented as lines (default green for bullish divergence and red for bearish divergence) drawn in the indicator pane. If activated via the Inputs dialog, alerts will be genera

The Stochastic Standard/Hidden Divergence indicator will plot the stochastic (%K and %D), and will also identify and plot standard (regular) divergences between the indicator and the price action, OR it can be set to identify and plot hidden (reverse) divergences between the indicator and the price action. The divergences themselves are implemented as lines (default green for bullish divergence and red for bearish divergence) drawn in the indicator pane. If activated via the Inputs dialog, alert

Ultimate solution on price action trade system Built Inside One Tool! Our smart algorithm tool will detect the price action pattern and alert upon potential with entry signals and exit levels including stoploss and takeprofit levels based on the time setting on each market session. This tool will also filters out market currency strength to ensure our entry are in a good currency conditions based on it's trend.
Benefit You Get
Easy, visual and effective price action detection. Gives you the a

Hrumer Alpha - ein grundlegend neuer Devisenindikator, der auf dem Algorithmus der Verfolgung der Spitzenwerte des Preises basiert. Das ist nicht ZigZag und nicht Fraclals und hat trotz der visuellen Ähnlichkeit nichts mit diesen Indikatoren zu tun. Es zeichnet seine Werte nicht neu und arbeitet mit dem Null-Balken, also mit Open [0]. Er reagiert schnell auf Preisänderungen und informiert den Händler über die Stornierungen. Funktioniert auf allen Währungspaaren und Zeitrahmen. Sie können für lan

Channels + S & R Indicator (CSRI)
Indicator draws 3 channels (Large, Medium, Small) within bars’ range of current timeframe and pair / instrument. It can identify Support and Resistance levels within any chosen channel. Additionally Fibonacci levels can be drawn for Large Channel. All lines and levels can be customized by color and width.
Identify Support and Resistance Levels for any Channel:
IdentifySupportAndResistanceLevels - Identify Support and Resistance Levels IdentifySRforChannel – Ide

Welcome all to the famous Gann's "Square Of 9"!! This method was used by one of the best traders in the history, a person who made his way among the top traders. An "Holy Grail" for whoever wants to learn trading. The "Square of 9" was used by this genius to find the market's future supports and future resistances. Nowadays is possible to find them with just a click, thanks to softwares. At the time Gann was using just his set of square and goniometer!! Gann describes, partially, the tecnique on

The "Lines Channel Pro" indicator determines price reversals from the High/Low channel. Contains a built-in trend finder, signal lines, entry and exit points.
The recommended timeframe for M15 to work is D1.
For each timeframe and trading instrument, depending on the volatility, it is necessary to select individual settings.
Does not redraw calculations.
Input parameters
Use Channel trend filter - Turn on/off the trend filter Channel trend period - Trend filter period (from 8 and above) Line

Price action is among the most popular trading concepts. A trader who knows how to use price action the right way can often improve his performance and his way of looking at charts significantly. However, there are still a lot of misunderstandings and half-truths circulating that confuse traders and set them up for failure. Using PA Trend Reversal will be possible to identify high probability exhaustion moves of a trend. ️ AVOID NEWS AND SPEECHES - most of the bad signals are during the news/sp
MetaTrader Market bietet jedem Entwickler eine einfache und bequeme Plattform für den Verkauf von Programmen.
Wir unterstützen Sie bei der Veröffentlichung des Produkts und beraten Sie gerne, wie man eine Beschreibung für den Market vorbereitet. Alle Produkte, die im Market verkauft werden, sind durch eine zusätzliche Verschlüsselung geschützt und können nur auf dem Rechner des Kunden gestartet werden. Illegales Kopieren ist ausgeschlossen.
Sie verpassen Handelsmöglichkeiten:
- Freie Handelsapplikationen
- Über 8.000 Signale zum Kopieren
- Wirtschaftsnachrichten für die Lage an den Finanzmärkte
Registrierung
Einloggen
Wenn Sie kein Benutzerkonto haben, registrieren Sie sich
Erlauben Sie die Verwendung von Cookies, um sich auf der Website MQL5.com anzumelden.
Bitte aktivieren Sie die notwendige Einstellung in Ihrem Browser, da Sie sich sonst nicht einloggen können.