Neue technische Indikatoren für den MetaTrader 4 - 90
This indicator allows to hide MACD oscillator (on all MT4 timeframes) from a date define by the user, with a vertical line (Alone) or a panel (with "Hidden Candles"). Indicator Inputs: Fast EMA Period Slow EMA Period Signal SMA Period Apply To Information on "MACD" indicator is available here: https://www.metatrader4.com/en/trading-platform/help/analytics/tech_indicators/macd ************************************************************* Hey traders!! Give me your feeds! We are a community h
FREE
This indicator allows to hide Parabolic SAR (on all MT4 timeframes) from a date define by the user, with a vertical line (Alone) or a panel (with "Hidden Candles"). Indicator Inputs: Step Maximum Color Width Information on "Parabolic SAR" indicator is available here: https://www.metatrader4.com/en/trading-platform/help/analytics/tech_indicators/parabolic ************************************************************* Hey traders!! Give me your feeds! We are a community here and we have the sa
FREE

Add indicator "Symbol Name Drawer " on chart. Indicator creates text object with name of current symbol.
You can change symbols on chart and indicator automatically changes text.
Free to use. Simple tool.
If you have any suggestion you can write me about it in comments. I try to improve this tool in future versions. Thanks for using my indicator. If you want to order something special in mql4 or mql5 message.
FREE
This indicator allows to hide Bill Williams Fractals (on all MT4 timeframes) from a date define by the user with a vertical line (Alone) or a panel (with "Hidden Candles"). Indicator Inputs: Indicator Color Indicator Width Information on "Fractals" indicator is available here: https://www.metatrader4.com/en/trading-platform/help/analytics/tech_indicators/fractals ************************************************************* Hey traders!! Give me your feeds! We are a community here and we hav
FREE
This indicator allows to hide RSI (on all MT4 timeframes) from a date define by the user with a vertical line (Alone) or a panel (with "Hidden Candles" utility). Indicator Inputs: Period Apply To Information on "Relative Strength Index" indicator is available here: https://www.metatrader4.com/en/trading-platform/help/analytics/tech_indicators/relative_strength_index ************************************************************* Hey traders!! Give me your feeds! We are a community here and we
FREE
This indicator allows to hide CCI oscillator (on all MT4 timeframes) from a date define by the user, with a vertical line (Alone) or a panel (with "Hidden Candles"). Indicator Inputs: Period Apply To Information on "Commodity Channel Index" indicator is available here: https://www.metatrader4.com/en/trading-platform/help/analytics/tech_indicators/commodity_channel_index ************************************************************* Hey traders!! Give me your feeds! We are a community here and
FREE
This indicator allows to hide ATR oscillator (on all MT4 timeframes) from a date define by the user, with a vertical line (Alone) or a panel (with "Hidden Candles"). Indicator Inputs: Period Information on "Average True Range" indicator is available here: https://www.metatrader4.com/en/trading-platform/help/analytics/tech_indicators/average_true_range ************************************************************* Hey traders!! Give me your feeds! We are a community here and we have the same
FREE
This indicator allows to hide Stochastic oscillator (on all MT4 timeframes) from a date define by the user, with a vertical line (Alone) or a panel (with "Hidden Candles"). Indicator Inputs: % K Period % D Period Slowing Apply To Method Information on "Stochastic Oscillator" indicator is available here: https://www.metatrader4.com/en/trading-platform/help/analytics/tech_indicators/stochastic_oscillator ************************************************************* Hey traders!! Give me your
FREE
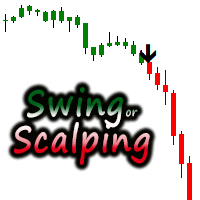
Coloured price charts, generating black arrows. User can change the colours of the arrows in the colour section of the indicator. It is consider a great scalping tool on lower time-frames, while higher time frames will have fewer opportunities but trades will possibly last longer. There is an input for Alert on or off. This can be used effectively on M15/M30 Chart until up to H4 chart time. It is best if the user has some experience with money management, utilising trailing stop to protect

Profit Chaser is based on Parabolic SAR indicator. This indicator give an edge by pointing the direction an asset is moving, as well as providing entry and exit points. NOTE: The EA version of this indicator will be available soon. It will automatically open and close trades for you, it will also allow you to insert your preferred inputs such as Lot size; Take profit; Stop loss; Trailing stop; Break even etc. HOW TO USE: Sell Signal; Place a Sell trade when the indicator arrow points down. Clos

The "MACD Trend Follower" is an indicator based on the MACD oscillator. It serves to spot the trend direction by giving it a fixed color until the trend changes (the trend direction colors are customizable). The default MACD settings for the indicator has been changed to adapt to the fast moving Forex market, but they can be changed to suit the trader.
Recommended settings for the indicator : - MACD Fast EMA : 8 Periods. - MACD Slow EMA : 13 Periods. - MACD SMA : 5 Periods.
Indicator inputs
FREE
"The trend is your friend, until the end when it bends". The "Hexa MA" custom indicator is a trend following indicator. It uses 6 Moving Averages to spot the trend and follow, and also to filter the bad signals for the fast Moving Averages. The basic is simple, yet the strategy is powerful.
Recommended settings for the indicator : - Moving Average periods : SMA 5, SMA 10, SMA 20, SMA 50, SMA 100, SMA 200. - Timeframe : M15 is the default. But any timeframe can be used. - Currency pair : Since
FREE
The "MACD Swing" custom indicator is based on the MACD oscillator with custom settings and an algorithm that both serves to generate signals of buy or sell depending on the market status. It also sends alerts (window alert, email alert, push notification alert) whenever a buy/sell signal occurs, and the alerts are customizable (they can be turned ON or OFF).
Indicator inputs : - Signal arrow size : buy/sell signal arrow size (between 1 and 5). - Signal arrow distance from the candle : buy/sell

The HTF Stochastic displays Stochastic oscillator from a higher time frame. For example: You can see D1 Stochastic on a M30 chart. It has all parameters available like a normal Stochastic. The HTF Stochastic is visible for all time frames below the one you setup. So if you choose H4 period you can see Stochastic oscillator from that time frame on H1, M30, M15, M5 and M1 chart. For M30 setup, you can have M30 Stochastic on M15, M5 and M1 chart.

Targets is an indicator to determine potential turning points , targets are calculated to determine levels in which the sentiment of the market could change from "bullish" to "bearish." This indicator can be used in any timeframe and any currency pair: IN CASE YOU DON'T SEE THE INDICATOR WHEN YOU ADD IT TO YOUR CHARTS JUST OPEN THE INDICATOR MENU AND CLOSE THE MENU AGAIN PLEASE TAKE NOTICE: For best results use this indicator as an extra tools after you have completed your regular analysis an
FREE
This indicator allows to hide moving average (on all MT4 timeframes) from a date define by the user with a vertical line (Alone) or a panel (with "Hidden Candles"). Indicator Inputs: MA Period MA Shift MA Method MA Apply To Information on "Moving Average" indicator is available here: https://www.metatrader4.com/en/trading-platform/help/analytics/tech_indicators/moving_average ************************************************************* Hey traders!! Give me your feeds! We are a community h
FREE

Limitless Lite follow trend. Color change trend changed.
Works in EURUSD/GBPUSD/XAUUSD/US500/USDCAD/JP225/USDTRY/USDMXN and all pairs
Best timeframes 1H/4H/DAILY
Signal on close of a bar.
DOES NOT repaint. DOES NOT repaint. DOES NOT repaint. DOES NOT repaint.
DOES NOT recalculate. DOES NOT recalculate. DOES NOT recalculate. DOES NOT recalculate NOTE : TREND CHANGED FOLLOW ARROW
Settings : No Settings, change color

Trend Bar Balance Indicator Simple indicator based on trend detection and support resistance breakage It detects the major trend and the minor support and resistance levels *** a signal for UP /BUY is detected and alerted in a BULL trend and a resistance level break *** a signal for DOWN /SELL is detected and alerted in a Bear trend and a support level break THE POWER OF THIS INDICATOR I USE IT WHEN YOU COMBINE ITS DAILY SIGNALS FROM DIFFERENT CHART SYMBOLS AT SAME TIME AND CLOSE ALL ORDERS BY
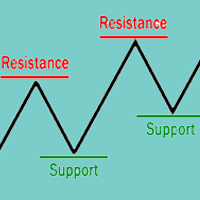
The concepts of support and resistance are undoubtedly two of the most highly discussed attributes of technical analysis and they are often regarded as a subject that is complex by those who are just learning to trade. This article will attempt to clarify the complexity surrounding these concepts by focusing on the basics of what traders need to know. You'll learn that these terms are used by traders to refer to price levels on charts that tend to act as barriers from preventing the price of an

From the data of some candles we calculate the price direction. In more than 90% of cases, the indicator indicates correctly. Arrows indicate, that you can open a long or short order. If you use it for trading, pay attention to money management!
There are no parameters to set. Only drug and drop this indicator on chart and enjoy! It is a very simply indicator.
Only used on EUR/USD H1 timeframe!

https://youtu.be/t3SLLgcEEPM This indicator prepared by using Moving Averages, Bollingers Bands . This system can be used for 5M time frame and Gold Symbols (XAUUSD). This system is for Long term and profitable. Signals are shown as arrows. as an optional, you can set a voice alarm or email notification You can fins our other products from link : https://www.mql5.com/en/users/drbastem/seller Also, you can ask all your questins from email : haskayafx@gmail.com or mobile : +90

Greasy scalper is an indicator for scalping. Shows in which direction now with a high probability there will be a price movement. This may be a movement of several points, or several tens of points. But most likely this movement will happen with a high degree of probability. And the larger the timeframe, the greater the likelihood that the price will go in the direction of the arrow. Knowing this information, we can use it for profit. We can open short trades in the direction of the arrow. As s
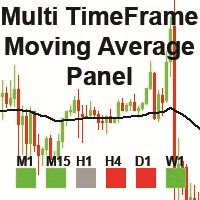
The "MTF Moving Average Panel" indicator is more of a helping tool than an indicator, it serves to help traders to spot the trend direction without having to change the timeframe and check all timeframes. It is best used with other indicators and signals, to help filter the signals according the trend based on multiple timeframes.
Indicator inputs : - Moving Average period : The period for the Moving Average. Default is set to 50 periods. - Moving Average method : The method of calculation of
FREE
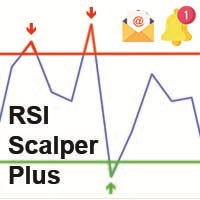
The RSI Scalper Plus is an indicator based on the RSI oscillator with an algorithm that filters bad signals. The RSI is basically based on the Overbought and Oversold zones. The indicator generates BUY & SELL signals with arrows showing when to buy and when to sell. Signals can be set in the input menu : - An alert window : TRUE to show the alert windows, FALSE to hide it. - Push Notification : TRUE to send a push notification to mobile phone connected to the MT4, FALSE is default. - Email Notif
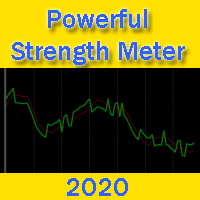
Powerful Strength Meter - a trend direction indicator. The indicator measures the strength of the trend and shows the trader signals in the form of two lines: red and green. Indicator signals are very easy to read. If the green line crosses the red line up - this is a buy signal. This means that now the price will go up. If the green line crosses the red line from top to bottom - this is a sell signal. The larger the time frame, the more accurate the indicator signals. You can also, for example

Traders can use the Trends Histogram indicator to identify potential areas of profit taking in the next section of an uptrend or downtrend. So it is for direct entry into the market.
The indicator is used in the same way as any of these indicators individually or in combination with other indicators. This indicator shows an uptrend and a downtrend (green histogram).
Only one input parameter is available: Length. It affects the scale of indicator price coverage. Installed input parameters ca

In the age of speed, everyone wants to gets what he/she wants quickly. Trading is all about gaining money, and scalping is a way of doing it in a short time. The "Scorpion Scalper Pro" has been named on the scorpion because of its speed. The indicator serves to provide signals for the M15 timeframe. It also sends Alerts (window alert, email alert, push notification alert) whenever a buy/sell signal occurs, and the alerts are customizable (they can be turned ON or OFF).
Indicator inputs : - Buy
What makes the "Oil Formula" custom indicator special, is that it is not based on indicators, but on an algorithm that predicts to the best possibility of the price direction. The signals given by the indicator can be filtered using one of the built-in MetaTrader 4 indicators, or other strategies for optimal results. It also sends Alerts (window alert, email alert, push notification alert) whenever a buy/sell signal occurs, and the alerts are customizable (they can be turned ON or OFF).
Indica
Level high low Pro. the indicator is based on the trading system developed by forex trading experts; this indicator is based entirely on it.
it perfectly determines the highs and lows of the price
great for picking strategies
also knows how to work and trend
works great on binary options for binocular ...
Options worth making a deal for 1-3 candles. its advantages: You can choose absolutely any tool. no need to heap a lively chart with various indicators that contradict each other, or
MT5 Version Available Here: Coming soon...
Telegram Channel & Group : https://t.me/bluedigitsfx
V.I.P Group Access: Send Payment Proof of any of our Paid Products to our Inbox
Recommended Broker: https://eb4.app/BDFXOsprey * The Most User Friendly Symbol Changer on Metatrader ! Features
Change Timeframes in 1 click of a button on 1 chart. Change Between All Currency Pairs in 1 Click of a button on 1 chart. Ability to Turn Boxes to Current Candle Colors. Easily Identify the Trend f
FREE

Some informations on the chart with the single attachment. RangeBorder Buy Sell (RBBS) Non Repaint Indicator will provide trend line, buy sell arrows,reversal arrows, range channel, order exit area,high average price line and low average price line.All arrows and lines don't repaint and not lagging. Once candle closed it won't repaint. Reading Indicator:
1. Small Stars , Indicates oversold and overbought with certain logic and price may reverse when this small star triggers. Useful to identif

This indicator prepared by using Haskayafx Target Line Indicators . This system can be used for 30M time frame and All Symbols. This system is for Long term and profitable. Signals are shown as arrows. as an optional, you can set a voice alarm or email notification You can fins our other products from link : https://www.mql5.com/en/users/drbastem/seller Also, you can ask all your questins from email : haskayafx@gmail.com or mobile : +90 530 867 5076 or @MehmetBastem

This indicator calculates average speed of moving average indicator. Here is parameters: BarsToProcess - indicator calculating period; MaPeriod - period of Moving Average indicator; AveragingPeriod - period (MA values) of the basis of which the average value is calculated; MA_Method, MA_Apply_to - using to set MA indicator parameters; Thats all! Good luck.
FREE
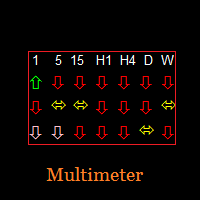

THE GOAT INDICATOR ON THE MQL5 MARKET! ️ GET THIS INDICATOR AND STOP LOOKING FOR ANOTHER INDICATOR ️ ️ GET IT NOW BEFORE PRICE INCREASE! ️
SPECIAL DISCOUNT FROM 138$ -> NOW ONLY 88$!!! 2020 Breakthrough Indicator! Imagine that indicators can move the price/market!
This indicator use for predict price movement! Using special algorithm for predicting the next price movement! This indicator can be used in any timeframes and any symbols! You can use it for binary option signal

This is Free product you are welcome to use for your needs! Also I very appreciate your positive feedbacks! Thanks a lot! // More great Expert Advisors and Indicators are available here: https://www.mql5.com/en/users/def1380/seller // Also you are welcome to join to profitable , stable and reliable signal https://www.mql5.com/en/signals/1887493 Forex Indicator: Heiken Ashi Candles for MT4. No Repaint. Heiken_Ashi_Candles has great combination with Trend Line MA indicator https://
FREE
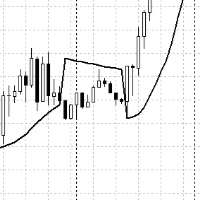
Der übliche Indikator ist Parabolic_Sar, aber er wird auf dem Chart nicht durch Punkte, sondern durch eine Linie angezeigt. Aufgrund dessen gibt es einen Unterschied in den Signalen, was sich sowohl positiv als auch negativ auswirken kann. In jedem Fall gilt: Je mehr Filter, desto klarer erscheint das Bild des Marktes. In dieser Anzeige wird auch ein Audiosignal ausgegeben, wenn sich die Parabelbiegung ändert und SAR-Kerzen auftreten.
ZZFLET zeichnet eine Ebene auf die Karte, 10 min / max. Zickzack nach den ersten 3 können Sie die Farbe des Textes, die Farbe der Linien, die Schriftgröße und die Stärke der Linien ändern, die die Ebene selbst begrenzen. Der Indikator eignet sich hauptsächlich als flacher Indikator für kleinere TFs, für größere ist er ein Indikator für Unterstützungs- und Widerstandslinien. Das Rendern erfolgt nach dem üblichen Zick-Zack-Prinzip, das bei Bedarf dem Diagramm hinzugefügt werden sollte.

Eine weitere Version von ZigZag mit zusätzlichen Filtern zum Zeichnen und Auffinden von Gipfeln und Tiefebenen. Gut geeignet für den manuellen Handel, können Sie diese Peaks und Lowlands auch als Berater verwenden und berechnen. Auch bleiben alle Funktionen des ursprünglichen ZigZag erhalten. Zusätzliche Filter sind AO und Stochastic. Funktioniert auf allen Instrumenten und Zeitrahmen.

This indicator displays the wave structure of the market in the form several wave levels nested in each other. For each of these levels an automatic preliminary (draft) marking of waves in Elliott's style (123..., ABC... etc.) is created. This markup is completely automatic and absolutely univocal. The indicator is especially useful for beginner wave analysts, because among all the possible versions for wave marking, it allows you to immediately take the most adequate version as a ba

Oszillator basierend auf Datenkonvergenz zwischen Volumen und Liquidität. Es wird empfohlen, es paarweise mit hohem Volumen und hoher Liquidität zu verwenden, z. B. EURUSD. Vorzugsweise in TF 4H oder höher. Wie benutzt man:
Wenn die Linien in OVERPURCHASE konvergieren und sich kreuzen, wird empfohlen, zu verkaufen. Wenn die Linien in SURVEY konvergieren und sich kreuzen, wird der Kauf empfohlen.
Bei Fragen stehe ich Ihnen gerne per Chat zur Verfügung. Wenn Sie es für eine Fälschung halten o

The Mono Waves indicator is designed to display the wave behavior of the market on a chart. Its appearance is presented on slide 1. This indicator uses the PPPC (Point-Percent Price Channel) indicator, which can be downloaded for free from the Market . When the market moves up, the upper border of the price channel is built on High candlestick prices (for more details, see the description of the PPPC indicator at the link given above). The higher the High prices rise, t
FREE

WOLFE WAVE PATTERNs First discovered by Bille Wolfe . The wolfe wave is a 5 wave price action pattern that is formed by supply and demand in a market and the fight to reach equilibrium in the market . The entry spot of the pattern is defined by the breakout of the trend created by wave 1 and wave 3 . This pattern forms in any market where there is supply and demand thus it can also be used to trade commodities and stocks. Wolfe Waves are reversal patterns that usually carry a low risk margin. P

Определения текущей тенденции одна из самых важных задач трейдера не зависимо от стиля торговли. Индикатор Price Detect поможет с достаточно высокой вероятностью это сделать. Price Detect - индикатор распознавания тенденции, использующий авторский алгоритм расчета. Показания индикатора не изменяются не при каких условиях. Также с помощью индикатора можно наблюдать за коррекцией цены в сторону глобального тренда, определять возможные границы окончания отката. Индикатор подходит для любой валютн

Ska ZigZag Line indicator determines the overbought and oversold regions within a trend. The indicator determines the overbought region by the candlestick high and the oversold region by the candlestick low in a form of a line. To utilize the full strategy i recommend using "Ska ZigZag Line" together with "Ska ZigZag BuySell". NOTE: This indicator is a line based indicator. HOW TO USE: Sell Signal; Place a sell trade when the Ska ZigZag BuySell indicator arrow appear on top of the Ska ZigZag Lin
FREE

The dollar index is a reliable guide for all currency pairs with the participation of the dollar USD. The indicator helps to filter out false reversals and trade strictly according to the trend. Determines the current direction of the dollar index and the trend change point. It warns with an arrow on the chart and an alert about a trend change. Ready to work with default settings. It is possible to adjust the sensitivity of the trend line. Important
It is strongly discouraged to open a trading

Ska ZigZag BuySell indicator determines the overbought and oversold regions within a trend. The indicator determines the overbought region by the candlestick high and the oversold region by the candlestick low. This indicator only gives signals with arrow and audible alerts each and every time when a new candlestick appear. To utilize the full strategy i recommend using "Ska ZigZag BuySell" together with "Ska ZigZag Line". The Ska ZigZag Line indicator is available for free. NOTE: Indicator is h

Strong Retracement Points Pro demo edition! SRP (Strong Retracement/Reversal Points) is a powerful and unique support and resistance indicator. It displays the closest important levels which we expect the price retracement/reversal! If all level are broken from one side, it recalculates and draws new support and resistance levels, so the levels might be valid for several days depending on the market! If you are still hesitating to start using this wonderful tool, you can check this link to see h

This indicator is produced from the value of two different moving averages calculated with a special formula and the moving average of this value. * This is not just an crossover of two moving averages. You can use this indicator on all time frames, but it is useful for M5 time frame with default parameters. Silver colored line shows the trend; if it is crossing up to zero line trend probably starting at the up direction. You can use crossover silver and red lines to the opposite direction of

SMOOTH STRENGTH METER INDICATOR (SMOOTH LINE) it draws Currencies TREND Volatility Power / Strength lines : - Detects the 2 highly TRENDED Volatile pairs ( will be the Bold Lines ) - A very Helpful Indicator - It draws smooth lines for up to 20 currencies pairs representing Volatility strength and power - First it indicates the most powerful trended direction pairs : Strongest / Weaker - MAIN FUNCTION :it gives indication of the UP trend most Volatile Line and the DOWN
In finance , volatility (symbol σ) is the degree of variation of a trading price series over time as measured by the standard deviation of logarithmic returns . Historic volatility measures a time series of past market prices. Implied volatility looks forward in time, being derived from the market price of a market-traded derivative (in particular, an option). In 2000 Yang-Zhang created a volatility measure that handles both opening jumps and drift. It is the sum of the overnight volatilit

FxF is an indicator and shows the possible direction of the trend in the selected time period. If "Lime" line is greater than zero trend is uptrend and "Red" line lower than zero the trend is downtrend in the selected timeframe. You can change bar period and price type on the control panel easily. It can be used for all currencies and time frames. Default settings are: BarPeriod=30, PriceType=MedianPrice.
This indicator shows you reversal levels for trade. You can also use it as an exit indicator for your regular trades. It is useful if you use this indicator on H4 charts. There is no input parameters. It is using price actions to generate reversal levels. test it with your regular trade systems and see the difference It can be use multi time frames and multi currencies.

Indicator that indicate where the best point of reverse market.This indicator is a reactive or lagging signal, because the strategy uses a formation of an odd number of bars being the middle bar the highest or lowest in the formation, and the indicator draws when the all bars in the fractal close. However, traders with a pre-existing directional bias will find this indicator extremely useful, picking up early entry points.This indicator is not a boiled-down signals indicator nor a complete tradi
MultiCharts ist ein Mehrwährungsindikator zur visuellen Analyse mehrerer Handelsinstrumente erstellt Diagramme der ausgewählten Instrumente in einem separaten Fenster
zeigt die Ebenen aller etablierten Orders an zeigt die Ebenen aller aufgegebenen Bestellungen an
erstellt technische Indikatoren für gleitende Durchschnitts, Trendfilter und Heiken Ashi-Diagramme
zeigt den Spread, OHLC - Preise des aktuellen Balkens
zeigt die relative Preisänderung für den aktuellen Tag *
* - Für Zeiträume bis
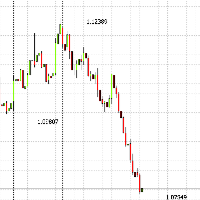
Zickzack mit der Signatur der letzten drei Extreme, 1., 2. und 3., der Zickzack-Indikator selbst sollte bei Bedarf zusätzlich zum Chart hinzugefügt werden, da Sie darauf verzichten können. Es funktioniert auf allen Instrumenten und Zeitrahmen. Besonders bei großen TFs ist es nützlich, die letzten 3 Kurse sofort zu sehen und das Diagramm nicht mit unnötigen Indikatoren und Linien zu überladen. Sie können - Farbe, Schriftgröße und Position relativ zum Anhang des Preises des Diagramms ändern Dam
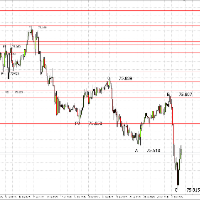
Dieser Indikator zeigt die letzten 4 Zickzack-Extrema an und bezeichnet sie als 0, A, B, C mit der Preisunterschrift. Es funktioniert auf jedem Handelsinstrument. Sie können die Größe, Farbe des Texts und die Position des Texts im Verhältnis zu den Höchstpreisen ändern. Sie können auch die Zick-Zack-Einstellungen selbst ändern. ZIgZag selbst zum Zeichnen von Linien muss zusätzlich mit dem Plan verbunden werden. Damit der letzte Wert immer das letzte Maximum / Minute des Zickzacks anzeigt, setzen

Note : The slow loading of the indicator issue has been addressed . This new version loads fast and does not slow the platform.
Version 1.3 : We have updated the indicator to include an historical bar scanning option . So instead of scanning all bars in the history (which can make the indicator slow sometimes ) , you can select the maximum number of bars it can scan which can increase the performance and make the indicator faster.
This indicator scans the 1-3 Trendline pattern . The indic
Unique trend trading algorithm with advanced filtering and many features which should become a part of your trading arsenal. This indicator can give you also trading advisors (with take profit target), success rate scanner and much more.
Important information
For additional detailed information you can visit the 747Developments website.
Features Easy to use (just drag and drop to the chart) Possible to use with any trading instrument Possible to use on any time-frame Take profit advisors S

The Point-Percent Price Channel (PPPC or PP Price Channel) indicator is designed to display on the chart a channel whose width is specified both as a percentage of the current price and in points. Its appearance is presented on slide 1. When the market moves up, the upper border of the channel is built at the price of High candles. In this case, the lower boundary follows the upper one at a strictly specified distance. When the price touches the lower border of the channe
FREE

BeST_Profit Taker Exits is a Metatrader Indicator based on the corresponding vital part of Jim Berg's Trading System.It timely locates the most likely points/bars of significant Profit Taking and can be easily used as an add-on to any Trading System/Method . The Indicator consists of 2 Take Profit lines deriving as (MA ± times the ATR) usually the upper one above the prices (for Long Trades) and the lower one below prices (for Short Trades). When the Close (or High by choice) of a bar is above

Calculated trend indicator, can be used with an optimal risk to profit ratio, shows successful signals. Uses two options for settings. Shows favorable moments for entering the market with arrows. The probability of a successful trend is not very bad! The indicator can be used both for pipsing on small periods, and for long-term trading. The indicator does not redraw and does not lag. It works on all currency pairs and on all timeframes.
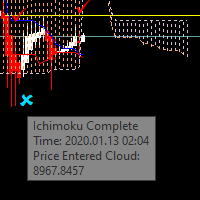
Have you ever tried to trade with the Ichimoku indicator only to wonder whether to stay in or close the trade? You will now know precisely what price is doing so you can choose your strategy. There are many different ways to trade Ichimoku and I'm confident you will find your strategies much easier to implement with the Ichimoku Complete. A bonus is that the parameters are fully adjustable for those trainers who ask you to change the values of the indicator. In this way you can use one strat

Th3Eng Panda trend is a powerful indicator that works perfectly for scalping trades as well as swing trades. Th3Eng Panda trend is not just an indicator, but a very good trend filter. You can setup it on H4/H1 to Find the main trend and start scalping on M5/m15/m30 Time Frames. Works with all pairs and all Time Frames.
Inputs:
Section #1 History : Maximum number or bars to draw the last signals. (Default 5000) Draw Candles : Draw red candle when sell signal and green when buy signal. (tr
FREE
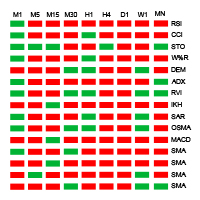
Indicator principle: Display all cycle trends of 15 indicators in one chart Oscillation indicator shows the current value of each cycle at the same time (RSI, CCI, STOCHI, W% R, DEM, ADX, RVI, IKH, SAR, OSAM, MACD, moving average, moving average crossing) RSI (Relative Strength Index) Trend level above red below green CCI (Commodity Channel Index) Trend level above red below green STOCH (Stochastic Oscillator) Gold fork red death fork green W% R (WilliamsPercent Range) Trend level above red bel

На рисунке ниже показан принцип работы индикатора. Это поиск паттерна Price Action.
Свечная модель состоит из двух показателей доминирования быков или медведей. В построении сигнала также участвуют тиковые объемы и объемная дельта.
Индикатор ищет возможные развороты на участке, длина которого задается в параметрах Calculation High/Low
По умолчанию параметр задан, как 50 баров.
Входные параметры Calculation High/low - определение high/low по количеству баров

Индикатор пригодится тем, кто использует кластеры Фибоначчи в торговле и применяет построения с разными наборами уровней. Каждый набор уровней применителен как к уровням Retracement , так и к Expansion (выбирается в настройках). Уровни задаются перечислением в формате "0;50;61.8;100". Настройки индикатора: Fibonacci #1 – Набор уровней #1 Fibonacci – Тип уровней : Retracement или Expansion Levels – Набор уровней в формате "0;23.6;38.2;50;61.8;100" Color line – Цвет линии Style line – Стиль линии
FREE
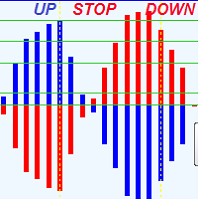
This indicator that shows precise price direction ,and force of this direction, reversals ,added it to any chart and you supress any confusion .
It calculs force of current direction and Predicts price reversals with high degree of accuracy withs its key levels and it is great for scalping , Or swing trading . For any time frame the following behavor is the same : Blue Histogram above 0.0 means that a buyers dominates price movement In other side , Red Histogram Above 0.0 means sellers

Displays previous months Highs & Lows. You can set the number of months to display levels for, also the line style, color and width. This is very useful for traders using the BTMM and other methods like ICT. I'll be creating similar indicators for MT5 for the BTMM. Send me your suggestions to my Telegram: https://t.me/JDelgadoCR Take a look at my other products at: https://www.mql5.com/en/users/jdelgadocr/seller
FREE
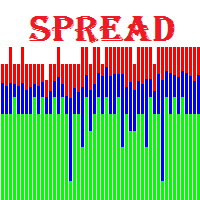
Spreads Monitoring MT4 - мощный инструмент для сбора значений спреда и записи их в файл. Позволяет "ловить" минимальные и максимальные значения спреда, рассчитывает реальное среднее значение спреда у брокера . Преимущества индикатора: Работает на всех таймфреймах; Восстанавливает ранее записанные данные для отображения на графике; Умеет запускать себя на графиках других символов по шаблону текущего графика; Имеет инструменты для удобной работы с данными; Не нагружает терминал. Параметры индикато
MetaTrader Market - der einzige Shop, in dem man Handelsroboter als Demoversion herunterladen und testen sowie anhand historischer Daten optimieren kann.
Lesen Sie die Beschreibung und Bewertungen anderer Kunden über das gewünschte Produkt, laden Sie es direkt ins Terminal herunter und erfahren Sie, wie man einen Handelsroboter vor dem Kauf testet. Nur bei uns können Sie ein Programm testen, ohne dafür zu bezahlen.
Sie verpassen Handelsmöglichkeiten:
- Freie Handelsapplikationen
- Über 8.000 Signale zum Kopieren
- Wirtschaftsnachrichten für die Lage an den Finanzmärkte
Registrierung
Einloggen
Wenn Sie kein Benutzerkonto haben, registrieren Sie sich
Erlauben Sie die Verwendung von Cookies, um sich auf der Website MQL5.com anzumelden.
Bitte aktivieren Sie die notwendige Einstellung in Ihrem Browser, da Sie sich sonst nicht einloggen können.