Neue technische Indikatoren für den MetaTrader 4 - 3

* Pivot Points Magic : Effortlessly Plot Pivot Levels on Any Chart**
Pivot Points Magic simplifies the process of identifying critical pivot levels on any chart, across all timeframes. With just a few clicks, traders can instantly visualize pivot points, enabling them to make more informed trading decisions.
We value your feedback! Share your experience with Pivot Points Magic and help us improve. Your reviews and suggestions are essential for shaping future updates and enhancements to the

This is the higher timeframe pivot scanner. There are quite a few input options to choose from, to calculate the Daily, Weekly, or the Monthly Pivots, for any forex pairs / or your own pairs. You can use the Fibonacci way of calculating the pivots, or the Standard way of calculation. The input choice also has 5 different ways to choose from: - using the averages of High, Low and Close. - using the averages of High, Low, Close, and Close. - using the averages of High, Low, Open, and Close.

The “Sharp Scalper” indicator is high-frequency trading tool designed for quick, short term trades in the forex market. It focus on identifying rapid price movement and generating signals for best entry. This indicator is known for its ability to capture small profit opportunities multiple times throughout the day making it ideal for scalpers looking to capitalize on market volatility. The” sharp scalper” indicator employs advance algorithms to detect market trends and fluctuation, helping trade

We have combined all of our beloved indicators the likes of: Key level order block , Key level supply and demand , Key level liquidity grab and Key level wedge into one single indicator and dashboard.
Whats new Dashboard : There is an easy access dashboard for all your needs. Multi-timeframe button : There is now a multi-timeframe option for Order Blocks and Supply and demand zones, making it easy to see higher timeframe zones easily on the current timeframe by just clicking the desired timefr
Dieses leistungsstarke Tool identifiziert automatisch Trendlinien, um Ihre Handelsstrategie zu optimieren und fundiertere Entscheidungen zu treffen. MT5 -Version
Schlüsselfunktionen Erkennung der automatischen Trendlinie : Die Anzeige "Basic Trendline" scannt den Markt für potenzielle Trendlinien und zeigt sie sofort in Ihrem Diagramm an.Dies spart Ihnen wertvolle Zeit und stellt sicher, dass Sie nie einen wichtigen Trend verpassen. benutzerfreundliches Panel : Unser Indikator verfügt über ein
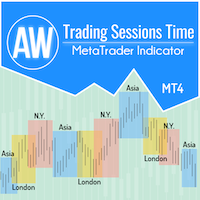
Damit Händler bequem Daten zur Entwicklung der Märkte erhalten und Handelsstrategien besser formulieren können, haben wir einen Handelssitzungsindikator entwickelt. Die Öffnungszeiten verschiedener Börsen wirken sich auf den Handel aus, da sie die Marktaktivität und das Handelsvolumen beeinflussen. Diese Faktoren bestimmen die Volatilität und Handelsmöglichkeiten verschiedener Instrumente. Der AW Trading Sessions Time-Indikator zeigt die Handelszeiten der asiatischen, Londoner und New Yorker Mä
FREE

"Scalping Signal No Repaint No Lag" ist der einzige Indikator auf dem Markt, der beim Ziehen auf ein beliebiges Diagramm automatisch alle erforderlichen Indikatoren lädt, ohne dass Vorlagen oder andere Indikatoren geladen werden müssen. Er konfiguriert das Diagramm automatisch so, dass es genau wie im bereitgestellten Bild aussieht. Dieser Indikator garantiert Signale ohne Neuzeichnung oder Verzögerung und ist daher ideal für Scalping-Strategien bei allen Währungspaaren und Zeitrahmen (TF). Funk
WONNFX iN M5 - Arrow indicator for Forex and Binary Options. Reliable signal algorithm. Indicator not repaint. Indicator working hours: 21:55-23:00. GMT+2. Average winrate = 60-70%.
Recommendations: Timeframe: M5. Expiration: 2-3 candles (1 candle = 5 minutes) Symbol: EURUSD, USDJPY, EURAUD, GBPAUD, EURJPY, AUDUSD, USDCAD, NZDUSD, AUDCAD, AUDCHF, AUDJPY, AUDNZD, CADJPY, EURCAD, EURGBP, GBPUSD, GBPCAD, NZDJPY, CADJPY, XAUUSD
FREE

BRICS-Indikator
Willkommen zurück auf unserer Seite!
Kaufen Sie beim weißen Pfeil ein. Verkaufen Sie beim gelben Pfeil.
Es ist sehr einfach.
Ich werde nicht auf Details eingehen.
Ich bin sicher, dass Sie über genügend Erfahrung und Wissen verfügen.
Die beigefügten Bilder zeigen meiner Meinung nach die Leistungsfähigkeit dieses Indikators sehr deutlich.
Bei AUDCHF, GBPUSD, AUDJPY, NZDUSD funktioniert es sehr gut.
Es kann sein, dass es bei anderen Paaren seltenere Signale gibt ode

Introducing our exciting new Price Retest indicator! Get instant alerts when the price retests, giving you a powerful edge in your trading strategy. Remember to do your own analysis before making any moves in the market. MT5 Version - https://www.mql5.com/en/market/product/118159/ Here’s a detailed explanation of how the Price Retest indicator works, its components, and how you can incorporate it into your trading strategy: The Price Retest indicator is designed to notify traders when the pric
FREE

Der Spider-Renko-Pfeil ist ein Renko-basierter Pfeilindikator, der ein Signal bei offener Bar/Intra-Bar gibt und zwei Strategien zur Darstellung des Signals verwendet. Dieser Indikator kann zum Skalpieren eines TP eines Balkens oder zum Swing-Traden verwendet werden, wenn er mit höheren Perioden in seinen Einstellungen verwendet wird. Dieser Indikator muss niemals neu lackiert oder hinterlackiert werden. =============================================== ======= Parameter: Eingabezeitraum: Hauptsi

Sobald der Markt eine wichtige Ober- oder Untergrenze erreicht hat, tritt er in eine Korrektur ein und findet seinen fairen Wert.
Der Indikator wird automatisch berechnet:
Niveau des fairen Wertes Korrekturkanal Abstand in Pips zwischen dem fairen Wert und den Grenzen des Korrekturkanals Sinuswelle, die von der ersten Fair-Value-Level-Kerze ausgeht und sich im Laufe der Zeit ausdehnt und die erwarteten Höchstwerte der Korrekturausdehnung vor einem Ausbruch anzeigt. Auf einen Durchbruch der
Für MT5
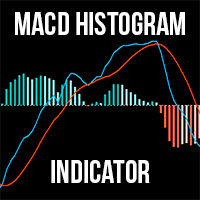
Der MACD Histogramm Indikator ist eine verbesserte Version des traditionellen MACD-Indikators, die eine überlegene Einsicht in Markttrends und Momentumänderungen bietet. Im Gegensatz zum standardmäßigen MACD in MT4, enthält diese Version ein Histogramm , das die Visualisierung und Interpretation der Marktbedingungen erleichtert. Vorteile gegenüber dem standardmäßigen MACD-Indikator: Verbesserte Visualisierung: Das Histogramm bietet eine Balkendarstellung der Differenz zwischen der MACD

Binary ATM ist ein Signalindikator für binäre Optionen, der auf 2 Teilen basiert, der erste ist in Form einer farbigen Linie, die die Trendrichtung angibt und Verkäufe nur bei Käufen diktiert, der zweite ist ein Einstiegssignal in Form eines Punkts, der auf BAR OPEN kommt und nie neu lackiert wird und nicht verzögert wird.
ANWENDUNG :
Warten Sie, bis ein Verkaufspunkt bei der Eröffnung des Balkens angezeigt wird, wenn der vorherige Balken eine Verkaufslinienfarbe hatte, als einen Verkauf zu
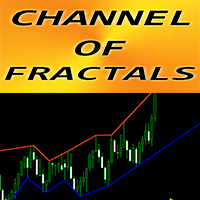
Forex Indicator "CHANNEL of FRACTALS" for MT4 This indicator is showing actual local Trend lines based on Highs/Lows of Fractals Great for traders who use Graphical Analysis Resistance local trend lines - Red color Support l ocal trend lines - Blue color It has few parameters responsible for number of fractals, trend line colors and width // More great Expert Advisors and Indicators are available here: https://www.mql5.com/en/users/def1380/seller // Also you are welcome to join to pro

Forex Indicator " Hanging Man pattern" for MT4 Indicator " Hanging Man pattern " is very powerful indicator for Price Action trading: No repaint, No delays; Indicator detects bearish Hanging Man patterns on chart: Red arrow signal on chart (see pictures) PC, Mobile & Email alerts are included Indicator "Hanging Man pattern" is excellent to combine with Support/Resistance Levels : https://www.mql5.com/en/market/product/100903 // More great Expert Advisors and Indicators are available he
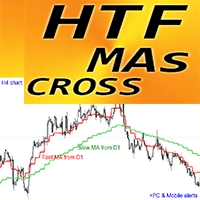
Forex Indicator "HTF Moving Averages Cross" for MT4 Upgrade your trading methods with the powerful HTF Moving Averages Cross indicator for MT4. H TF means - H igher Time Frame This indicator is excellent for Trend Traders with Price Action entries. It allows you to attach Fast and Slow Moving Averages from Higher time frame to your current chart --> this is professional method. HTF MAs CROSS has built-in Mobile and PC alerts
This indicator gives opportunity to get decent pro
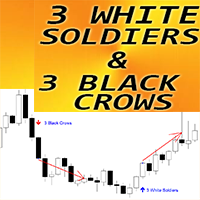
Forex Indicator " 3 White Soldiers & 3 Black Crows patterns" for MT4 Indicator "3 White Soldiers & 3 Black Crows" is very powerful for Price Action trading: No repaint, No delays; Indicator detects 3 White Soldiers and 3 Black Crows patterns on chart: Bullish 3 White Soldiers pattern - Blue arrow signal on chart (see pictures) Bearish 3 Black Crows pattern - Red arrow signal on chart (see pictures) P C, Mobile & Email alerts are included Indicator " 3 White Soldiers & 3 Black Crow
Engulfing Candle Signal Alert: Elevate Your Trading Strategy Unlock the full potential of your trading with the Engulfing Candle Signal Alert, the ultimate tool for identifying market reversals and enhancing your trading precision. Designed specifically for traders who value accuracy and timely alerts, this powerful indicator detects engulfing candle patterns, a key signal in technical analysis that often indicates a potential shift in market direction. What is an Engulfing Candle? An engu
FREE

Advantages of the Tick Volume Indicator: Identifying Market Sentiment : A predominance of green bars on the histogram may indicate an uptrend or strong buying pressure, useful for determining entry points for long positions. A predominance of red bars indicates a downtrend or strong selling pressure, useful for determining entry points for short positions. Analyzing Market Activity : The indicator helps identify periods of high activity, when significant changes are occurring in the market, and
Elegant RSI indicator can generate RSI divergence with the availability of user defined filters. It can generate voice alerts for RSI oversold and RSI Overbought situations. Moreover it can also generate voice alerts for RSI Divergneces as well as when price breaks above or breaks below the support and resistances created upon divergence ouccurence. The voice alerts are generated in a way that you will know which market has reached the oversold and overbought conditions as well as the rsi Dive
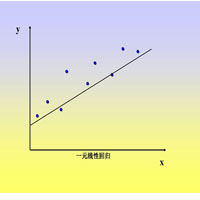
This index is used to calculate the linear regression slope of the K line in a period of time. The algorithm adopts the least square method.
1. Suitable for each cycle chart.
2. Can be used to calculate opening price, closing price, high price, low price, middle price.
3. Specify the start time and end time in the parameters.
Note that the start time and end time cannot be weekends, select the calculated price, pay attention to capital letters.
FREE
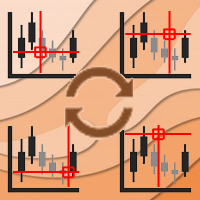
Async Charts is an indicator to synchronize charts and display a customized crosshair (cursor) on all selected charts. This is a useful utility for traders using multiple timeframes of analyzing multiple symbols for trade entry or exit.
Main Features : Real time Crosshair Synchronization on All Selected Charts
Supports Multiple Timeframes and Multiple Symbols at the same time
Auto Scroll Option
Graphical Adjustment of Color, Font, Size, ...
Locking All or Locking Specific Charts
More and
FREE UNLIMITED PM : https://linktr.ee/ARFXAUTOTRADE?utm_source=linktree_admin_share
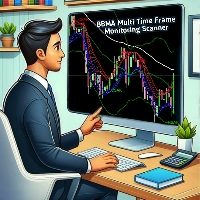
This BBMA FULL SETUP Scanner indicator is based on Multi Time Frame Monitoring and can be used for direct entry when a signal appears. Rules for Using Indicators: 1. Wait for Full Setup BBMA / EMA 50 Cross Mid BB 20 2. Wait for Reentry / Reetes CANDLE when CSAK / CSM occurs 3. Stop Loss Candle CSAK / CSM is formed 4. Take Profit = 2-5 x Stop Loss Distance If you want to use this indicator for free and unlimit
FREE

FREE UNLIMITED PM : https://linktr.ee/ARFXAUTOTRADE?utm_source=linktree_admin_share
Bagaimana Cara membaca market melalui FMCBR-W - Didalam dunia trading ini pelbagai cara digunakan oleh trader dan penganalisa market membaca dan memahami trend. - Dari sudut FMCBR permulaan trend atau permulaan pullback dikenali melalui CB1. Apa pun dari sudut FMCBR-W trend didefinasikan melalui 3 combinasi yang saya akan kupas di muka surat seterusnya nanti. - Saya amat berharap agar pengunaan FMCBR-W nanti
FREE

The Awesome ATR Indicator is a technical analysis tool developed for the MetaTrader 4 (MT4) platform. This indicator is designed to assist traders in determining stop loss and take profit levels based on the average value of the Average True Range (ATR). By leveraging the market volatility data provided by ATR, this indicator offers more accurate and dynamic guidance in setting these crucial trading levels. Key Features: Dynamic Stop Loss Determination: Calculates stop loss levels based on the A
FREE

Sync Cursor MT4 Sync Cursor MT5 https://www.mql5.com/en/market/product/118259 MT4 Tool will It make the Horizontal Line + Vertical Line in the Screen That it is always present on the screen and that it moves along with the candle (with the price). I am sure that something so simple will be a Treasure in the hands of many people. Some of my personal trades are posted voluntary and free of charge in this Public channel https://t.me/FXScalpingPro Contact: https://t.me/TuanNguyenTrader
FREE
ダイバージェンス はオシレーター系のテクニカル指標が、実際の相場とは逆方向に向かって動いている状態のことを指し、その後のトレンド転換の可能性を示す戦略として有効です。
このインディケータは特に有効性の高いMACDのダイバージェンスを利用した 裁量トレード用サインツールです。
高頻度かつ高い 勝率で サインを発信しますが、各種の強力なフィルターにより、さらに精度の高いサインに絞ることが出来ます。また、通常のダイバージェンスに加えリバーサル( 隠れダイバージェンス) によるサイン発信も可能です。
全通貨ペア、全タイムフレームで利用できます。勝敗判定機能により、このインディケータの直近の相場環境に対する有効性を確認できます。
設定項目は以下の通りです。 Enable Divergence...MACDのDivergenceによるサインの発信を有効にします。ピンクの矢印が表示されます Enable Reversal...MACDのReversal(Hidden Divergence)によるサインの発信を有効にします 。ブルーの矢印が表示されます Fast EMA Pe

YK-Fibo Pivot Indicator: Trade Smarter with Fibonacci Pivot Points The YK-Fibo Pivot Indicator is a powerful technical analysis tool that combines the precision of Fibonacci retracements with the insights of Pivot Points. Whether you're a novice or seasoned trader, this indicator empowers you to spot profitable opportunities in the market with ease. Why Choose YK-Fibo Pivot? Pinpoint Support & Resistance: By calculating Fibonacci levels based on the previous day's high, low, and close prices, y

Using this indicator, you can see the moving average of 7 time frames in (one time frame) the same time frame you are.
You can also set orders to enter buy or sell positions automatically when the price hits Moving.
You can also set orders to risk free or close existing positions when the price hits Moving.
Also, receive a notification on your mobile phone when the price hits Moving.or position will be risk free or close .

PTW NON REPAINT TRADING SYSTEM + HISTOGRAM Non-Repainting , Non-Redrawing and Non-Lagging Trading System.
Does the following: - Gives Accurate Entry and Exit Points - Scalping, Day and Swing Trading - 95% Accuracy - Targets, where to take profits. - Shows Trends, Support and resistance levels - Works on All Brokers - Works on All Currencies, CFDs and Stocks - It does not place trades for you, it only shows you what trades to place. - It works on All Timeframes - It is for Trend or ra

POWER TO GET WEALTHY TRADING SYSTEMS.
NON REPAINT REVERSAL ARROW AND CHANNEL Intra-Day trading and Scalping Strategy: Designed for fast and accurate day trading and short-term trades.
Day and Swing Trading Strategy: Can be used as a reliable tool for day and swing traders who aim for the big moves of the price.
Multi Currencies and Markets: Works on different instruments and markets with its reliable precision.
Multi Timeframes: Can be used on multiple timeframes with good perfor

Trading Dashboard is a useful tool for your multiple trades. It contain information such as : - Breakeven point(price) of your multiple trades, - Loss point(price) of your trades, - Current Trading Day and Session, - Current Time and time left of candles, - Total Lot Buy & Sell, and sum of it - Spread and ATR of current time frame and symbol - Profit-Loss in percentage of your open trade

The RPO (Relative Price Oscillator) is a technical analysis indicator used in Forex trading to measure the momentum and trend strength of a currency pair. It is derived from the Relative Strength Index (RSI) but focuses on the difference between two moving averages of price, usually the closing price, over different periods. The RPO is similar to the MACD (Moving Average Convergence Divergence) but uses relative price levels instead of absolute price levels. Key Components: Short-Term Moving Ave

Description of Fibonacci Levels for Support and Resistance (SNR) with a Statistical Model Fibonacci levels are widely used in technical analysis to identify potential support and resistance levels in financial markets. These levels are derived from the Fibonacci sequence, a mathematical sequence where each number is the sum of the two preceding ones. The key Fibonacci retracement levels are 23.6%, 38.2%, 50%, 61.8%, and 100%.

Manual guide: Click here WEEK SALE PROMO: $65 ONLY! -- Next price is $120 .
This indicator is unstoppable when combined with our other indicator called Support & Resistance . After purchase, send us a message and you will get it for FREE as a BONUS! I like to use Trend Punch on XAUUSD on the M1 timeframe & higher ones! Introducing Trend Punch , the revolutionary forex trend indicator that will transform the way you trade! Trend Punch is uniquely designed to provide pre
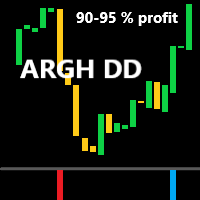
ARGH DD Kauf-/Verkaufsindikator
Dieser Indikator ist ein Histogrammindikator.
Es handelt sich um einen leistungsstarken und genauen Indikator mit sehr wenigen Fehlalarmen.
Die von ihnen ausgelösten Trades sind tage- oder wochenlange Trades.
Aber es sind sehr stabile Transaktionen.
Die Einreisebestimmungen sind natürlich ganz einfach:
️ der blaue Histogrammbalken zeigt die Eröffnung einer Kaufposition an;
️ Der rote Histogrammbalken zeigt die Eröffnung einer Verkaufsposition an.
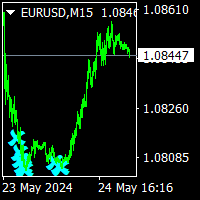
norepaint arrows indicator is a nrp indicator. never change signals or put signals back. when price up blue arrow is sell ,when price down aqua arrows are buy signals. thise indicator can use all time frames and for all pairs.. Mostly use lower timeframes. cnt value is 1000 bars. to see back signals ,cnt value can be increase if there is enough bars on charts. minimum value cnt is 500. dont use lower then 500. g value has been set to optimum value is 1. Increasing g value gives more signals.

Fractals Dynamic Fractals Dynamic – ist ein modifizierter freier Fraktalindikator von Bill Williams, bei dem Sie die Anzahl der Balken links und rechts manuell festlegen und so einzigartige Muster im Diagramm erstellen können. Jetzt haben alle Handelsstrategien, die auf dem Fractals Dynamic-Indikator basieren oder auf denen der Indikator basiert, ein zusätzliches Signal.
Darüber hinaus können Fraktale als Unterstützungs- und Widerstandsniveaus fungieren. Und einige Handelsstrategien zeigen
FREE

Der Indikator LEVELSS zeigt an:
- Tägliche bullische und bearische Zone. Er ist täglich von 00:00 bis 23:59 Uhr sichtbar. - Die wöchentliche Hausse- und Baissezone. Sie ist jede Woche von Montag 0:00 Uhr bis Freitag 23:59 Uhr sichtbar. - Speziell berechneter Kanal aus einem bestimmten Zeitrahmen, der auf allen anderen Zeitrahmen angezeigt wird. Standardmäßig ist dies der 4-Stunden-Zeitrahmen, den Sie auf jeden anderen Zeitrahmen, den Sie handeln möchten, ändern können. Er wird nonstop berech

Unser Basic Support and Resistance Indikator ist die Lösung, die Sie für die Steigerung Ihrer technischen Analyse benötigen.Mit diesem Indikator können Sie Support- und Widerstandsebenen in der Tabelle projizieren/ MT5 -Version
Funktionen
Integration von Fibonacci -Ebenen: Mit der Option, Fibonacci -Werte neben Unterstützung und Widerstandsniveau anzuzeigen, gibt unser Indikator einen noch tieferen Einblick in das Marktverhalten und mögliche Umkehrbereiche.
Leistungsoptimierung: Mit der Op
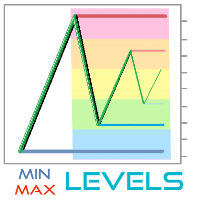
MinMax Levels MinMax Levels – ist ein Indikator für die Höchst-, Tiefst- und Eröffnungspreisniveaus für wichtige Handelsperioden: Tag, Woche und Monat.
Jeder Forex-Marktteilnehmer verwendet Level in seinem Handelssystem. Sie können entweder das Hauptsignal für die Durchführung von Transaktionen sein oder ein zusätzliches Signal, das als Analyseinstrument fungiert. In diesem Indikator wurden Tage, Wochen und Monate als wichtige Zeiträume ausgewählt, da sie die wichtigsten Handelszeiträume g

Renko Masterx ist ein mt4-Pfeiltyp-Indikator, der für den Handel mit Renko-Charts entwickelt wurde. Dieser Indikator verfügt über ein Backtesting-Dashboard, das dem Händler nützliche Informationen wie Winrate und gewonnene Punkte liefert. Außerdem gibt er tp und sl in der Multiplikation von ATR x an. Dieser Indikator gibt seine Werte an Signal bei offenem Balken oder Intrabalken, und er verfügt über eine weiße Markierung, die den genauen Preis markiert, bei dem das Signal gegeben wurde. Die Ver

Der BMW M5 ist ein Hochgeschwindigkeits-Indikator, der für das Scalping entwickelt wurde und extrem genaue und schnelle Signale für Richtungsänderungen des Preises auf allen Zeitrahmen, einschließlich der kleinsten, M1 und M5, liefert. Er funktioniert mit allen Währungspaaren und ermöglicht es den Händlern, den Markt mit einem Intraday-Scalping-Handelssystem zu analysieren. Auf den Zeitrahmen M1 und M5 bietet er den Händlern täglich Dutzende von Einstiegssignalen. Nutzungsempfehlungen: Wenn der
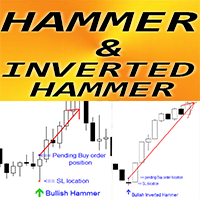
Forex Indicator " Hammer and Inverted Hammer pattern" for MT4 Indicator " Hammer and Inverted Hammer pattern " is very powerful indicator for Price Action trading : No repaint, No delays; Indicator detects bullish Inverted Hammer and Hammer patterns on chart: Bullish Inverted Hammer - Blue arrow signal on chart (see pictures) Bullish Hammer - Green arrow signal on chart (see pictures) P C, Mobile & Email alerts are included Indicator " Hammer and Inverted Hammer pattern

Forex Indicator " ATR Trailing Stop" for MT4 Upgrade your trading methods with great auxiliary ATR Trailing Stop indicator for MT4. This indicator is perfect for Trailing Stop purpose ATR Trailing Stop is automatically adaptive to market volatility No delays and easy set up This indicator is excellent to combine with price action entries into the direction of main trend // More great Expert Advisors and Indicators are available here: https://www.mql5.com/en/users/def1380/seller //
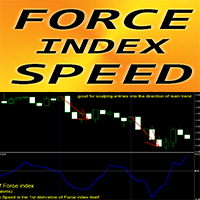
Forex Indicator " Force index Speed" for MT4 The calculation of this indicator is based on equations from physics. Force index Speed is the 1st derivative of Force index itself F orce index is one of the top indicators that combines price and volume data into a single value Force index Speed is good for scalping entries into the direction of main trend: u se it in combination with any suitable trend indicator Force index Speed indicator shows how fast Force index itself changes its d

The Channel Scalper Pro Indicator is a highly efficient tool for market analysis based on price channels and signal arrows. This indicator is designed for the MetaTrader 4 (MT4) platform. It utilizes a combination of channels and visual signals to provide fairly accurate entry and exit points in the market. Below is a detailed description of the indicator, its functionalities, and usage strategies. Technical Description Channels: The channels presented by the indicator display the upper and lowe
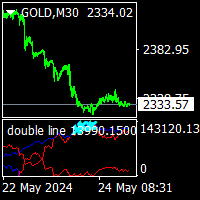
double line indicator is no repaint trend indicator. it can be use all pairs and all timeframes. it is wery ease to use.also beginner can use. it gives gold and aqua points on the double lines. aqua points is come when the prices is down. and gold points is come when the prices is on top. it can be used all time frames and all pairs. suitable for experienced and beginners traders.

Interceptor - an arrow indicator shows potential market entry points in the form of arrows of the corresponding color: up arrows (blue) suggest opening a buy, down arrows (red) suggest selling. The appearance of arrows may be accompanied by sound signals if the sound option is enabled. It is assumed to enter on the next bar after the indicator, but there may be non-standard recommendations for each strategy. Interceptor visually “unloads” the price chart and saves analysis time: no signal - no d

GAP DETECTOR
FVG in trading refers to "Fair Value Gap", . It is a concept used in technical analysis to identify areas on a price chart where there is a discrepancy or gap between supply and demand. These gaps can occur due to rapid movements in price, usually as a result of important news or economic events, and are usually filled later as the market stabilizes. The GAP DETECTOR indicator is designed to identify fair value gaps (FVG) on the price chart and filter them using volatility to det
FREE

The Prop Trading Scalper indicator is a tool used for manual traders to assist in passing prop trading challenges, which are evaluations set by proprietary trading firms to determine a trader's skill and discipline. This indicator is particularly designed for scalping, a strategy that involves making numerous small trades to capitalize on minor price movements.

Awesome MACD Indicator is a powerful trading tool that combines the strengths of Moving Average (MA) and Moving Average Convergence Divergence (MACD) to provide accurate and reliable trading signals. Designed for forex and stock traders, this indicator simplifies the identification of trading opportunities by detecting significant crosses in price movements. Key Features: MA and MACD Combination: Awesome MACD leverages the power of Moving Averages (MA) to identify short-term and long-term trends
FREE
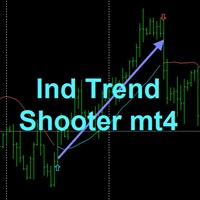
TREND SHOOTER With alerts
It is a trend indicator based on moving averages that very efficiently calculates changes in market direction.
This has the ability to anticipate changes of direction very early.
FEATURES
This indicator particularly draws two moving averages that are used only to show color changes. they can wear these moving stockings as they wish as they do not affect the color change behavior bullish blue color bearish red color where the line is interrupted it is not reco
GAP DETECTOR
FVG in trading refers to "Fair Value Gap", . It is a concept used in technical analysis to identify areas on a price chart where there is a discrepancy or gap between supply and demand. These gaps can occur due to rapid movements in price, usually as a result of important news or economic events, and are usually filled later as the market stabilizes.
The GAP DETECTOR indicator is designed to identify fair value gaps (FVG) on the price chart and filter them using volatility to d
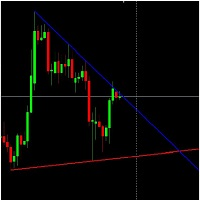
Standard Trend Lines (Automatic).
This indicator draws highly accurate trend lines.
It draws Trend Lines automatically.
This Trend Lines indicator was made by observing lot of discussions made about Trend Lines in forum.
The Trend Lines can also be used to create Expert Advisor.
Latest valid Trend Lines are drawn on Chart.
Trend Lines Work on basis of OHLC price data.
FREE
FREE UNLIMITED PM : https://linktr.ee/ARFXAUTOTRADE?utm_source=linktree_admin_share
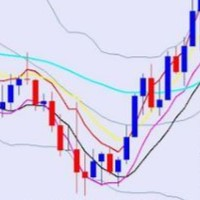
BBMA Terdiri dari indikator BB dan 5 Moving Averages, BBMA Oma Ally (OA) merupakan sistem trading buatan seorang trader asal Malaysia bernama Oma Ally. Setelah melalui penelitian dan pengujian selama bertahun-tahun, beliau membantu banyak trader sejak 2010 dengan sistem ciptaannya ini.
Di kalangan trader Indonesia sendiri, BBMA OA sudah mulai populer sejak beberapa tahun lalu. Saking populernya, sistem tr
FREE
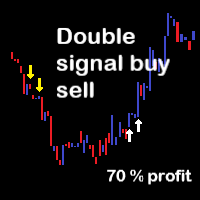
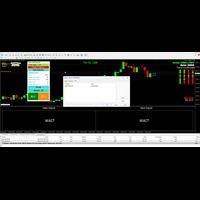
The Indicator Has signal with wait , Ready To Buy and Ready To Sell to make you ready to execute when signal coming , it very easy to use and very profitable , good for forex , Binary or crypto and GOLD , you just wait and execute , no need to analysis , because it already analysis by indicator , for exsample Wait than ready to buy or ready to sell than buy or sell you just entry as per instruction of indicator , very easy and usefull

It's a variation of mid of HH and LL since it compares the higher of HH or LL against a period and twice the number of bars back to avoid whipsaws.
I used to display this against lines on a chart, but made a histogram out of it and it looks interesting.
It looks good at gauging trend strength and general turns (see image below).
The name of the indicator is BAM, which is an acronym for "Below and Above Mid".
Ways to use it:
1. To see general trend on longer TFs (more than 60 ba

It's a variation of mid of HH and LL since it compares the higher of HH or LL against a period and twice the number of bars back to avoid whipsaws.
I used to display this against lines on a chart, but made a histogram out of it and it looks interesting.
It looks good at gauging trend strength and general turns (see image below).
The name of the indicator is BAM, which is an acronym for "Below and Above Mid".
Ways to use it:
1. To see general trend on longer TFs (more than 30 ba

Precision Trend Signals is an indicator that shows price reversal points on the chart using arrows. A green arrow indicates when the price will reverse upward, and a red arrow indicates when the price will reverse downward. The indicator can be used on any timeframes and any currency pairs. Trading Strategy with this Indicator: Green Arrow : When a green arrow appears, close any previously opened (if any) sell position and open a buy position. Red Arrow : When a red arrow appears, close any prev

The Renko indicator is a technical analysis tool used in the forex market to visualize price movements and trends by eliminating market "noise." Unlike traditional candlestick or bar charts, Renko is built based on price changes of a specified number of points, called the "brick size." When the price moves by this amount of points, a new "brick" is added to the chart. This indicator ignores time and volume, focusing exclusively on price changes. The main features of the Renko indicator include:

Market Noise Market Noise ist ein Indikator, der Marktphasen auf einem Preisdiagramm bestimmt und außerdem klare, glatte Trendbewegungen von lauten, flachen Bewegungen unterscheidet, wenn eine Akkumulations- oder Verteilungsphase auftritt. Jede Phase ist für ihre eigene Art des Handels gut: Trend für trendfolgende Systeme und flach für aggressive Systeme. Wenn der Marktlärm beginnt, können Sie sich entscheiden, aus dem Handel auszusteigen. Auf die gleiche Weise und umgekehrt müssen Sie aggressi

Dieser Indikator zeigt Ihnen die folgenden Ebenen an:
Tägliche offene Linie: unten ist der rückläufige Markt, oben ist bullisch. Durchschnittlicher täglicher Höchst- und Tiefstwert Asiatischer Markt hoch und niedrig Die Höhen und Tiefen von gestern Bei diesen Ebenen handelt es sich um starke Unterstützungs- und Widerstandsebenen, auf die jeder achten muss.
Wenn Sie die Zeit nicht genutzt haben, um anzufangen! Sie müssen aufpassen, wenn der Preis nahe an diesen Niveaus liegt!
Genießen Sie
FREE

Forex Indicator "Trend Entry Histogram" for MT4 Trend Entry Histogram indicator can be used for search of entry signals into the trend direction once Entry bar appears This indicator has unique feature - it takes both: price and volume for calculations Trend Entry Histogram can be in 2 colors: red for bearish trend and blue for bullish one . Once you see steady trend (minimum 10 consecutive histogram bars of the same color) - wait for entry bar Entry signal is 1 column with oppos

ATR ist ein wichtiger Indikator für jeden Finanzmarkt. Die Abkürzung ATR steht für Average True Range. Dieser Indikator ist ein Instrument zur Bestimmung der Volatilität des Marktes, das ist sein direkter Zweck. ATR zeigt die durchschnittliche Preisbewegung für den gewählten Zeitraum an. Der Anfangspreis des Indikators ist 63$. Der Preis wird alle 10 Verkäufe bis zu 179$ steigen. Der ursprüngliche ATR-Indikator ist in vielen Handelsprogrammen enthalten. Der ATR-Indikator ist nicht sehr informat

The "M1 scalping signal" is a scalping indicator designed for the M1 timeframe. The indicator displays arrows on the chart indicating price reversal points. A red arrow indicates a price reversal to a sell position, while a green arrow indicates a price reversal to a buy position. It can be used on all currency pairs. Advantages: No Redrawing: The indicator does not redraw signals on historical data, ensuring stable analysis. Ease of Use: It is easy to configure and visualizes important reversal
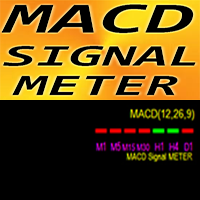
Forex Indicator MACD Signal METER for MT4 Very useful MACD Signal METER indicator is showing current MACD value (above/below Signal) for 7 time frames simultaneously Green box - MACD is above Signal Red box - MACD is below Signal Forex Indicator MACD Signal METER can be used as trade entry filter for Multi Time Frame trading
// More great Expert Advisors and Indicators are available here: https://www.mql5.com/en/users/def1380/seller // Also you are welcome to join to profitable
Erfahren Sie, wie man einen Handelsroboter im MetaTrader AppStore, dem Shop für Applikationen für die MetaTrader Handelsplattform, kaufen kann.
Das Zahlungssystem der MQL5.community ermöglicht Zahlungen mit PayPal, Kreditkarten und den gängigen Zahlungssystemen. Wir empfehlen Ihnen eindringlich, Handelsroboter vor dem Kauf zu testen, um eine bessere Vorstellung von dem Produkt zu bekommen.
Sie verpassen Handelsmöglichkeiten:
- Freie Handelsapplikationen
- Über 8.000 Signale zum Kopieren
- Wirtschaftsnachrichten für die Lage an den Finanzmärkte
Registrierung
Einloggen
Wenn Sie kein Benutzerkonto haben, registrieren Sie sich
Erlauben Sie die Verwendung von Cookies, um sich auf der Website MQL5.com anzumelden.
Bitte aktivieren Sie die notwendige Einstellung in Ihrem Browser, da Sie sich sonst nicht einloggen können.