Neue technische Indikatoren für den MetaTrader 4 - 29
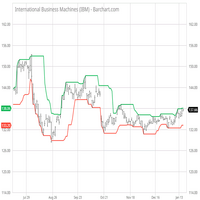
Super Pair Strong Indicator is a highly popular momentum and trend indicator that utilizes multiple currencies to determine trends. It is a one-chart indicator that combines the algorithms of the MACD and Currency Strength Meter. With its one-click feature, users can view 28 major and minor pairs on their dashboard, and by clicking on a specific pair, the chart will automatically change to the user's preferred chart. In addition to its user-friendly interface, Super Pair Strong Indicator offers

Zeichnen Sie automatisch Unterstützungs- und Widerstandsniveaus PLUS Antriebskerzenlücken auf Ihrem Chart ein, so dass Sie sehen können, wohin sich der Preis wahrscheinlich als Nächstes bewegen und/oder möglicherweise umkehren wird.
Dieser Indikator wurde entwickelt, um als Teil der Positionshandelsmethodik verwendet zu werden, die auf meiner Website (The Market Structure Trader) gelehrt wird, und zeigt Schlüsselinformationen für die Zielsetzung und potenzielle Einstiege an.
Der Indikator v

Entdecken Sie, wo große Institutionen handeln und optimieren Sie Ihre Investitionen mit dem kostenlosen VWAP-Anker-Indikator für MetaTrader 4. Entdecken Sie den Preis, zu dem große Institutionen Geschäfte tätigen, mit unserem kostenlosen VWAP-Anker-Indikator für MetaTrader 4! Jetzt können Sie wertvolle Zeit sparen, indem Sie das Plotten Ihrer verankerten VWAPs automatisieren, indem Sie sie an den Tops und Böden des Marktes verankern. Unsere kostenlose Version ermöglicht es Ihnen, die VWAP in Ech
FREE
Der Forex-Scalping-Indikator, der auf Pfeilpreis-Umkehrpunkten basiert, ist eines der fortschrittlichsten Tools für den Handel auf den Finanzmärkten. Es bietet Händlern die Möglichkeit, schnell auf Marktveränderungen zu reagieren und die zukünftige Richtung der Preisbewegung genau vorherzusagen. Der Indikator basiert auf der Verwendung moderner Algorithmen und Technologien, mit denen Sie schnell die Preisumkehrpunkte auf dem Diagramm berechnen können. Jeder Punkt wird durch einen Pfeil angezeig
Einführung von BreakOut Consult, dem revolutionären Werkzeug, das Ihr Trading auf die nächste Stufe bringt! Unser hochmoderner Algorithmus kombiniert mehrere Trends und Oszillatoren, um genaue Kauf- und Verkaufssignale zu generieren, was es zu einem leistungsstarken Werkzeug für jeden Trader macht. Mit BreakOut Consult können Sie mit Hilfe unseres dynamischen Kanals, der Widerstands- und Unterstützungsniveaus verwendet, um Durchbrüche zu erkennen, leicht Ausbrüche auf dem Markt identifizieren.
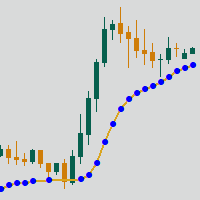
Adaptive Moving Average (AMA) is a trend indicator using moving average and market noise filter. Indicator feature are blue and red points, showing the power of trend. Recommendations for trading: Auxiliary Indicator Detecting trend Detecting power of trend Detecting potential reversal points Main indicator Shows entry points for swing trading Serves as dynamic support and resistance Recommendations for use: Any instrument Any timeframe Input parameters: Period - AMA period Fast Period - fast
FREE

The Go Master trend indicator finds the current trend based on many factors. A simple and convenient indicator. The user can easily see the trends. It uses the basic trading approach widely described in the trading literature.
This is the first indicator designed to detect fluctuations in the direction of the trend and possible reversals. It works using a special algorithm and a set of internal indicators. You can use this indicator alone or in combination with other indicators according to y
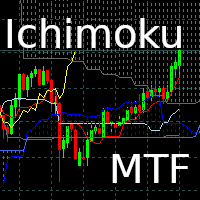
Ichimoku Hinko Hyo MTF
Ichimoku Hinko Hyo MTF is a Multi Time Frame indicator. It allows to overlap several ichimoku indicators (from different timeframes) on the same chart.
Doing this allows a better read of the market as informations are directly available to user.
It is possible to select different curves to be displayed (Tenkan, Kijoun, Chikou, Kumo)
In this version 1.0, it is possible to
On M1 chart, overlap M5 and M15 indicators.
On M5 chart, overlap M15 and H1 indicators.
On M15
The indicator is a complex of MACD and OsMA, built according to the complex of several popular oscillators. This combination allows you to get the best out of both types of indicators. On the one hand, a quick response to changes in the market environment, on the other hand, effective market following and noise filtering. The indicator values on a fully formed candle are not redrawn.
FREE
This indicator combines the best features of a trend indicator and an oscillator. Effective trend detection and short-term price fluctuations.
Operating principle: The indicator analyzes price direction using one of many standard oscillators. If the oscillator indicates a change in the direction of price movement, the indicator signals this by placing a small arrow on the chart opposite the bar on which the oscillator gave the corresponding signal. At the same time, the main signal of the indi
FREE
The indicator colors candlesticks of the price chart in accordance with the data of two CCI indicators from different timeframes. If both CCI indicators are above 0, the indicator paints the candle in the color that signals about price growth, and vice versa. The indicator allows to efficiently follow the trend, track short-term price rollbacks, and also to identify price reversals. The indicator does not redraw.
Settings CCI1_Period ( >1) - period of the fast CCI osc; CCI1_Price - price of th
FREE
The presented indicator displays in the form of colored candles the signals of the intersections of four RSI indicators of different periods. The candle turns red when the values of the first indicator are less than the values of the second indicator and the values of the third indicator are less than the values of the fourth indicator. The candle turns blue when the values of the first indicator are greater than the values of the second indicator and the values of the third indica
FREE
The indicator analyzes the divergence of the current price with the Laguerre filter data. Indicator signals: Blue dot - short-term transactions to buy an asset are allowed. Red dot - short-term transactions to sell the asset are allowed. A big blue signal - if the price breaks the high of the bar on which the signal was given - a medium-term buy trade is opened. A big red signal - if the price breaks the low of the bar on which the signal was given - a medium-term sell trade is opened. The indic
FREE
This indicator colors candles in accordance with the projected price movement. The analysis is based on the values of the classic Stochastic Oscillator. If the main line of the Stochastic Oscillator is above the signal line and above the oversold level - the candlestick is painted in color that signals a price growth; If the main line of the Stochastic Oscillator is below the signal line and below the overbought level - the candlestick is painted in color that signals a price fall. The indicator
FREE
This indicator displays the signals based on the values of the classic DeMarker indicator on the price chart. The DeMarker indicator can be used for determining the overbought or oversold areas on the chart. Reaching these levels means that the market can soon turn around, but it does not give signal, as in a strong trend the market can stay in the overbought or oversold state for quite a long time. As with most oscillators, the signals are generated when leaving these areas. This indicator all
FREE
Intelligent ZigZag indicator.
It has only two settings. The higher the values, the more significant extreme values it shows.
Application area.
To determine the trend. Line drawing direction.
To recognize multiple patterns.
If you put two indicators on one chart with fast and slow values. By changing the color of one of them, you can very well decompose the price movement into waves.
The indicator can be a great helper for marking the chart and identifying the key levels from which t

All traders wait until the market calms down and only after that will they enter the market. They look at the monitor all the time. Now you no longer need to follow this, your best assistant will do it for you. You go about your usual business and calmly wait for the signal. And as soon as the spread reaches the value you set, you will receive an instant notification on your phone.
The indicator displays elements of the trading system, name trading in the zone, described by Bill Williams. Sell signals are formed when MACD and OsMA values are falling simultaneously (Bill Williams calls these indicators АО and АС in his book), while buy signals appear when both indicators are rising. The indicator signals are confirmed when the price exceeds the High/Low of the bar where the indicator generated the signal. The indicator is intended for trend trading. Countertrend signals are
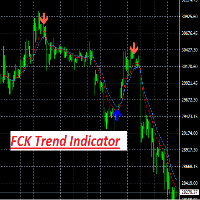
FCK Trend Indicator is an indicator for determining the current direction of price movement and reversal points. The indicator will be useful for those who want to see the current market situation better. The indicator can be used as an add-on for ready-made trading systems, or as an independent tool, or to develop your own trading systems. FCK Trend Indicator indicator, to determine the reversal points, analyzes a lot of conditions since the combined analysis gives a more accurate picture of t
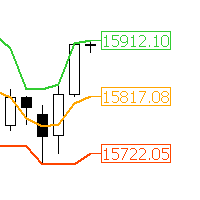
"AV Donchian Channel" ist ein Indikator für den MetaTrader 4, welcher die aktuellen Preise des Donchian Channels und der Mittellinie anzeigt.
Es können mehrere AV Donchian Channel Indikatoren in einen Chart gelegt werden. Die Mittellinie kann zum trailen benutzt werden.
Siehe auch Turtle Trader Strategie von Richard Dennis.
Einstellungen:
- Donchian Channel Periode
- Farben und Stärken der Linien
- Farben und Stärken der Preismarken
Bitte berichtet mir Fehler.

Considering the main theories of Forex (Dow Theory, support lines, chart patterns, and Fibonacci retracements), It tells you the price range where whales (large investors) are likely to appear. You can trade at the price points that professionals also aim for. You no longer have to warry about where to aim next.
We are live-streaming the actual operation of the system. Please check for yourself if it is usable. Please check it out for yourself. https://www.youtube.com/@ganesha_forex
We do no
The indicator displays elements of the trading system, name trading in the zone, described by Bill Williams. Sell signals are formed when MACD and OsMA values are falling simultaneously (Bill Williams calls these indicators АО and АС in his book), while buy signals appear when both indicators are rising.
The values of AO and AC are falling - the candle is colored red. Values of AO and AC are growing - the candlestick is colored green. In other cases, the candle is colored gray.
The indic
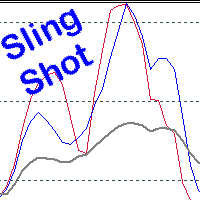
Scalping, Mean reversion or Position trading strategy
Get into an established trend on a pullback in the market. Use the Pinch in the indicator for profit taking. Use the Pinch as a mean reversion strategy, scalping back to a moving average line.
Input Parameters Fast Sling Shot configuration. Slow Sling Shot configuration. Dual Sling Shot configuration. Price line configuration. Trigger zones or levels. Example of Sling Shot trade idea: Price line sets the mood, below the baseline le

This Indicator is based on Mr. Dan Valcu ideas.
Bodies of candles(open-close) are the main component used to indicate and assess trend direction, strength, and reversals.
The indicator measures difference between Heikin Ashi close and open.
Measuring the height of candle bodies leads to extreme values that point to trend slowdowns. Thus quantifies Heikin Ashi to get earlier signals.
I used this indicator on Heiken Ashi charts but, it's possible to choose to calculate Body size based on
FREE

Wicks UpDown Target GJ
Wicks UpDown Target GJ is specialized in GJ forex pairs.
Choppy movement up and down on the opening range every day. Trading breakouts on London session and New York session is recommended.
Guideline Entry Strategy Idea:
Step 1 - Breakout Forming (Warning! Trade on London Session and New York Session) Step 2 - Breakout Starting (Take Action on your trading plan) Step 3 - Partial Close your order & set breakeven (no-risk) Step 4 - Target complete Step 5 - Don't tr
FREE

Fibonacci Currency Strength Meter (FCSM) Early Access Sale!!
This new product is still in the process of adding new features and settings. For early bird buyers. The Price will be 50% Sale. In a few weeks, the product will be done. Go Grab your copy while it's still cheap. More details will be added soon. Things to be added. Alert Levels Mobile and Email Alert
From it's name, Fibonacci Currency Strength Meter is a combination of Fibonacci levels and Currency Strength Meter. The plot of Fib
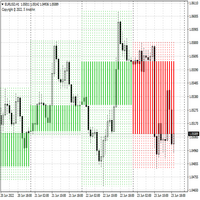
Aligning higher time frames for trading One of the main concepts behind the beginner strategy is multiple time frame analysis – using a higher time frame to determine the overall market direction and executing trades on a lower time frame. By determining the overall direction on a higher time frame and trading in that direction, you make sure that you trade in the direction of the overall trend – this increases your chances of profitable trades. In the beginner strategy, you use the 30 minute ch
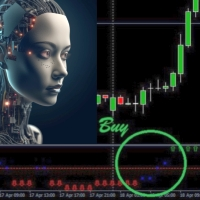
Introducing Trend Fusion 444F, a powerful MQL4 indicator designed to determine market direction using multiple trading indicators. This comprehensive tool offers a unique fusion of technical analysis techniques that help traders make informed decisions in various market conditions. Key Features: Comprehensive Analysis: Trend Fusion 444F combines several widely-used trading indicators to provide a multi-dimensional view of the market. The indicators include Moving Averages, MACD, RSI, DeMarker,

This is an indicator of trading sessions that can display all levels (Open-High-Low-Close) for four sessions. The indicator can also predict session levels. Sessions can be drawn with lines or rectangles (empty or filled), lines can be extended to the next session. You can easily hide/show each session by pressing hotkeys (by default '1', '2', '3', '4'). You can see ASR (Average Session Range) lines (default hotkey 'A'). This is similar to the ADR calculation, only it is calculated based on t
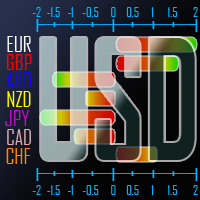
Versus USD berechnet die Preisänderung jeder wichtigen Währung gegenüber dem USD und zeigt eine klare und vergleichende Ansicht ihrer Leistung für jeden Zeitraum oder Balken, der durch den Cursor im aktuellen Zeitrahmen des Diagramms mit Fortschrittsbalken indiziert ist. Darüber hinaus markiert es einen Pfeil auf dem Balken/Zeitraum, in dem die betreffende Währung die höchste oder niedrigste Veränderungsrate gegenüber dem USD im Vergleich zu anderen Währungen erlebt hat, wodurch eine genauere Me

Forex 3D ist ein fertiges Handelssystem zum Scalping für jedes Währungspaar. Empfohlener Zeitraum M5. Die durchschnittliche Anzahl der Transaktionen, die wir jeden Tag eröffnen können, liegt zwischen 5 und 15. Dieses Handelssystem eignet sich für den Handel mit allen Währungspaaren, einschließlich Gold und Silber. Forex 3D ist ein sehr einfaches Handelssystem, das für Forex-Anfänger geeignet ist. Es erfordert keine zusätzliche Marktanalyse mit anderen Handelsinstrumenten. Wir können uns ausschl
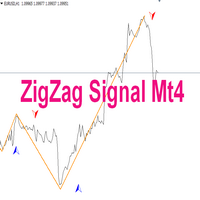
Indicator description: Indicator - ZigZag Signal is created on the basis of a well-known and popular indicator - ZigZag. The indicator can be used for manual or automatic trading by Expert Advisors. 1. The ZigZag Signal indicator has alerts of different notifications for manual trading. 2. If used in Expert Advisors, the indicator has signal buffers for buying and selling. You can also prescribe and call the indicator as an external resource and other settings and applications: (email me in a

With PA analyzer you will see a different perspective of price action , once you have unlocked the full potential of it, this tool will be essential part of your trading system. PA Analyzer enables market price analysis and automatically marks support and resistance in all time frames. This indicator makes it easy to see whether the price is in range or trend, and generates dynamic profit take targets for the current time frame and the next higher time frame. This allows you to find target co

"Sentiments of traders" in the financial markets is a topic that has been of interest to us for a long time. In time, we could not find the right formula to define these sentiments. We went through many stages in the search for the right methodology - from taking data from external sources to calculate open positions of buyers and sellers to calculating tick volumes, but still we were not satisfied with the results. The calculation of open positions of buyers and sellers from external sources ha

Introducing our A.I Currency Strength Meter Forex Indicator, a state-of-the-art tool designed to provide forex traders with real-time insights into the strength of various currencies. Leveraging the latest advancements in artificial intelligence and machine learning, this innovative indicator analyzes market data in real-time, providing users with accurate and up-to-date information to inform their trading decisions. In addition to its cutting-edge algorithms, the Currency Strength Meter Forex I
Gravitas indicator – High quality / Non-repainting Signals for day trading
If you are sick and tired of not being profitable each month or you simply want a safe earning while you are studying the markets or while you practice and master your strategy give this indicator a try. I called this indicator “Gravitas” as indication of seriousness and importance that trading is for me and respect for the market and the other traders involved in it. I developed it last

Fibonacci automatically draws Fibonacci retracement, Because Fibonacci automatically draws Fibonacci retracement, you can know at a glance the price to buy at a push or sell back. Therefore, you can trade in favorable conditions in a trending market.
We are live-streaming the actual operation of the system. Please check for yourself if it is usable. Please check it out for yourself. https://www.youtube.com/@ganesha_forex
We do not guarantee your investment results. Investments should be mad

[ MT5 Version ] [ Order Blocks ] [ Kill Zones ] [ SMT Divergences ] How to trade using Order Blocks : Click here User Interface Performance: During testing in the strategy tester, the UI may experience lag. Rest assured, this issue is specific to the testing environment and does not affect the indicator's performance in live trading. Elevate your trading strategy with the Order Blocks ICT Multi TF indicator, a cutting-edge tool designed to enhance your trading decisions through advanced orde

Introducing the "Extreme Exhaustion Levels": A powerful tool for traders looking to identify market exhaustion and potential trend reversals. The Exhaustion Indicator is an advanced technical analysis tool that helps traders identify when markets are overbought or oversold, potentially indicating an imminent reversal in the trend. With a unique combination of price action, moving averages, and Bollinger Bands, the Exhaustion Indicator provides traders with a comprehensive view of market conditi
FREE

after getting indic ator cont act me for Bonus E a. Non Repaint TMA channel with special conditioned arrows on price cross of channel lines plus market Volatility factor, which makes product much more accurate than any usual tma channel indicators. It is proven to be profitable with Ea built based on it which you will get as a BONUS in case of indicator purchase. Good luck.

The chart pattern is automatically drawn. It also automatically tells you the price at which you are most likely to buy or sell according to the pattern. Therefore, there is no need to memorize patterns or draw lines by yourself.
We are live-streaming the actual operation of the system. Please check for yourself if it is usable. Please check it out for yourself. https://www.youtube.com/@ganesha_forex
We do not guarantee your investment results. Investments should be made at your own risk. W
Double Smoothed Stochastics – DSS Bressert is an oscillator introduced by William Blau and Walter Bressert. The calculation of DSS Bressert values is similar to the stochastic indicator. The confirmation of the indicator's signal is the overcoming by the price of the high/low of the bar on which the signal was given by the indicator.
Settings: Price - the price at which the indicator is calculated; EMA_Period - smoothing period; Stoch_Period - oscillator period;
OB_Level - overbought level;
FREE

You can change the time period of the chart at the touch of a button. You can also change multiple charts at the touch of a button. You can also change multiple charts at the touch of a button, saving you the trouble of changing time periods.
We are live-streaming the actual operation of the system. https://www.youtube.com/@ganesha_forex
We do not guarantee your investment results. Investments should be made at your own risk. We sharll not be liable for any disadvantage or damage caused by
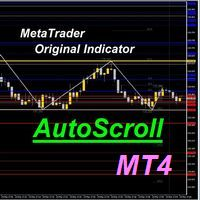
AutoScroll automatically scrolls the chart by the set width (pips). You can see the next milestone without having to operate the chart yourself. You can concentrate on trading.
We are live-streaming the actual operation of the system. Please check for yourself if it is usable. Please check it out for yourself. https://www.youtube.com/@ganesha_forex
We do not guarantee your investment results. Investments should be made at your own risk. We sharll not be liable for any disadvantage or damage
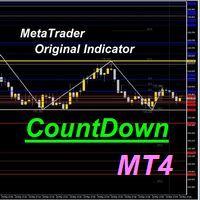
The time until the end of the bar is counted down. Therefore, you can time your order while watching the chart. You can concentrate on your trading.
We are live-streaming the actual operation of the system. Please check for yourself if it is usable. Please check it out for yourself. https://www.youtube.com/@ganesha_forex
We do not guarantee your investment results. Investments should be made at your own risk. We sharll not be liable for any disadvantage or damage caused by the use of the in

The system automatically draws resistance and support lines, The system automatically draws resistance and support lines, so you can see at a glance the price range where you are most likely to encounter resistance. Therefore, you can trade in price zones where you are less likely to encounter resistance.
We are live-streaming the actual operation of the system. Please check for yourself if it is usable. Please check it out for yourself. https://www.youtube.com/@ganesha_forex
We do not guar

Based on the Dow Theory, the system automatically draws a turning point, which is the starting point for buying or selling. It also automatically tells you whether the market is in a buying or selling condition and recognizes the environment. It is also a good tool to prevent false trades and to make profitable trades.
We are live-streaming the actual operation of the system. Please check for yourself if it is usable. Please check it out for yourself. https://www.youtube.com/@ganesha_forex

Fractal Advanced - displays Fractal and Alligator indicators on the price chart. Has wide options for settings and customization. It is also equipped with alerts and a hotkey system. Manual (Be sure to read before purchasing) | Version for MT 5 Advantages
1. The indicator does not fill the entire chart with fractals, but allows you to display only relevant signals. 2. The number of fractals is adjusted by scrolling the mouse while holding down the Shift key. 3. Instantly show/hide the Alligato
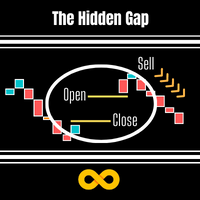
This Indicator is based on the Indice gaps between todays open price and yesturdays closing price. On Metatrader these are not shown as we only see a 24hr chart. If we want to know the gap between the open at 16:30 and yesturdays close at 23:30 on the SP500 this EA will reveal the gap. On Indices these types of Gap close approximately 60% of the time within the same day and is demonstrated on the panel which records previous gap closures and provides to the user a statistical proof of gaps clos
Check My Product
Contact me to discover all my services
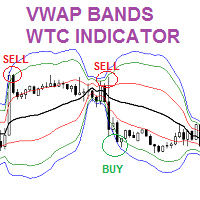
The VWAP Volume weighted Average Price Bands indicator is similar to the Moving Averages and Bollinger bands. In this indicator, more weight is given to the volume. The indicator provides great insight on support and resistance levels in the chart. Moreover, the indicator shows the fair value of a trading instrument. Thus, enabling forex traders to identify great trading opportunities to BUY LOW and SELL HIGH. Forex traders can combine

Introducing Daily Hedge - Your Advanced Custom Hedge System for Forex Trading Unleash the Power of Daily Hedge - Your Ultimate Trading Companion Experience the next level of trading sophistication with Daily Hedge, an advanced custom hedge system designed to revolutionize your Forex trading experience. With its cutting-edge features and intelligent algorithms, Daily Hedge empowers you to make informed decisions and seize profitable opportunities like never before. Unlocking Advanced Trading Str
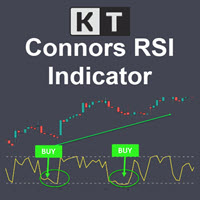
KT Connors RSI is a modified and more advanced version of the original Connors RSI developed by Larry Connors. It was designed to help traders generate trade signals based on short-term price movements.
The Connors combine the standard RSI calculation with two additional elements: a short-term RSI, ROC, and a moving average.
Features Provides more transparent and more actionable buy and sell signals using the overbought/oversold zones. Incorporates short-term RSI and moving average, provid

Check My Product Contact me to discover all my services
Supply and demand zones are one of the most basic things a beginner forex trader learns. These zones are so important, price reacts off of them even after years since they first developed. And with the supply and demand zones indicator, a forex trader might not need to worry about drawing all these historical zones one after the other.
The supply and demand zone indicator accurately draws the supply and demand zones of a currency pair

If you are using naked eyes to find candlestick patterns on your chart it's a good thing but it requires your time and attention and still you miss some patterns here and there. Don't worry! This indicator will help you to find "Harami Candlestick Pattern" on your chart very easily. *Note: Default inputs are set for EURUSD H1 (1 hour) timeframe. This is an alert system which gives you alerts whenever harami candlestick pattern happens. Types of alerts it can give you are: 1. Audible Alerts -
What you get upon purchase:
-Lifetime support for the use of the system - Easy to use, clean user friendly interface with no single settings required - Arrow Signals showing where to buy and sell -Visual Arrows, Sound Alert, Email and sms alert functionalities - Customizable colors and sizes -Lifetime Updates - Both Trend and breakout signals -Appropriate signals for both Entry levels, Take profit levels and stop loss Preferred timeframe is 15 MINUTES ACCURATE SIGNALS WITH SIMPLE AND USER

GPT Candlestick T he Indicator show algorithm of Candlestick Automatically. GPT Candlestick is a MetaTrader 4 Indicator that uses a proprietary algorithm based on Price of Moving Average and Average True Range to show the Color of Candlestick on your trading. Means candlestick is going Up or Down (View Simply). I nstead, it analyzes data of market and identify entry points and opportunities. I t's also a trading tool that be used to practice and enhance your manual trading skills. GPT Candlestic
This is a MACD indicator which displays an up-arrow/down-arrow on the main chart window when MACD line cross zero and signal line. 1) The arrows on the main chart are very useful to traders because it will draw trader's attention to change of trend or momentum instantly. 2) It is definitely easier and faster than looking at the sub-window at the bottom of the screen. It is an important tool for MACD strategy. 3) User can opt for displaying the MACD cross Signal arrows which are in line with the
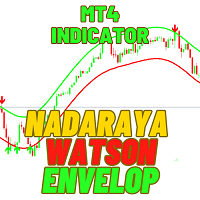
The Nadaraya Watson Envelope is a technical indicator available in the MetaTrader 4 (MT4) platform. It uses a non-parametric method to estimate the underlying trend of a financial asset based on its past price movements. The envelope is created by calculating a weighted average of the asset's past prices, with more recent prices being given greater weight. This produces a smooth curve that represents the estimated trend of the asset. The envelope is then drawn around this curve, with upper and l

Der "BIG FIGURE INDICATOR" erkennt automatisch bestimmte Ebenen auf Preisdiagrammen und zeichnet horizontale Linien, wie z.B. ganze Zahlen oder halbe Zahlen (z.B. 1,0000 oder 1,5000 im Devisenhandel). Diese Ebenen gelten als psychologisch bedeutend, da sie runde Zahlen darstellen, auf die große Trader und Investoren sich konzentrieren können, was zu potenziellen Unterstützungs- oder Widerstandsniveaus führt. Der "big figure indicator" kann Händlern helfen, wichtige Preisniveaus zu identifiziere
FREE
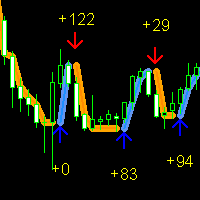
Forex Gump Signal ist ein neuer Indikator aus der ForexGump-Serie. Dieser Indikator bestimmt im Gegensatz zu anderen die Preisumkehrpunkte mithilfe einer mathematischen Berechnung der Geschwindigkeit eines standardmäßigen gleitenden Durchschnitts. Wenn sich die Bewegungsgeschwindigkeit verlangsamt, interpretiert der Indikator dies als Signal für eine Trendumkehr. Dadurch kann der Indikator selbst die kleinsten Preisumkehrpunkte erfassen. Damit der Indikator mit der Analyse größerer Umkehrpunkte
MT4 Indicator Loop voor op de curve met de Wamek Trend Consult indicator. Ontworpen om vroege en voortzettende trends te identificeren, stelt deze krachtige tool handelaren in staat om op precies het juiste moment de markt te betreden, gebruikmakend van krachtige filters om het aantal valse signalen te verminderen en de nauwkeurigheid van uw transacties te verbeteren. Door markttrends nauwkeurig te analyseren en valse signalen uit te filteren, met behulp van geavanceerde algoritmen en ongeëvena

Wave Reversal Indicator - determines the direction of trend waves and price reversals.
The indicator shows wave movements and trend directions. It gives recommendations where to follow the trader, helps to follow the trading strategy.
It is an addition to an intraday or medium-term strategy.
Almost all parameters are selected for each time frame and are changed automatically, the only parameter for manual adjustment is the wavelength.
Works on various trading instruments and timeframes, rec
FREE

Big summer sale. Save up to 40% on my products. Supply & Demand dashboard - save 10$! The Netsrac Supply&Demand Dashboard shows you at a glance where relevant zones are located on your favorite assets. Open your chart directly from the dashboard and trade zones that really matter. Features
Finds the next relevant supply and demand zone and displays the distance to this zone (in pips) Finds and displays the zones in three different timeframes Calculates a trend indicator for the current and past

Contact me after payment to send you the User-Manual PDF File.
Double Top/Bottom Pattern
Double top and bottom patterns are chart patterns that occur when the underlying investment moves in a similar pattern to the letter "W" (double bottom) or "M" (double top). Double top and bottom analysis are used in technical analysis to explain movements in a security or other investment, and can be used as part of a trading strategy to exploit recurring patterns. Searching for this pattern among the c
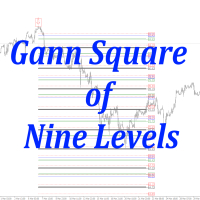
The only one of its kind square 9 indicator that corresponds to the real situation on Gannzilla! The indicator calculates price levels by Square 9 and dates by Square 9. All price and time levels are 100% consistent with the location on Square 9 (Gannzila). This tool will be a great solution for determining the price and time levels using the methods of the legendary trader William Delbert Gann.
The Volume com indicator is an indicator in which the price movement control mode is organized using tick volumes. Volume com indicator gives signals that can be filtered and get a good result The main advantage of the signals of this indicator is that they appear both at the end of the trend and along its course. The indicator works on all timeframe. The first indicator in the series .

The Volume Str indicator is an indicator based on tick volumes. The very name of the indicator "Volume Street" indicates the use and sorting of volumes. according to a certain algorithm, which leads to a good result at the output. Look at the screenshots and you will see what signals it gives. The indicator does not redraw and you can use its signals after the first bar closes.

Volume mag indicator is another indicator that is used to calculate entry points tick volume. The indicator rarely gives a signal, but this can be said to be its advantage. The indicator's signals are not redrawn and do not lag, but are issued after the close of the current candle. The indicator does not overload the terminal and calculates entry points within the BarsCount value, which is set in the menu, by default 500 bar.
The Volume New indicator is the main indicator for calculating direction of price movement by tick volumes. The indicator generates the maximum number of signals that it is possible to filter according to your strategies. The indicator does not redraw or lag and generates a signal according to the settings SIGNALBAR values, default 1 - after the close of the current candle. The number of history bars for calculation is set in the indicator menu by the value BarsCount, default is 500 bars.

My notes is a simple indicator that will help you put any notes on your price chart. W ith one click you get as many notes as you choose from the menu. All blanks for your entries are lined up in one column. You only need to move the records to the right place on the graph and click on the record. The menu consists of four items: My_sum_Note number of entries , default 5 ; MyMessage Font font name, default "Arial"; MyMessage FontSize font size, default 10; MyMessageColor is the font color, Black
FREE
MetaTrader Market - Handelsroboter und technische Indikatoren stehen Ihnen direkt im Kundenterminal zur Verfügung.
Das MQL5.community Zahlungssystem wurde für die Services der MetaTrader Plattform entwickelt und steht allen registrierten Nutzern der MQL5.com Webseite zur Verfügung. Man kann Geldmittel durch WebMoney, PayPal und Bankkarten einzahlen und sich auszahlen lassen.
Sie verpassen Handelsmöglichkeiten:
- Freie Handelsapplikationen
- Über 8.000 Signale zum Kopieren
- Wirtschaftsnachrichten für die Lage an den Finanzmärkte
Registrierung
Einloggen
Wenn Sie kein Benutzerkonto haben, registrieren Sie sich
Erlauben Sie die Verwendung von Cookies, um sich auf der Website MQL5.com anzumelden.
Bitte aktivieren Sie die notwendige Einstellung in Ihrem Browser, da Sie sich sonst nicht einloggen können.