Neue technische Indikatoren für den MetaTrader 4 - 71
Binary Options Assistant (BOA) COLD Signals Indicator provides signals based on Amalia Trader Binary Options Strategy. Indicators: Keltner & Stochastic
Stop missing trades, stop jumping from chart to chart looking for trade set-ups and get all the signals on 1 chart! U se any of the BOA Signals Indicator with the Binary Options Assistant (BOA) Multi Currency Dashboard . All BOA Signal Indicator settings are adjustable to give you more strategy combinations. The signals can be seen visually an
Binary Options Assistant (BOA) BURN Signals Indicator provides signals based on Ana Trader Binary Options Strategy. Indicators: MACD & Stochastic
Stop missing trades, stop jumping from chart to chart looking for trade set-ups and get all the signals on 1 chart! U se any of the BOA Signals Indicator with the Binary Options Assistant (BOA) Multi Currency Dashboard . All BOA Signal Indicator settings are adjustable to give you more strategy combinations. The signals can be seen visually and hea
Binary Options Assistant (BOA) CHILL Signals Indicator provides signals based on Katie Tutorials Binary Options Strategy. Indicators: 3 Moving Averages & RSI Stop missing trades, stop jumping from chart to chart looking for trade set-ups and get all the signals on 1 chart! U se any of the BOA Signals Indicator with the Binary Options Assistant (BOA) Multi Currency Dashboard . All BOA Signal Indicator settings are adjustable to give you more strategy combinations. The signals can be seen visual

Implements an oscillator based on a simple comparison of the last two moving average values with improved functionality. As a result, the graph displays the delta of the two moving average values. In the case of a single value, the moving delta is calculated relative to the last two candles, which price of comparison will be specified in the Price parameter. The delta of two values is often used to determine the trend, depending on the length of the moving averages, it can be a longer or sh

The indicator determines the trend and draws arrows in the direction of the transaction.
Non-repaint!
By default, the recommended parameters are set, provided that the H1 timeframe is used.
Period parameter is the main parameter that calculates the arrows.
Frequency parameter is responsible for the frequency of signals.
Bars of calculating parameter is responsible for the number of bars on which the arrows are displayed.
It is recommended to adjust the indicator for each pair and period

The QRSI indicator is one of the most important and well-known indicators used by traders around the world. By its nature, the QRSI indicator is an oscillator, that is, it fluctuates in a certain zone, limited by the maximum (100) and minimum (0) values. Specifically, this indicator works according to an accelerated algorithm, but this is not its only difference. This indicator implements a more advanced calculation based on the Relative Strength Index algorithm. The peculiarity of the implemen

The indicator checks the trend and draws arrows in the direction of the transaction.
Recommended parameters are set by default.
The Signal mode parameter is responsible for confirming the signal. Live - signal without confirmation On bar close - confirmation signal after closing the current candle (non-repainting)
The indicator is designed for any pairs. Recommended pairs:
EURUSD, AUDUSD, USDCAD, USDCHF, USDJPY, NZDUSD, GBPUSD
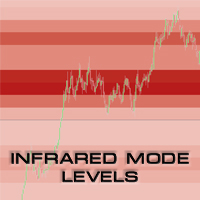
UPDATE 3 - Scan what you see - the indicator will scan and draw levels for all VISIBLE bars on the chart, rather than Current Bar - till first visible bar on the chart (historical bar on the left side). Assumption is, if you are going back in history and you want to check levels, you care about that specific moment in time and what the levels were during that moment (excluding data of the future which is not visible). UPDATE 2 - version 2.1 introduces the "Always ON" feature. If enabled, you ca

RSI Scanner, Multiple Symbols and Timeframes, Graphical User Interface An indicator that scans multiple symbols added from the market watch and timeframes and displays result in a graphical panel. Features: Multi symbol Multi timeframe Alerts and Notifications Live Monitoring Sorting modes One click to change symbol and timeframe Inputs for RSI and scanner settings
FREE

Binary Options Assistant (BOA) Multi Currency Dashboard for Binary Options (MT4) .
You can use any of the BOA Signals Indicators with the dashboard. Just change the BOA Signals Indicator Name in the dashboard settings to the indicator you want to get signals from. For example: CHILL.
BOA_BURN_Indicator_v1 Strategy : Ana Trader Binary Options Strategy (MACD & Stochastic)
BOA_COLD_Indicator_v1 Strategy : Amalia Trader Binary Options Strategy (Keltner & Stochastic)
BOA_CHILL_Indicator_v1

Индикатор содержит 3 RSI с возможностью выбора рабочего таймфрейма, периода и параметра сглаживания каждого. Не перерисовывает начиная с 1 бара. При задании параметра сглаживания большего 1 показания будут обработаны специальным образом, для исключения мелких колебаний. Возможно использовать в качестве готовой торговой системы, где показания старших ТФ определяют тренд, а младший используется для поиска точек входа, в качестве примера может служить система Дмитрия Брылякова https://www.infoclub
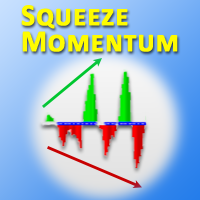
This is the MetaTrader version of the very popular Squeeze Momentum indicator. It is based of of John Carter's TTM Squeeze volatility indicator, as discussed in his book Mastering the Trade. With this version you can enable notifications when a squeeze is released (push notification, email, or pop-up message). Strategie
Grey dots indicates a squeeze in the current timeframe. Blue dots indicates that the squeeze is released. Mr. Carter suggests waiting till the first blue dot after a

The Pivot Dashboard is a multicurrency Dashboard that indentifies the Pivot prices and tells the user if they were tested or not. With this Dashboard you will be able to change (Symbol/Timeframe (M15,H1,H4)) immediately with just one click. It is also possible to visualize the Pivot Price clicking on the Pivot Button. The Dashboard can also be Minimized and Closed.
IMPORTANT ALL SYMBOLS THAT THE USER PUTS ON THE DASHBOARD MUST ALSO BE IN THE MARKETWATCH:
With the new Feature,that were added
The avatar indicator is one of the most powerful current indicators in the forex and binary options market. The indicator works on all pairs and all time frames, and the indicator has certain conditions in order to avoid loss and achieve 95% profits from it. The conditions are: Avoid volatility markets Avoid flat and casual markets I work in the trend markets, the market is moving in a trend, and you are able to determine the direction of the trend, where is it Make time for yourself to work in,
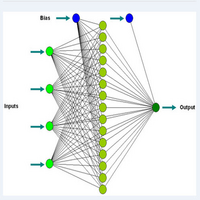
Aktualisieren! Den Ebenen 100 und 200 wurden Pfeile hinzugefügt.
Dieser Indikator ist genau für den Zugang zu Extremen und Unterstützungen für Kaufpositionen, hauptsächlich für 1-Minuten-Zeitrahmen. Andere Zeitrahmen können verwendet werden, aber die Ebenen sind unterschiedlich. Es ist ein besserer Oszillator und vergleicht sich mit anderen, um den Unterschied zu sehen.
Tageshandel mit neuronalen Netzwerkkonzepten. Dieser Indikator verwendet elementare Formen von Neuronetzwerken, um Kauf- und
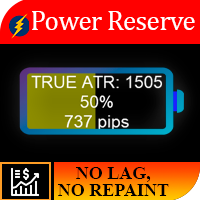
Arbeitslogik Die Bedeutung dieses Indikators liegt darin, dass Sie erkennen können, wie viel „Brennstoff noch auf dem Instrument ist“. Stellen Sie sich die Situation vor, Sie haben ein Auto mit halb entladener Batterie verlassen, im Durchschnitt reicht diese Energiemenge normalerweise für ein Auto für 250 km, wenn Sie also möchten, können Sie eine Strecke von 700 km nicht überwinden. Für jedes Instrument gibt es also eine bestimmte tägliche Preisbewegung, und als Ergebnis statistischer Beobacht

Wenn Sie dieses Projekt mögen, hinterlassen Sie eine 5-Sterne-Bewertung. Der Handel mit großen Volumina erfordert, dass wir mehrere Instrumente/Charts
betrachten
neue Möglichkeiten zu finden, wird dieser Indikator Ihnen helfen, indem Sie
spezifische
Ebenen durch das Vielfache einer Anzahl oder deren Suffix und aktualisieren sie
automatisch
als sich der Preis ändert, eine Aufgabe, die sonst mühsam wäre. Zum Beispiel, auf GBPUSD, könnten Sie 4 Instanzen des Indikators auf dem
Diagramm: Je 0,01
FREE
Der iPump-Indikator ist ein vielseitiger Indikator, der die Vorteile von drei Kategorien von Indikatoren kombiniert.
gleichzeitige Trenderkennung auf mehreren TFs Definition von Widerstands- und Unterstützungszonen Bestimmung von überkauften und überverkauften Zonen Anzeigefunktionen:
Einen Trend definieren Diese Funktion wird für alle Trader notwendig sein, die die aktuelle Marktrichtung objektiv einschätzen und Subjektivität vermeiden möchten. In Sekundenbruchteilen können Sie die Richtung

Description Better version of RSI indicator which offer a complete visual trading strategy and realize an auto-optimization Support: We create great tools for the entire trading community. Most of them are free. If you believe in what we do Support Us Here. KEY LINKS: How to Install – Frequent Questions - All Products How is this indicator useful? NEVER repaints. Detect best parameters of RSI indicator, based on profit factor during the specified period. This indicator can be used as

Defines extremes. This indicator consists of two parts. The first draws lines on the chart indicating low volatility in relative daily market activity. The second is responsible for determining the extremum and gives signals to buy or sell. This system is suitable for all instruments. It is recommended to use a timeframe from m15 to h4. Before using, you need to choose the settings for yourself. Configure lines deviation. Specify volatility coefficient. Advantages The indicator does not repaint
FREE

Scalping indicator. It takes into account volatility, price movement in the local interval and the direction of the current trend. Recommended timeframe - M5. Advantages: Low volatility when a signal appears ensures minimal movement against an open position. The indicator does not redraw its signals. There are alert signals. It is a great tool for day trading.
Settings: Name Description Period Indicator period Range of each bar in the period (pp.) The maximum size of each candle in the indicato
FREE

Monitors the current trend, gives signals for an uptrend, downtrend and weakening of the current trend. Colors the situation on the market with the appropriate color. Tool - any. Timeframe - any. Advantages The indicator does not repaint its signals. There are alert signals. Easy to use. Flexible settings. Suitable for trading any financial instruments. Settings Name Description Fast parameter The value of the fast parameter in the indicator (Should be less than the slow one). Slow parameter The
FREE

The indicator is based on the classic CCI indicator. I recommend watching my advisor - Night Zen EA Doesn't redraw its signals. There are alerts for the incoming signal. It contains 2 strategies: Entry of the CCI line into the overbought zone (for buy trades ) / into the oversold zone (for sell trades ) Exit of the CCI line from the overbought area (for sell trades) / from the oversold area (for buy trades)
Settings: Name Setting Description Period Period of the classic CCI indicator Price Ch
FREE

Platoon is an indicator designed to be able to detect a bottom or top similar to the Fractals indicator, but of course a different algorithm is used. In other words, you should not enter into a buy deal if the fractal is below. And you should not enter into a sell deal if the fractal is higher.
The indicator only denotes fractals on the chart without performing any additional calculations, therefore, theoretically, any trader can find these patterns by himself. But what is a fractal, how exact

Angry is a trend indicator, it indicates well the points of the beginning of the trend and its completion or reversal. This tool scans the market looking for the correct entry. Against the background of insignificant fluctuations, it is possible to identify a trend and indicate its direction. It uses only price data and analytics to calculate entry points. Does not use auxiliary indicators.
Angry captures moments of stable price movement direction. There are only three types of trend: Bullish

The Matios indicator visually unloads the price chart and saves analysis time: no signal - no deal, if an opposite signal appears, then the current deal should be closed. This is an arrow indicator for determining the trend.
According to the wave theory, Matios displays the course of the wave, while the oscillator can specify the entry point, that is, catch the price movement inside it, i.e. small “subwaves”. By correctly understanding the wave nature of price movements and using the Matios in

The Schindler indicator implements a trend trading strategy, filtering and all the necessary functions built into one tool! The principle of operation of the indicator is to automatically determine the current state of the market when placed on a chart, analyze historical data based on historical data and display instructions for further actions on the trader's screen. You need to understand that any arrow indicator is only a visual form of a signal. As a rule, such Forex indicators contain a wh

An informational indicator that displays useful information on the chart, as well as notifies you about the occurrence of any event on the market.
Indicator shows:
Broker server time Trading symbol and TF Current profit in points, percent and in the deposit currency Time until the end of the current bar Current spread size
The indicator has an alert system that allows you to signal about any event on the chart:
Price move up or down Break of any level in any direction
Signals can come in t

Delta Channel is a trend indicator by which you can set take profit for buy and sell separately by adjusting the line for each of them. Entering the market by the EURUSD symbol must be done when the price deviates from the corresponding line by 30 points on the H1 timeframe, while the take profit should be set at the level indicated by the indicator (line level), at the same time we set a stop loss in points and an arbitrary trailing -stop pull it up.
GannRS Trend Scalper GannRS is an advanced trading tool based on Gann Law and Supports and Resistances. designed to have an active trading at any time not lagging Indications are given at the beginning of a new candle
Please watch the full tutorial video.
How to use GannRS Very easy to set up... Put it on your chart Adjust inputs
Inputs Show Resistance and support : [bool] true = Shows R/S on chart false = does not show Show Levels :[bool] true = Shows levels on the chart false = does n

Pivot Pro with Alert
Pivotpunkte bieten sehr gut Marken, die sehr oft vom Preis angelaufen werden. An diesen Marken entstehen Reaktionen des Preises. Sie können hervorragend als Zielzonen genutzt werden, oder auch als Einstiege. Durch die Alarmfunktion können mehrere Charts geöffnet werden und man findet die profitablen Einstiege sehr leicht. Kein verpassen von Entry´s durch Benachrichtigung aufs Handy. In der Übersicht lässt sich Markt mit Alarme überwachen. Diese Einstellungen können verändert
This indicator is a professional Trend identifier, it measures the angle or slope of moving averages with different methods. As this indicator calculate angles you can identify the strength of trend by magnitude of angle. It also shows if angle is increasing or decreasing which gives you the opportunity to make more information about current trend. You can combine this indicator with your strategy as a filter or you can use it alone to make your trading system. This is not a repainting indicator
FREE

Broomby Indicator is a trading tool that can be used both independently and in addition to other systems.
It is recommended to use in conjunction with instruments by trading levels. It can be a great filter for opening deals.
Broomby gives 2 types of signals: preliminary and basic. The main one is more filtered, but it depends on you which one suits you best.
It can be used in both trading and options.
Number of last bars - Latest Bars to Analyze Minimum Pips Distance - Pips filter. The hi

Super Trend Button Super Trend is a trading strategy according to which one should trade Forex or Stocks when its price trend goes up, and trend goes down, expecting price movements to continue. “The trend is your friend” agree? Features - Special Button : Quick hide/show Super Trend chart. ( Make your Chart more clean and clear easily) - Color : You have the option of customising your favourite colour of Up Trend or Down Trend . - Super Trend Periods : You have the option to c
YOU ARE PUCHASING A FOREX INDICATOR THAT WAS CUSTOM BUILT IN 2021 THIS INDICATOR WILL HELP YOU FIND PRECISE ENTRIES FOR TRADES. SO HOW DOES IT WORK? 1) It looks for engulfing candlestick pattern. (It can tell if there is a bullish or bearish engulfing pattern which is a typically a reversal signal) 2) It will also look to see if price is near a short term extreme by using Bollinger Bands. 3) It combines the engulfing candle stick pattern along with Bollinger Bands to give signal 4) If price has
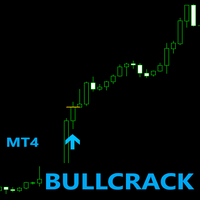
BULLCRACK MT4
*Non-Repainting Indicator/Analyzer Pick trades when it 20-30 confirmed a bull trend. No need to filter trades as every single signal has gone through multiple levels of confirmations. Strictly on buy trades . STRICKTLY FOR THE 15MINS TIMEFRAME!! Trades any pairs . *Push notifications to phone or computer * For Scalping * For Swing Trading *Arrow Appears at The "Close Of The Candle" *popup alerts* No much trades cause no random trades!
**very perfect for Expert and New Traders!
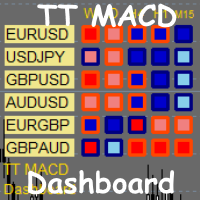
TT MACD Dashboard is multi-time frame and multi-currency market scanner. It is telling you the value of MACD and MACD histogram (a difference between MACD line and Signal line) in a form of small rectangle. If MACD value is above zero (MACD is bullish). Rectangle border color is bullish (Navy by default). If MACD value is below zero (MACD is bearish). Rectangle border color is bearish (OrangeRed by default). If MACD histogram is rising and above zero (Bullish histogram). Rectangle color is bull

Using the indicator you can 1 Identify the trend and follow the large and small trends by drawing lines. When the price leaves the corridor of the lines, then with a high probability the price will go to the next line and reverse on it. 2 Long-line - Lay lines along the centers of fractals, the indicator can detect the fractal of the second point (Number bars analysis). Often the price can approach the line even after a week or a month and you can open a reversal trade. If the wave has passed w
FREE
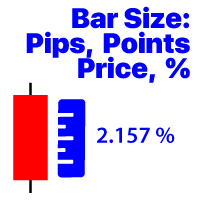
Zeigt die Änderung des zuletzt geschlossenen Balkens des ausgewählten Zeitrahmens an Preis Wert; Prozentwert (%); Pip; Marktpunkte; Meine #1 Assistant : enthält 66+ Funktionen | Kontaktieren Sie mich , wenn Sie Fragen haben Die Programmdatei muss im Verzeichnis " Indicators " abgelegt werden.
In den Einstellungen des Indikators können Sie konfigurieren: Schriftgröße; Textfarbe; Positionierung auf dem Diagramm: in der unteren linken oder unteren rechten Ecke; Ein - / Ausschalten der Anzeige der
Zur Glättung von Zeitreihen können verschiedene Fensterfunktionen verwendet werden. Fensterfunktionen können sich in ihren Eigenschaften stark voneinander unterscheiden - Grad der Glättung, Rauschunterdrückung usw. Mit diesem Indikator können Sie die Funktionen des Hauptfensters implementieren und ihre Leistung in Finanzzeitreihen bewerten. Indikatorparameter: iPeriod – Indikatorperiode. iPeriod >= 2 iCenter ist der Index der Referenz, wo sich die Mitte der Fensterfunktion befinden wird. St
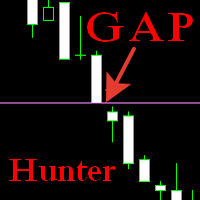
The indicator displays closed and unclosed gaps on a given timeframe and time range. By default, the display of closed gaps is disabled, the search timeframe is the current one. In the flat, it helps to track the direction of the position set by large market participants. In the trend, it shows the points of completion of the position by large market participants. Filters out false pivot points. Another point I wanted to explain, if the parameter Timeframe_for_Search is set to Current in the in
Trend Second Derivative RSI is a forex indicator based on the usual RSI, based on the second derivative of the price function. On the chart itself, trend signals will be displayed by arrows, they are filtered by the algorithm and always alternate buy / sell. It also shows the number of profitable pips that the indicator can give at the specified interval (LimitCalcHistory). The indicator has a parameter (Spread), which deducts a part of the profit per spread for each signal.
Immediately notice

This tool scans the market looking for the correct entry. You can see and evaluate it yourself, perhaps it will suit you for a number of tasks related to forecasting price movements. It uses only price data and analytics to calculate entry points. Does not use auxiliary indicators. It has two parameters for customization.
Setting the indicator. Interval - price analysis interval. Subterfuge - analysis correction interval.
The Mockingbird indicator is more interesting on long trends. A filter is required to work in flat. The border of the trend / flat value is dynamic and depends on the indicator parameters. You yourself are able to adjust it. The indicator is easy to configure. Works on all timeframes and on all instruments.
Segment - Segment of the market for analysis. Length - The number of bars to be recalculated.

Catch is a reversal indicator and is part of a special category of instruments. it not only analyzes the price movement, but also indicates the points of possible reversals. This facilitates fast and optimal opening of buy or sell orders (depending on the current situation). In this case, the historical data of the analyzed asset must be taken into account. It is the correct execution of such actions that largely helps traders to make the right decision in time and get a profit.

Technical - First of all, this is a trend indicator. Classic signal indicator. Fundamental analysis is based on data from the Economic Calendar, while technical analysis is based on indicators. It should be understood that any indicator is an algorithm that is displayed on the chart as icons. Inside it is a certain formula that calculates the information a trader needs based on past data.
Please note: the indicator does not predict the future! Even the best algorithms only summarize everything

The Story indicator predicts the most likely short-term price movement based on complex mathematical calculations. The indicator is interactive and easily customizable. This is a universal indicator, the values of which are calculated based on complex mathematical calculations. The indicator generates arrows that characterize the current price dynamics. The product can be used as a trend indicator or oscillator.
Peculiarities Estimation of the current price movement; Calculation of the curre

Matrix is a Forex arrow indicator. Displays signals simply and clearly! The arrows show the direction of the transaction, and are colored accordingly, which can be seen in the screenshots. As you can see, trading with such an indicator is easy. I waited for an arrow to appear in the desired direction - I opened a deal. An arrow formed in the opposite direction - closed the deal. The indicator also displays the lines with the help of which the arrow signals are formed, taking into account the int

O melhor indicador para o mercado forex, binárias, commodities! Não repinta ( não alterna o sinal, ocultando as percas) 100% transparente e muito eficaz. Ótimo indicador mesmo no período de notícias! Sempre aprimorando para ser o indicador mais poderoso do mercado! Com atualizações mensais... próxima atualização dia 30 de setembro de 2021 CONFIRA!!!!

The General indicator helps to analyze the market on a selected time frame. He defines the mainstream. The Forex General trend indicator provides an opportunity to classify the direction of price movement by determining its strength. Solving this problem helps investors enter the market on time and make good profits.
It does not provide real-time signals, signals arrive late. But nevertheless, it is very effective. You need to read its signals as if it were a zigzag, the principle of receiving

I present to your attention my new Bacheha indicator. Which generates signals based on the calculation of a complex algorithm. This indicator displays signals in the form of arrows on the price chart. Signals are displayed only on a fully formed candlestick. After being displayed, the signal is not redrawn.
Volatility is taken into account when calculating values. It can be used to identify overbought or oversold zones in the market. Reaching such levels indicates that the market may soon reve

The SPV Volatility indicator is one of the most effective filters. Volatility filter. Shows three volatility options. The so-called limit, real, and the last most effective filter for the filter is the percentage filter. Percentage display of folatility shows the ratio of limit to real volatility. And thus, if we trade in the middle of the channel, then it is necessary to set a condition that the percentage is less than a certain indicator value. If we trade on the channel breakout - following t

Description:
The Wall of Worry indicator allows you to assess market sentiment and possible reversals. The indicator represents three lines that are displayed in a separate window.
Black line (trend) - the amount of volumes in the candle body.
Red line (bears) - the amount of volumes in the upper shadow of the candlestick.
Blue line (bulls) - the amount of volumes in the lower shadow of the candle.
The idea is based on "Wall of Worry" - this is the periodic tendency of financial markets to
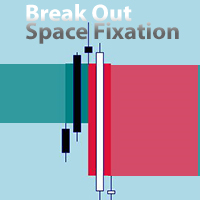
An EA version is being prepared. You can send a private message "notify about EA version".
EA will be versatile with many settings for trading on various indicators. The new EA will also allow trading on this indicator. For example, allowing signals after X signals/bars to X signals/bars in one direction, before changing direction. If Break Out happened before/after the signal of another indicator. Collect profit on each next signal above/below the previous one.
Send a private message "notify

Fully featured Pivots and Levels indicator Pivots: Floor (normal), Woody, Camarilla, Fibonacci Levels: ATR, Historical Volatility with standard deviations, Close Price Volatility with standard deviations
Features: 4 +/- levels MTF, pivots/levels based on Daily, Weekly, 4hr or even 15min Hour and minute time offset
Texts with prices and pip distances to central pivot/level Inputs for Camarilla/Fibonacci/ATR/Volatility levels
Alerts, popup, push, email, sound, live or completed candles on level c

YOU CAN NOW DOWNLOAD FREE VERSIONS OF OUR PAID INDICATORS . IT'S OUR WAY OF GIVING BACK TO THE COMMUNITY ! >>> GO HERE TO DOWNLOAD
Momentum channel is a simple momentum based system yet with a great degree of accuracy in detecting turning points. The market momentum are defined by Average True Range Channels . When price breaks these channels most times , it is an indication of a shift in market momentum and thus a possible new trend formation. The system can be traded on any time frame and
FREE

This indicator call "ATR Trend" will display 2 lines on chart, make it easy to trade buy/sell. and also Stop Loss. This Indicator's formula base on standard ATR (Average True Range) function. and I combined it with "Dow Theory" concept. It has 4 parameters. - ATR : Period of ATR it self. - ATR Multiple : Multiple value to display on chart. - Price Mode : Used this price option for check on change to uptrend or downtrend [Open, High, Low, Close, High/Low, (High+Low) / 2, (High+Low+Close) / 3 ,

This support and resistance indicator gives u a)support level b)resistance level c)direction(trend) all in one.The indicator is based on the top 3 best levels there are!Red dots are sell direction and green dots are buy direction,if candles dont break these levels u get in after the 3rd dot,always use higher time frames from h1 up so its more clear where direction is going,also u can set the indicator to your time frame that u are lookin at.
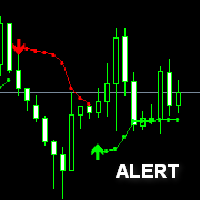
bollinger Stop Alert Indicator is one of the simplest trend-following indicators you may have ever experienced. Besides defining the market trends it also determines possible trend reversal points which are interpreted as trade signals. The bollinger stop can be applied to trade all kinds of forex currency pairs. bollinger Stop Alert Indicator suits all sorts of timeframe charts available within your forex MT4 trading platform thus supports both scalping and day trading. You can also easily cu
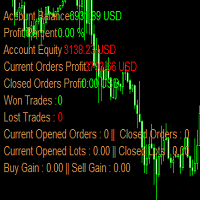
account_info_horizontal is a mt4 (MetaTrader 4) indicator and it can be used with any forex trading systems / strategies for additional confirmation of trading entries or exits.
Indicators add account information to chart. Profit, Balance, Equity, Free Margin, Margin and Margin Level %.
AccountInfo indicator can reveal all advanced features of MetaTrader 4 (above build 600). This indicator can clearly symbolize the main data of the current account (balance, equity, free margin, current Profi

Real Trend Zigzag shows the real trend of a market, u nlike the default Zigzag indicator. It calculates the trend in real time and shows green lines for upwards trends, red lines for downward trends and blue lines for no trends. Regarding the old slogan "the trend is your friend" it helps you to decide if should open a buy or sell position. MT5 Version can be found here: https://www.mql5.com/en/market/product/72065 If you are looking for a multi timeframe zigzag, take a look at the PRO vers

Real Trend Zigzag PRO shows the real trend of a market, u nlike the default Zigzag indicator. It calculates the trend in real time and shows green lines for upwards trends, red lines for downward trends and blue lines for no trends. Regarding the old slogan "the trend is your friend" it helps you to decide if should open a buy or sell position. The PRO version is a multi timeframe zigzag (MTF). Means, it shows the trend of the current timeframe as well as the trend of a higher or lower time.

What Is a Pivot Point? A pivot point is a technical analysis indicator, or calculations, used to determine the overall trend of the market over different time frames. The pivot point itself is simply the average of the intraday high and low, and the closing price from the previous trading day. On the subsequent day, trading above the pivot point is thought to indicate ongoing bullish sentiment, while trading below the pivot point indicates bearish sentimen
How to Use Pivot Points The very ess
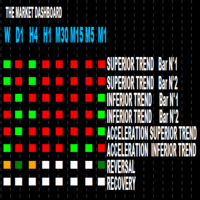
1. Access to all market in the same graphic You know exactly what happens in the market from the shortest timeframe(M1) to the biggest one (MONTH). You will see wether there is a reversal, recovery,acceleration, deceleration of the market. Therefore your decisions become more easy to take and as you are far from usual stress that traders are facing because of numerous analysis they have to do in order to enter or exit the market.
2. Features Every timeframe shows: SUPERIOR TREND BA

Wenn Sie dieses Projekt mögen, hinterlassen Sie eine 5-Sterne-Bewertung. Volumengewichtete Durchschnittspreise sind das Verhältnis des gehandelten Wertes
zum Gesamtvolumen
über einen bestimmten Zeithorizont gehandelt. Es ist ein Maß für den
Durchschnittspreis zu
die über den Handelshorizont gehandelt wird. VWAP wird häufig als
Trading-Benchmark von Investoren, die so passiv wie möglich in ihrer
Ausführung. Mit diesem Indikator können Sie die VWAP für: Aktueller Tag. Aktuelle Woche. Aktueller M
FREE

Der ADX-Indikator wird verwendet, um den Trend und seine Stärke zu bestimmen. Die Richtung des Preises wird durch die Werte +DI und -DI angezeigt, und der ADX-Wert zeigt die Stärke des Trends. Wenn +DI über -DI liegt, befindet sich der Markt in einem Aufwärtstrend, wenn nicht, ist es ein Abwärtstrend. Wenn ADX unter 20 liegt, gibt es keine eindeutige Richtung. Sobald der Indikator dieses Niveau durchbricht, beginnt ein Trend mittlerer Stärke. Werte über 40 zeigen einen starken Trend an (einen A

Wenn Sie dieses Projekt mögen, hinterlassen Sie eine 5-Sterne-Bewertung. Dieser Indikator zieht die offenen, hohen, niedrigen und schließenden Preise für
die angegebenen
und kann für eine bestimmte Zeitzone eingestellt werden. Dies sind wichtige Ebenen, die von vielen institutionellen und professionellen
Händler und kann nützlich sein, um die Orte, wo sie vielleicht mehr
aktiv. Die verfügbaren Zeiträume sind: Vorheriger Tag. Vorherige Woche. Vorheriger Monat. Vorheriges Viertel. Vorheriges Jahr
FREE

Der Indikator analysiert die Preisstruktur von Fraktalen und identifiziert mögliche Umkehrpunkte der Marktdynamik. Perfekt in Kombination mit anderen Arten von Indikatoren.
Vorteile:
Funktioniert auf allen Instrumenten und Zeitreihen, Zeichnet seine Ergebnisse nicht neu, Anpassbare Farben der Indikatorelemente, Funktioniert gut mit jeder Trendstrategie, Anpassen der Stärke von Fraktalen.
MT5 version -> HERE / Our news -> HERE
Strategy: AW Flexible Fractals is an indicator that indicates si
FREE

Description Better version of MACD indicator which offer a complete visual trading strategy and realize an auto-optimization
KEY LINKS: How to Install – Frequent Questions - All Products How is this indicator useful? NEVER repaints. Detect best parameters of MACD indicator, based on profit factor during the specified period. This indicator can be used as a visual strategy, following the recommendations of entry, stop, and targets. Indicator features It can be used as a complete trading st
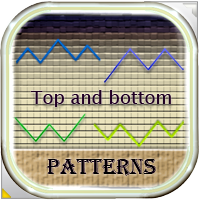
Dieser Indikator findet Umkehrmuster der technischen Analyse wie Double Bottom, Triple Bottom, Head & Shoulders und ihre entgegengesetzten Gegenstücke. Der Indikator zeigt sie auf dem Chart eines Währungspaares an und kann einem Händler signalisieren, ob sich kürzlich ein Muster gebildet hat. Auf diese Weise können Sie schnell eine mögliche Trendumkehr oder -korrektur erkennen, es reicht aus, dem Chart einen Indikator hinzuzufügen, danach können Sie verschiedene Zeitrahmen ändern, um solche Must
Der MetaTrader Market ist eine einzigartige Plattform für den Verkauf von Robotern und technischen Indikatoren.
Das Merkblatt für Nutzer der MQL5.community informiert Sie über weitere Möglichkeiten: nur bei uns können Trader Handelssignale kopieren, Programme bei Freiberuflern bestellen, Zahlungen über das Handelssystem automatisch tätigen sowie das MQL5 Cloud Network nutzen.
Sie verpassen Handelsmöglichkeiten:
- Freie Handelsapplikationen
- Über 8.000 Signale zum Kopieren
- Wirtschaftsnachrichten für die Lage an den Finanzmärkte
Registrierung
Einloggen
Wenn Sie kein Benutzerkonto haben, registrieren Sie sich
Erlauben Sie die Verwendung von Cookies, um sich auf der Website MQL5.com anzumelden.
Bitte aktivieren Sie die notwendige Einstellung in Ihrem Browser, da Sie sich sonst nicht einloggen können.