Neue technische Indikatoren für den MetaTrader 4 - 15
The Finding Average Volume indicator for MetaTrader 4 is a technical analysis tool that calculates the average volume of swing bars. Swing bars are a type of price chart pattern that identifies potential turning points in the market. The indicator is displayed as a zigzag trend line that is bounded by two vertical lines. The average volume is calculated for the entire swing bar pattern. Benefits of Using the Finding Average Volume Indicator Identify potential trend changes: The Finding Average

Всем добрый день, Это Вадим Сергеевич Лепехо. Выложил на общее обозрение очередной свой продукт(индикатор). Индикатор прост. В этом индикаторе я добавил формулу расчета точек входа. Сам индикатор я скачал в бесплатных индикаторах в mql mt4: arrows_template(шаблон стрелок). В свойствах, описании индикатора я указал имя автора. Суть индикатора рисует стрелки, знаки куда ходить, что делать и т.д...... Стратегия входа построена на пересечении двух 'машек' (MA) с разными периодами + обьемы. Данный ин
Всем добрый день, Это Вадим Сергеевич Лепехо. Выложил на общее обозрение очередной свой продукт(индикатор). Индикатор прост. В этом индикаторе я добавил формулу расчета точек входа. Сам индикатор я скачал в бесплатных индикаторах в mql mt4: arrows_template(шаблон стрелок). В свойствах, описании индикатора я указал имя автора. Суть индикатора рисует стрелки, знаки куда ходить, что делать и т.д...... Стратегия входа построена на пересечении двух 'машек' (MA) с разными периодами, объемы, parabolic
Всем добрый день, Это Вадим Сергеевич Лепехо. Выложил на общее обозрение очередной свой продукт(индикатор). Индикатор прост. В этом индикаторе я добавил формулу расчета точек входа. Сам индикатор я скачал в бесплатных индикаторах в mql mt4: arrows_template(шаблон стрелок). В свойствах, описании индикатора я указал имя автора. Суть индикатора рисует стрелки, знаки куда ходить, что делать и т.д...... Стратегия входа построена на пересечении двух 'машек' (MA) с разными периодами? объемы, parabolic

Pivots Indicator Traders have been using this indicator for a long time, but the main difference or might better call it betterment applied to well known pivots indicator is that you can change how the pivot can be illustrated. There are two ways to get the pivots on the chart. you can use either number of candles or the movement of the market using points of retracement. you can find out more on the video. furthermore pivots lines can be drawn to see the possible support and resistance prices w

Indicator ini berdasarkan Gain ADX - Follow Trend - Disertai Pivot, Support & Resistant Daily
Dengan indicator ini semoga menjadikan indicator yang porofit able, selama mengikuti signal yang tampil, apabila berwarna Hijau siap2 untuk Buy, dan berwarna Merah siap2 untuk Sell.
Akan tampil signal Sell/Buy di saat gain mencukupi, baik TF Kecil maupun TF Besar TF Besar / High TF adalah Trend Kuat TF Kecil / Low TF adalah Trend Lemah
Open Posisi pada High TF, signal akan menunjukkan Sell/Buy.
FREE

The Starting Points indicator for MetaTrader 4 is a technical analysis tool that shows the monthly, weekly, and daily starting points, as well as the 1000-point and 500-point levels, in the forex market. The indicator is displayed as a series of horizontal lines that represent the starting points and levels. Benefits of Using the Starting Points Indicator Identify potential trend changes: The Starting Points indicator can help traders identify potential trend changes by highlighting areas wher
FREE
Oscillators and Volatility: Oscillators like RSI and Stochastic are particularly useful in assessing the market sentiment and potential turning points in volatility. However, it's essential to use them in conjunction with other indicators and analyses for a comprehensive view. Divergences between price movements and oscillator readings can be powerful signals. For example, if a volatility index is making new highs, but the oscillator fails to confirm these highs, it may indicate weakening momen
FREE

This indicator filters the Zigzag indicator to calculate the main support and resistance
levels.
Variables
minimum gap between peaks : is the distance (GAP) between the peaks of
the Zigzag
peaks sensitivity : Minimum number of nearby peaks
look back: it means that it has to test the last 50 peaks in the Zigzag
object name perfix: a prefix for level’s line name on chart
FREE

This indicator allows you to overlay three different moving averages on the chart simultaneously. Each of these moving averages has additional settings such as: -Time frame
-Shift
-MA method
-Applied price
Using this indicator, you can easily set up three moving averages and find the one that suits you the best. You can also use this indicator to determine the trend when the moving averages cross.
FREE

FireArrow is an arrow signal based indicator that give buy and sell signals with tp and sl levels , the indicator gives buy/sell signals with alert on candle close along side tp and sl levels on chart for each signal
this indicator does not repaint/back-paint and signal is not delayed.
Strategy : Open buy same moment buy arrow appear and open sell same moment a sell arrow appear , set tp as drawn on chart along side sl.
Recommended Time frame : 15 and above
this arrow is good as ? : add

CycleView is an indicator that highlights possible phases of expansion and contraction in the different time frames, it helps to highlight the correct timing to make the entry. The cycle can be changed via external settings. After installing the indicator, you can contact me by message for the best settings and time frames to use.
The indicator works by analyzing the price action. When the indicator is downloaded, you need to move the EX4 file from "Market-Expert" to "Market-indicator".

Overview Automated smart money market structure identification following smart money concept and inner circle trader concept, it gives an unprecedented edge on your smart money and market structure analysis by automatically identifies valid market structure using smart money concept: Identify impulsive and corrective moves Identify valid pullbacks built by impulsive and corrective market moves Idenitfy bearish or bullish leg and their inducements for smart money concept Identify valid market st

MR BEAST INDICATOR ATR SUPLIED AND DEMAND ¡Descubre la herramienta definitiva para la toma de decisiones financieras con nuestro asesor experto! Diseñado para operar en la vanguardia de los mercados globales, este asesor se destaca por su capacidad única para analizar tendencias en tiempo real utilizando el indicador Average True Range (ATR) y el equilibrio de oferta y demanda. Al aprovechar el ATR, nuestro asesor experto evalúa la volatilidad actual del mercado, proporcionándote una visión clar
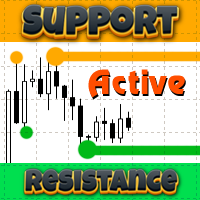
The Support Resistance Active indicator for MT4 identifies highs and lows across various timeframes, displaying support and resistance lines. Notably, previously tested highs and lows are eliminated to avoid clutter on the chart.
This indicator focuses on weekly and daily levels, termed as sell zones and buy zones. It draws support or resistance lines (fractal lines) for these zones. Tested areas are visually connected with a line, enhancing clarity on the chart.
The indicator is Multi-Time

Indicator Statistics MultiPairs for MT4 1. Current Openning Ords - Symbols Openning + Buy Orders + Buy Volume + Sell Orders +Sell Volume - DrawDown by Symbols - Floating by Symbols 2. Closed Orders - Statistics by Today, Week, Month, YTD and Volume - Sum of Closed Orders by Symbol 3. Statistics by Day - Statistics by Say and Volume 4. DrawDown by Day - Each day DrawDown in Week - Percent of DrawDown Contact me at Telegram @MaiMew68

Разворотный индикатор высчитывает все диапазоны цен за определенный период на основе исторических данных и выводит информацию ввиде уровней с цифрами,которые показывают вероятность разворота цены в процентах. Очень хорошая отработка на дневных и недельных графиках. Может применяться как отдельно для торговли,так и в связке с индикаторами уровней,разворотных паттернов,осцилляторов и скользящих средних.Работает абсолютно на всех инструментах Форекс,индексах,сырьевых товаров и акциях.
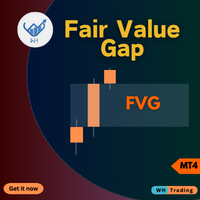
Erleben Sie den Handel wie nie zuvor mit unserem beispiellosen Fair Value Gap MT4 Indicator (FVG).
als der Beste seiner Klasse gefeiert. Dieser MQL5-Marktindikator geht über das Übliche hinaus,
Bietet Händlern ein unübertroffenes Maß an Genauigkeit und Einblick in die Marktdynamik.
Merkmale:
Erstklassige Fair-Value-Gap-Analyse. Anpassung. Echtzeitwarnungen. Benutzerfreundliche Perfektion Nahtlose Kompatibilität Vorteile:
Unübertroffene Präzision: Treffen Sie Entscheidungen mit
FREE

ZeusArrow Smart Liquidity Finder
Smart Liquidity Finder is Ai controlled indicator based on the Idea of Your SL is My Entry. It scan and draws the major Liquidity areas on chart partitioning them with Premium and Discount Zone and allows you find the best possible trading setups and help you decide the perfect entry price to avoid getting your Stop Loss hunted . Now no more confusion about when to enter and where to enter. Benefit from this one of it's kind trading tool powered by Ai an trade

Der AI-Trendindikator ist ein innovativer Handelsindikator, der mithilfe fortschrittlicher neuronaler Netzwerktechnologien erstellt wurde, um die Richtung des Trends auf den Finanzmärkten genau zu bestimmen. Dieser Indikator bietet Händlern ein intuitives und informatives Entscheidungsinstrument, das auf einer detaillierten Analyse der Preisdynamik basiert.
Hauptmerkmale:
Neuronales Netzwerk für Trendprognosen: Der KI-Trendindikator nutzt ein leistungsstarkes neuronales Netzwerk, das auf ei
FREE

Dieses Produkt empfängt Informationen von Indikatoren/Signaltools und zeigt Pfeile oder Benachrichtigungen an, wenn bestimmte Bedingungen erfüllt sind. Zum Beispiel werden Pfeile und Benachrichtigungen angezeigt, wenn MA25 und MA50 sich kreuzen, wenn SAR umkehrt, wenn MACD sein Plus/Minus ändert oder wenn der Schlusskurs die Bollinger-Bänder kreuzt. Bitte beachten Sie das Beispielbild mit den Einstellungen für bestimmte Konfigurationen. Detaillierte Handbücher und Konfigurationsdateien finden Si
FREE

Der Pfeilindikator für Forex und Binäre Optionen basiert auf Tick-Volumina. Im Gegensatz zu vielen Volumenindikatoren berechnet der Indikator "Super volumes" bullische und bärische Volumina und gibt Signale für die Vorherrschaft von irgendwelchen von ihnen aus. Wenn wir zu diesem Zeitpunkt sagen, dass es in diesem Bereich einen Vorteil von bullischen Volumina gab, bedeutet dies, dass das Signal auf Buy liegt. Oder wenn das Vorherrschen bärische Volumina war, wird das Signal dementsprechend auf
Der Pfeilindikator "Create a cool signal" für den Markt für binäre Optionen und Forex ist eine Art Konstrukteur seiner Signale! In dem Sie Ihre Signalbedingungen basierend auf den in MT4 festgelegten 10-Standardindikatoren und einem weiteren Pufferindikator von Drittanbietern auswählen können, den Sie der Variablen "Buffer indicators" hinzufügen können.
Es ist einfach gemacht! Geben Sie den Namen Ihres Indikators ein und schreiben Sie seine Nummern ein (sie finden sie im Farbbereich, in dem d
Der Indikator für Forex und Binäre Optionen basiert auf 2 Standardindikatoren in MT4: ADX und RVI.
Die Signale werden bei gleichzeitigen Schnittpunkten der Linien beider Indikatoren empfangen. Aber auch die Umkehrung der Signale ist in den Codes vorgeschrieben. Dies ist, wenn die Signale in die entgegengesetzte Richtung umgewandelt werden. Sie können auch die einzelnen Indikatoren ein- und ausschalten. Und auch im RVI können 2 Arten von Signalen verwendet werden: 1) Einfach wenn eine Linie hö

Scalping and Binary Signal Detector – Scalping-Indikator, der Richtungssignale für Eröffnungspositionen entlang des Trends liefert.
Der Indikator ist ein vollständiges Handelssystem, das für Forex und binäre Optionen verwendet werden kann.
Das Algorithmensystem ermöglicht es Ihnen, starke Preisbewegungen in mehreren aufeinanderfolgenden Balken zu erkennen.
Der Indikator bietet verschiedene Arten von Warnungen für Pfeile.
Funktioniert mit allen Handelsinstrumenten und Zeitrahmen (M5 oder höhe
Der Pfeilindikator für binäre Optionen und Forex ist ein Umkehrindikator. Erstellt und geschrieben auf der Grundlage von Umkehrmustern. Es wird für binäre Optionen empfohlen, es auf das M5-Diagramm zu setzen. Geben Sie in Transaktionen für 1-3 Bars ein. Abhängig von den Handelssitzungen müssen Sie Ihre Ablaufzeit für verschiedene Vermögenswerte auswählen.
Sie können die Einstellungen in externen Variablen ändern. Dadurch kann die Signalfrequenz erhöht oder verringert werden. Die Pfeile des I

The arrow indicator "Anaconda LD" is a reversal indicator for the Forex market and mainly for Binary options. The algorithm is written on the basis of reversal patterns. It is better to use it together with other indicators to filter signals. Even with the standard ones in MT4, even with other custom ones. Any channel indicators or level indicators are especially suitable...
You need to select your expiration time for different assets. Which are 1-5 bars on different pairs.

So handeln Sie mit einem Scalping-Indikator: blauer Pfeil – kaufen, roter Pfeil – verkaufen. Alles ist sehr einfach. Die Strategie funktioniert für alle Währungspaare. Empfohlene Zeitrahmen: M5, M15, H1, H4. Für den Handel sind keine weiteren Indikatoren erforderlich. Die gesamte Handelsstrategie basiert ausschließlich auf einem Handelsindikator „Click Scalper“. Dies ist die neueste Entwicklung von Scalping-Indikatoren für Metatrader4. Platzieren Sie einfach den Indikator auf dem Chart des Währ

About testing Mode: 1.To get the best usage experience please use the tick data to test and adjust the test speed to proper speed (tick price jump quickly but K bars scroll slowly)!!! 2.Click "Indicator Properties"-> Click "Reset" before testing the indicator to restore the default parameters of the indicator.
1. Compound Drawings (1) Line segment with arrow (2) Continuous line segment (broken line) (3) Parallelogram (4) Polygon (5) Profit and loss ratio measurement tools
2. Backtracking
This automated VOLUME SCALPING INDICATOR can be utilized to manage trades and identify potential areas of support and resistance for both buying and selling. It is designed to identify zones for Sell/Buy trades based on the volume analysis and can be effectively used in conjunction with other indicators, such as order block indicators, and more. Currently designed for MT4, it will later be adapted to function on MT5. We also offer the opportunity to customize the robot according to your trading
FREE

Exclusive Arrival: Presenting for the First Time . This is your secret weapon for predicting which way the wind will blow with the next market shift. It assists you in developing your trading strategy by predicting the direction of the next candle. Compatible with forex, stocks, and cryptocurrencies on all timeframes, but higher timeframes are recommended. MT5 Version - https://www.mql5.com/en/market/product/108937/ How does it work ? It's pretty neat. The algorithm separates green and red can

Check my paid tools they work great and I share Ea's based on them for free please r ate
The Dual Timeframe RSI (Relative Strength Index) indicator is a novel trading tool that allows traders to monitor RSI readings from two different timeframes on a single chart. This dual perspective enables traders to identify potential trend confirmations and divergences more effectively. For instance, a trader might use a 1-hour RSI alongside a daily RSI to ensure that short-term trades align with the bro
FREE
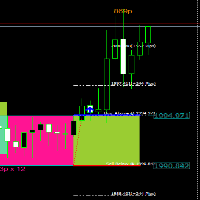
Hi All, " FCK Support Resistance BreakOut " indicator is very simple indicator for new users. You can choose which indicators and timeframes you want to calculate. " FCK Support Resistance BreakOut" that gives NON-REPAINT Buy/Sell signals "FCK Support Resistance BreakOut" provides the trend for buy/sell trades. Opposite side you the stop loss or hedging trade. * - Draws Dynamic S/R Boxes based on consolidation areas; * - consolidation areas are defined by a minimum period of time during whi

Multi Divergence Indicator for MT4 - User Guide Introduction Overview of the Multi Divergence Indicator and its capabilities in identifying divergences across multiple indicators. Importance of divergence detection in enhancing trading strategies and decision-making. List of Indicators RSI CCI MACD STOCHASTIC AWSOME MFI ACCELERATOR OSMA MOMENTUM WPR( Williams %R) RVI Indicator Features Indicator Selection: How to enable/disable specific indicators (RSI, CCI, MACD, etc.) for divergence detection.
FREE

ASR (Accurate Support Resistance) Indicator Uniqe formula behind this indicator makes it one the world's best support resistance indicator. watch the tutorial video
It is user-friendly and here are some key features : -- different calculations for swing traders and scalpers. -- the lower the accuracy number the further the lines distance is. --easily applicable on all charts. ( try to find the best accuracy number ) recommended accuracy number for Gold is 5or 6, for eurusd 6 or 7. other instru

For some trader's charts analysis use, specially for multi timeframe trading strategies . When you need to check something of the time within different timeframe at the same symbol chart, even different symbol charts, this indicator will show the crosshair at sync moving. You just need to load this indicator into some charts, then the crosshair will shown automatic.
FREE

This is a unique Gold Indicator On channel trading pullbacks and gives accurate entries on gold and major Fx Pairs on M15tf. It has the ability to pass any prop firm Challenge and get accurate entries on gold and major fx pairs.
EA FOR PROP FIRM AND CHANNEL INDICATOR IS FREE ALONG WITH THIS POWERFUL INDICATOR ALONG WITH THE BEST SET FILE FOR FIRST 25 USERS. Strategy tester report is in comment section. INDICATOR FEATURES: INDICATOR IS BEST ON M15 GIVES ACCURATE ENTRIES EA AND CHANNEL INDICAT

Consolidation is when price is moving inside a clear trading range. When prices are consolidated it shows the market maker placing orders on both sides of the market. This is mainly due to manipulate the un informed money. This indicator automatically identifies consolidation zones and plots them on the chart. The method of determining consolidation zones is based on pivot points and ATR, ensuring precise identification. The indicator also sends alert notifications to users when a new consolida
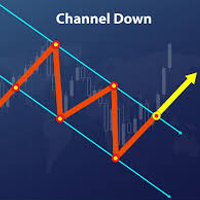
Trend channels are vital tools in technical analysis for identifying optimal buy or sell points. - Upper Line: Marks resistance. - Lower Line: Marks support. - Tops and bottoms of channels indicate potential support or resistance zones. - Bearish Channels: Negative slope (down). - Bullish Channels: Positive slope (up). Creating Channels: - Up Channel: Draw a parallel line matching the uptrend angle, touching the latest peak. - Down Channel: Draw a parallel line ma

What are Heiken Ashi Candles?
Heiken Ashi, derived from the Japanese term 'Heikin Ashi,' translates to average price bars. It's an indicator depicting price bars on a chart.
Formula for Heiken Ashi candles:
- Heiken Ashi opening price: (previous candle's opening + closing price) / 2 - Closing price Heiken Ashi: (opening + high + low + closing) / 4 - Heiken Ashi peak: Max of high, opening, or closing price - Heiken Ashi bottom price: Min of low, opening, or closing price
How to Read Heik

The MT4 Channel Standard Deviation Indicator automatically plots support and resistance channels on the price chart using price standard deviation. It indicates BULLISH and BEARISH market conditions and is suitable for both new and advanced forex traders.
This indicator offers support, resistance, entry, and exit levels, along with stop-loss and take-profit points. It accurately identifies BULLISH and BEARISH market trends, making it effective for both intraday and long-term trading across va
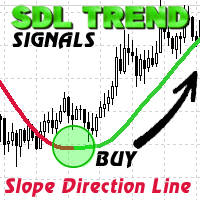
SDL Trend Signals is a custom MQL4 indicator named "Slope Direction Line" for MetaTrader 4. It employs weighted and simple moving averages to create customizable trend lines on charts.
Using two trend line buffers (Uptrend and Downtrend) and one for indicator values (ExtMapBuffer), the indicator calculates trend lines. Bullish slopes appear in BLUE, signaling an upward trend, while Bearish slopes are in RED, indicating a downward trend.
In a Bullish trend, traders can enter a BUY position w

This indicator cuts right through the price, in a straight line
100% non repaint, you get a new value at the opening of each new bar
It is perfect for mean reversal strategies : open far from the line and close when the price touches the line It works really well for mean reverting pairs specially (CHF, NZD).
It has absolutely no lag when there is a sudden move up or down and follows trend exactly !
This indicator should be a must have tool in the toolbox of every trader

An Implied Fair Value Gap (IFVG) is a three candles imbalance formation conceptualized by ICT that is based on detecting a larger candle body & then measuring the average between the two adjacent candle shadows.
This indicator automatically detects this imbalance formation on your charts and can be extended by a user set number of bars.
The IFVG average can also be extended until a new respective IFVG is detected, serving as a support/resistance line.
Alerts for the detection of bull

The TLR indicator is a market trend identification indicator. The idea behind this indicator is to use 3 linear regression lines, one short-term, one medium-term, and one long-term. The UPTREND will be determined when: The long-term linear regression line and the medium-term linear regression line have an uptrend. The long-term linear regression line has an uptrend, the medium-term linear regression line has a sideway, and the short-term linear regression line has an uptrend. The DOWNTREND will
FREE

An integrated analysis system that moves the trader from the random trading stage to professional trading And seeing and understanding the market with one glance instead of moving between different charts and currencies, even in times of high liquidity
It will be easy for you to read the market with our excellent Price Action Expert signals and confirm entry opportunities With accurate analysis tools integrated into our analysis system, which we can work with on a daily basis One of the most

up-down indicator is no repaint and works all pairs and lower than weekly time frames charts. it is suitable also 1 m charts for all pairs. and hold long way to signal. dont gives too many signals. when red histogram cross trigger line that is up signal.and price probably will down when blue histogram cross trigger line that is down signal.and price probably will go up. when the signals not seen press + button on terminal . too see weekly chart because of low data on chart ,it needs to lower p

Der Preis wird um 30 US-Dollar steigen, nachdem jeweils 5 Exemplare verkauft wurden. Der Hauptindikator zielt darauf ab, den allgemeinen Markttrend zu bestimmen. Das Farbsystem mit hellen und dunklen Farben soll starke und schwache Marktbedingungen identifizieren.
Meiner Meinung nach ist dieser Indikator unübertroffen; er funktioniert besonders gut, wenn sich der Markt zu bewegen beginnt.
Wenn Sie den Indikator für einen längeren Zeitrahmen verwenden möchten, beispielsweise 1 Stunde, 4 Stun

BUY INDICATOR AND GET EA FOR FREE AS A BONUS + SOME OTHER GIFTS! ITALO TRIANGLE INDICATOR is the best triangle indicator ever created, and why is that? Using Geometry and Fibonacci the Indicator works on all time-frames and assets, indicator built after 7 years of experience on forex and many other markets. You know many triangle indicators around the internet are not complete, does not help, and it's difficult to trade, but the Italo Triangle Indicator is different , the Italo Triangle Indi

„Trend Reversal ml4“ ist ein einzigartiger Indikator, der die Momente der Preisumkehr in Echtzeit bestimmen soll. Dies ist ein fertiges Handelssystem für Metatrader4. Der Indikator zeichnet seine Werte nicht neu! Basierend auf fortschrittlichen Algorithmen und technischer Analyse liefert Ihnen dieser Indikator klare Signale über mögliche Markteintritts- und -austrittspunkte und hilft Ihnen, fundierte Entscheidungen zu treffen.
Vorteile des Indikators: hohe Signalgenauigkeit. Der Indikator sel

indicator is no repaint trend indicator. when red stars up to line that is probably end of long trades. when blue stars up to line that is probably end of down trades. indicator can use all pairs and lower than weekly charts, to use weekly chart need to at least 500 bars data on back.and lowering processing value 500. it is also suitable for 1m charts. indicator hold long way to go. there is not too many signals.

This automated DOJI BAR FINDER INDICATOR can be utilized to manage trades and identify potential areas of support and resistance for both buying and selling. It is designed to identify zones for Sell/Buy trades and can be effectively used in conjunction with other indicators, such as order block indicators, and more. Currently designed for MT4, it will later be adapted to function on MT5. We also offer the opportunity to customize the robot according to your trading strategy. https://t.me/FXTSPr
FREE

With this easy to set up indicator you can display and set alerts for the following candlestick formations: Bull Breakout, Bear Breakout, Hammer, Pin, Bullish Engulfing, Bearish Engulfing. I'd appreciate if you would review the indicator
Input parameters: ShortArrowColor: The color of the Arrows, displaying a Bearish candle formation LongArrowColor: The color of the Arrows displaying a Bullish candle formation BullishEngulfing: Disabled/Enabled/EnabledwithAlert BearishEngulfing: Disabled/Ena
FREE

Technically, the indicator represents the difference between two fractal adaptive moving averages. Fractal Adaptive Moving Average (FRAMA) is a smart adaptive moving average developed by John Ehlers. FRAMA takes price changes into account and closely follows the price level, remaining straight during price fluctuations. FRAMA takes advantage of the fact that markets are fractal and dynamically adjusts the lookback period based on this fractal geometry. The indicator has the ability to send notif
FREE

Pivot, support and resistance levels are one of the main indicators on the charts of any professional trader. The PivotPointsMT4 indicator will help you determine the current entry points on any currency pair and any timeframe. It is convenient because it shows historical pivot, support and resistance levels on all timeframes, and you always see what worked in the recent past. Taking into account the news context, most often it is not so difficult to determine the current level and right entry

SX Currency Strength indicator allows users to analyze currency strength through a selected period, with results resetting periodically and accumulating thereafter. It displays the historical relative strength of eight major currencies (USD, EUR, GBP, JPY, AUD, CHF, CAD and NZD) across a selected timeframe. Assessing a currency's relative strength aids in evaluating its performance against a basket of other currencies. Users can select to visualize relative strength of the currencies in the shap

In Forex trading, understanding support and resistance is crucial. Virtually every trading strategy incorporates these levels.
MetaTrader lacks built-in support and resistance calculation features, but there's a solution— the Support and Resistance Lines indicator.
This powerful MetaTrader indicator automatically calculates and displays support and resistance levels for any chosen currency pair or trading instrument.
Benefits of the Support and Resistance Lines indicator:
1. Identify be

This pass-band oscillator reduces lag in market data by filtering out high and low frequencies. It uses two EMAs (Exponential Moving Averages) with periods of 40 and 60.
Trigger points are added using an RMS cyclic envelope over the Signal line. The pass-band waveform output is calculated by summing its square over the last 50 bars and taking the square root to create trigger levels.
Buy when the pass-band crosses above its -RMS line and short when it crosses below the RMS line. The indicat

ICT Kill zone and Macros Indicator mark and display the following zone times on the chart: Kill zones Kill zone Forex Asian
London Open New York Open London Close Central Bank Dealing range
Kill zone Indices Asian London Open New York AM New York Lunch New York PM Power Hour
Macros London 1 London 2 New York Am 1 New York AM 2 New York Lunch New York PM 1 New York PM 2
Silver bullet London Open New York AM New York PM
Sessions Asian London New York
Chart The display of Kill zone ,

The Waddah Attar Explosion (WAE) indicator is a potent tool in Forex trading, offering buy, sell, exit buy, and exit sell signals. It assesses trends as trend power and momentum as explosion power.
Trend Direction: - Green bars indicate a bullish trend. - Red bars indicate a bearish trend.
Signal Line: - A line serves as a threshold for momentum.
Buy Trade Setup: **Entry:** Go long when a green bar crosses above the threshold. Place a stop loss below the entry candle. **Exit:** Close the

In MetaTrader, TP & SL values aren't visible when hovering over corresponding lines. Our indicator fixes this by showing values on-screen. It displays defined SL and TP values in your account currency, facilitating easy tracking of positions. Note : The indicator estimates values, excluding commissions, and allows customization of colors and distance from SL/TP lines.
SURE REVERSAL is a histogram overbought/oversold type indicator that gives key reversal points that indicates a bull or bear market movment this indicator is fusion between moving average and the rsi indicator ,this indicator is non repainter , and is not delayed . Parameters : Ma period Ma Method Ma Price Sure Period (Rsi) Sure Price (Rsi) ==============

This trend reversal arrow indicator has an alert signal that is a valuable tool for forex traders, providing several advantages that contribute to making more informed trading decisions and potentially increasing profits. Here are some advantages: Early Identification of Reversals: The primary advantage is the early identification of potential trend reversals. This arrow indicator can visually signal when a trend may be losing momentum or about to reverse, allowing traders to be proactive rather
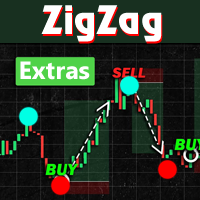
Introducing ZigZag Extras MT4, a Forex indicator that simplifies market analysis:
- Visualizes highest highs and lowest lows over a specified "Depth" period. - Highlights potential reversal points with filled blue and red dots. - Optional display of BreakOut points, indicating probable peaks and bottoms. - Helps avoid common pitfalls of mistaking repainted points for market tops or bottoms. - Designed to enhance understanding and serve as signals for various trading strategies.
Instructions

- Real price is 80$ - 50% Discount ( It is 39$ now ) Contact me for instruction, any questions! Introduction The breakout and retest strategy is traded support and resistance levels. it involves price breaking through a previous level. The break and retest strategy is designed to help traders do two main things, the first is to avoid false breakouts. Many false breakouts start with a candlestick that breaks out of a level but ends with an immediate candlestick that brings the price back into t
Erschließen Sie eine neue Dimension des Handels mit unserem hochmodernen MQL4-Indikator Range BreakOut MT4
Dieses leistungsstarke Tool wurde entwickelt, um Preisbewegungen zu erkennen und daraus Kapital zu schlagen, wenn sie aus etablierten Bereichen ausbrechen.
Wir bieten Ihnen die Präzision und das Vertrauen, die Sie benötigen, um in der dynamischen Welt der Finanzmärkte erfolgreich zu sein.
MT5-Version : WH Range BreakOut MT5
Merkmale:
Präzise Entfernungserkennung. Breakout-Si

ENIGMERA: Der Kern des Marktes https://www.enigmera.com
Einführung Dieser Indikator und dieses Handelssystem sind ein bemerkenswerter Ansatz für die Finanzmärkte. ENIGMERA nutzt die fraktalen Zyklen zur genauen Berechnung von Unterstützungs- und Widerstandsniveaus. Er zeigt die echte Akkumulationsphase an und gibt Richtung und Ziele vor. Ein System, das funktioniert, egal ob wir uns in einem Trend oder in einer Korrektur befinden.
Wie funktioniert es? ENIGMERA besteht aus drei Linien: der

QualifiedEngulfing - ist die kostenlose Version des ProEngulfing -Indikators. ProEngulfing - ist die kostenpflichtige Version des Advance Engulf-Indikators. Laden Sie ihn hier herunter. Was ist der Unterschied zwischen der kostenlosen und der kostenpflichtigen Version von ProEngulfing ? Die kostenlose Version hat die Einschränkung von einem Signal pro Tag. Vorstellung von QualifiedEngulfing - Ihr professioneller Engulf-Muster-Indikator für MT4 Entfesseln Sie die Kraft der Präzision mit Qualifie
FREE

Candle Power Signals ist ein Trendindikator, der eine Strategie zur Suche nach potenziell volatilen Signalen verwendet, um Handelsentscheidungen zu treffen.
Durch die Analyse des Marktes identifiziert der Indikator Zonen mit erhöhter und verringerter Volatilität innerhalb der Richtungstrendbewegung.
Die wichtigsten Signalerzeugungsparameter wurden bereits konfiguriert, die restlichen Einstellungen und Zeiträume sind in 2 Parametern zur manuellen Konfiguration indiziert:
1. "Candle calculati

Das Ziel des "Black Horse"-Indikators besteht darin, Abweichungen zwischen der Preisentwicklung und dem VWAP-Indikator zu identifizieren. Er verwendet Filter, um potenziell falsche Abweichungen herauszufiltern und hochwertige, genaue Warnungen zu generieren.
Bearish-Abweichungen werden durch rote Punkte über der Kerze dargestellt, während Bullish-Abweichungen durch grüne Punkte unter der Kerze repräsentiert werden.
Der Hauptfilter für Abweichungen basiert auf dem ATR (Durchschnittliche Wahr
MetaTrader Market - der einzige Shop, in dem man Handelsroboter als Demoversion herunterladen und testen sowie anhand historischer Daten optimieren kann.
Lesen Sie die Beschreibung und Bewertungen anderer Kunden über das gewünschte Produkt, laden Sie es direkt ins Terminal herunter und erfahren Sie, wie man einen Handelsroboter vor dem Kauf testet. Nur bei uns können Sie ein Programm testen, ohne dafür zu bezahlen.
Sie verpassen Handelsmöglichkeiten:
- Freie Handelsapplikationen
- Über 8.000 Signale zum Kopieren
- Wirtschaftsnachrichten für die Lage an den Finanzmärkte
Registrierung
Einloggen
Wenn Sie kein Benutzerkonto haben, registrieren Sie sich
Erlauben Sie die Verwendung von Cookies, um sich auf der Website MQL5.com anzumelden.
Bitte aktivieren Sie die notwendige Einstellung in Ihrem Browser, da Sie sich sonst nicht einloggen können.