Neue technische Indikatoren für den MetaTrader 4 - 110

This indicator weigth the actual close price with the high and the low of past values then it is computed by a simple 1 lag IIR filter before being processed by a final logarithmic algorithm to order the data.
This Indicator is perfect to find precise reversals.
Rules of Trading : 1) Be sure that the yellow line is in overbought/oversold (above +5 or under -5) The higher/lower, the better. 2) Wait for the gray line to touch the yellow line then separate from it : this is the signal. 3) If the

This indicator Master XR indicator.Indicator displays trend movement. Indicator calculates automatically line. Features
FiltPer - displays indicator period. deviation - displays indicator deviation. deviation2 - displays indicator deviation. How to understand the status: If (Timeframe M1-H1) FiltPer = 100; If ( Timeframe H4-MN) FiltPer = 5-20; ////////////////////////////////////////////////////////////////////////////////////////////////////////////////////////////////////////////////////// //

Description: The indicator shows the TDI indicator in a separate window, and with the RSI component, the indicator finds possible divergences with M or W patterns. KEY LINKS: How to Install - Frequent Questions - All Products Functions: Finds Market Makers patterns. Finds extremes or exhaustion into the market. Looks for a trend continuation. Content: TDI Indicator Divergence and M or W Signals Note 1: This indicator should only be considered as a part of any trading strategy. You shoul
Ein Kopf-Schulter-Muster ist eine Diagrammformation, die einer Grundlinie mit drei Spitzen ähnelt, wobei die beiden äußeren in der Höhe nahe beieinander liegen und die mittlere am höchsten ist. Es prognostiziert eine zinsbullische Trendumkehr und gilt als eines der zuverlässigsten Trendumkehrmuster. Es ist eines von mehreren Topmustern, die mit unterschiedlicher Genauigkeit signalisieren, dass ein Trend sich seinem Ende nähert. [ Installationsanleitung | Update-Anleitung | Fehlerbehebung | FAQ
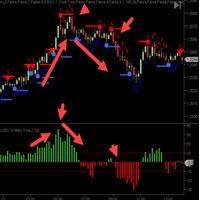
Der CycleTraderPro Close Strength Value Indicator misst die Entfernung vom ÖFFNEN eines neuen Balkens bis zum CLOSE des Balkens.
Eingabe -
Länge = 10 Standard
Wir addieren diese Werte zusammen und setzen die Längeneinstellung zurück.
Wenn der 1. Takt plus 10 Ticks und der nächste Takt minus 7 Ticks wäre, würde dies +3 sein
Es gibt zwei Möglichkeiten, den Close-Strength-Wert zu handeln:
1. Handel in Richtung niedrigerer Hochs und niedrigerer Tiefs und umgekehrt für Käufe, höhere Hochs und h
FREE

ZhiBi Fast Scalp stellt ein gutes schnelles Scalping-Index-System dar. Das Signal schwingt entsprechend dem Trend und die Buy- und Sell-Signale werden häufig angegeben. Geeignet für alle Marktvarianten und Zeiträume.
Der Aufwärtspfeil scheint die Bestellung zu platzieren. Der Abwärtspfeil scheint die Bestellung zu platzieren.
Parametereinstellungsbeschreibung: [Signal_line_period]: Die durchschnittliche Periode der Signalleitung mit kleinem Zyklus. [Trend_line_period]: Die durchschnittliche Pe
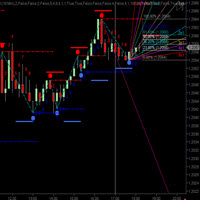
CycleTraderPro CycleWave Indicator besteht aus 9 Indikatoren in 1.
Es verwendet die CycleTraderPro-Indikatoren und -Muster, um Zyklen und mehr in Echtzeit zu identifizieren.
Die 9 Teile von CycleWave:
Zeichnet Cycle Bands und bestätigt Cycle High / Lows in Echtzeit nach jedem erfolgreichen Cycle-High oder -Low.
Diagramme Cycle Wave Price-Fenster über und unter jedem Balken mit einem geänderten% -Bereich des vorherigen Balkens.
Zeichnet das Fibonacci-Retracement automatisch nach je
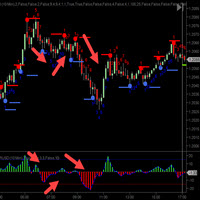
Das CycleTraderPro Tick Momentum misst die Anzahl der Ticks, die der Markt in Richtung aufeinanderfolgender Schließungen bewegt.
Wenn sich der Markt über dem Ende befindet, beginnt er in der Richtung zu zählen, um wie viele Ticks er sich bewegt hat.
Wenn sich der nächste Takt in den Zügen befindet und in die gleiche Richtung schließt, zählt das Tick-Momentum weiter hoch, bis der Markt unter seinem Markt schließt. In dieser Richtung beginnt der Countdown.
Sie können diese Bewegungen abweichend
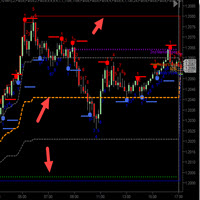
Der CycleTraderPro Open / High / Low / Medium-OHL nimmt den Tiefst- und den Höchststand des Tages und zeichnet diese Werte auf:
1. Hoch des Tages (rote Linie)
2. Tief des Tages (blaue Linie)
3. 25% vom Tiefpunkt (graue Linie)
4. 50% der Reichweite (Orange Line)
5. 75% vom Tiefpunkt (graue Linie)
Wir scheinen weit über dem 50% -Bereich und kurz darunter zu sein
Sie können diese Ebenen leicht erkennen, wenn sich der Markt bewegt. Wenn der Markt ein neues Tief oder Hoch erreicht, bewegen sic
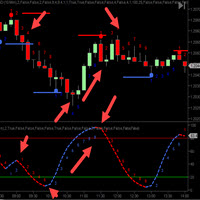
Der CycleTraderPro Power Play Indicator (PPI) - ist einer unserer beliebtesten Indikatoren. Wir nehmen alle CT-Indikatoren und kombinieren sie zu einem Indikator.
Die gesamte Auswahl an Indikatoren ist mit Ein / Aus-Funktionen ausgestattet. Sie können also Ihren eigenen Indikatormix auswählen und nur diesen Mix darstellen.
Wir nehmen einen Durchschnitt der gewählten Mischung. Bei der Auswahl von 5 Indikatoren teilt PPI die Mischungswerte durch 5.
Dann zeichnen wir eine Zykluszählung für die R
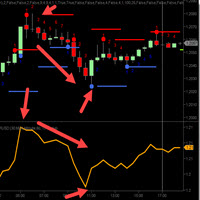
Die CycleTraderPro Orange Linie - Bressert DDS - DoubleStoch - Mein Vater Walter Bresser t hat diese DDS seit Jahren berühmt gemacht.
Sie arbeiten mit Code von Stochastic und glätten sie noch einmal mit nur einer Zeile.
Je nach Länge der Indikatoren, die länger für mehr Trends und kürzer für die Skalpierung der Märkte sind, ist die Orange Line eine Länge von 100.
Es gibt zwei Möglichkeiten, die Orange Line zu handeln:
1. Handeln Sie oberhalb und unterhalb der 50-Marke in dieselbe Richtung. O

The principle of the indicator. The StatChannel ( SC ) indicator is a development of the Bollinger Bands indicator ( ВВ ). BB is a moving average, on both sides of which two lines are drawn, separated from it by standard deviations std multiplied by the corresponding coefficient. At the same time, a moving average with an averaging period (2n + 1) bars is always obtained lagging behind n bars. Sliding std is also lagging behind on n bars, also calculated by (2n + 1) points. Such
The original multi-indicator suite from JoaquinTrading specifically geared towards binary options, including regulated exchanges such Nadex, Cantor Exchange, and other binary option brokers.
The Probability Tool Suite Classic will provide the given win/loss outcome probabilities of up to 10 strike levels, a specific expiration duration, based on a particular indicator's parameters and derivative behavior (i.e. expiry, touch, touch & retrace). Using this indicator will give users an idea if a p

FZR indicator determines fractal zigzag reversal pattern of all the time frames of the chosen symbol and shows the information in the Info label. Indicator draws the detected pattern in the chosen time frame and also you can select in the menu to draw the trend line according to FZR peaks. What it is FZR? See the first picture in the screenshots. As you can see for every peak of FZR the AO indicator must cross zero line. FZR indicator determines the trend direction.
How to use FZR for trading?
FREE

We stopped creatin small tools for MT4. Our focus are on MT5. Only very useful tools maybe we will develop to MT5. New Candle Alert is a simple indicator that notify you when a new candle is formed.
You can modify the notification message that will appear for you. The alarm sound is default by meta trader program.
MT5 version: https://www.mql5.com/pt/market/product/37986
Hope you enjoy it. Any doubt or suggestions please notify on private or by comments.
See ya.
FREE

iVolX indicator horizontal volumes for all time periods
Main settings of the indicator: VolumeSource - select data for volumes (tick or real) PeriodMinutes - selection period for rendering of volumes PeriodsNumber - number of periods to show on the chart StartDate - the start date of the calculations ClusterPoints - cluster width Color - color MaxVolColor - maximum volume color ValueArea - the value of the zone of balance ValueAreaColor - color of the balance zone MaxVolFontSize - fon
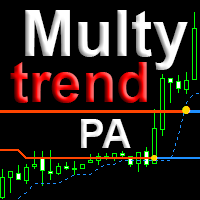
The indicator combines the principles of Price Action and a unique filtering algorithm with feedback for the three movings, this allows you to determine the pivot points and the current trend on any timeframe with a high probability. MultyTrend PA is an evolution of the Trend PA indicator and can be used on the principle of the three Elder screens, with everything you need is displayed on the same graph. Line 1 fast moving, Line 2 main moving, Line 3 - slow moving to determine the direct

indicator for binary options! open a deal only for 1 - candle The indicator is already set to trade in binary options. The indicator is ideal for trading on martingale since he very accurately combines what the next candle will be if you are trading in a martingale money management, this is the indicator that you were looking for; it is just created for you and your trading style p.s it is much better than relying on the color of the candle as some not very experienced traders do (therefore, the
This indicator is based on the previous option ( https://www.mql5.com/ru/market/product/37376 ) and includes all completions at the time of creation. Availability of additional data allows to understand more deeply the principle of work as this indicator and original. Points on extrema of bars show history of a portrayal of extrema as before. Levels of a reverse show as far as the price for formation of a new shoulder has to deviate. The Price noise parameter has a special impact (the name "devi
The indicator is made on the basis of the algorithm put in the ZigZag History indicator ( https://www.mql5.com/ru/market/product/37376/ ).
In the real option there are no additional buffers and an opportunity to trace work history.
It causes the minimum involvement of random access memory, however productivity practically does not improve. Attention! The Price noise parameter - has significant effect on formation of extrema. Parameters: Depth - is depth of search of a local extremum in bars;

Trend Lines Cross This indicator will alert you on any cross of a Trendline. You can draw up to two trend lines and form a channel, a pennant , a triangle or a simple trend and when the price crosses either trend line the indicator will provide you with alerts that you define plus an up or down arrow when the cross happened. How to: Draw the 1st trendline and name it tl1. Draw the 2nd trendline and name it tl2. Select which type of alerts you would like in the indicator properties and you a
FREE

This indicator alerts you when/before new 1 or 5 minute bar candle formed. In other words,this indicator alerts you every 1/5 minutes. This indicator is especially useful for traders who trade when new bars formed.
*This indicator don't work propery in strategy tester.Use this in live trading to check functionality.
There is more powerful Pro version .In Pro version,you can choose more timeframe and so on.
Input Parameters Alert_Or_Sound =Sound ----- Choose alert or sound or both to notify y
FREE

This indicator alerts you when/before new candle bar formed. In other words,this indicator alerts you every 1/5/30/60/240 minutes.
This indicator is especially useful for traders who trade when new bars formed.
*This indicator don't work propery in strategy tester.Use Free Version to check functionality in live trading.
Input Parameters Alert_Or_Sound =Sound ----- Choose alert or sound or both to notify you when new bar is coming.
Enable_1mBarAlert ----- Enable alert for 1 min bar
diff_1m --

Platinum FX индикатор для скальпинга. идеально подходит для торговли бинарными опционами.
работает на всех валютных парах мультитаймфреймовый.
когда появляемся красная стрелка мы покупаем когда появляемся красная мы продаем.
он должен был достичь успеха в трейдинге. Полное отсутствие перерисовки. Точность сигнала. точность данного инструмента можете увидеть в тестере Всем удачных торгов By Lilyyy

The Legendary Donchian Channel Indicator. This is the indicator that Richard Dennis used in the famous turtle experiment where he showed that anybody can become a successful trader by practice. Some techniques are older then MetaTrader itself. In fact we were unable to find a color picture of Mr. Donchian himself, for use as the product icon for this indicator. We had to artificially colorize an old black and white picture of the genius. But it is okay because he is smiling at us and now you ar

Tick Sound will play a different sound each time a tick is triggered. When the tick is higher than the previous one, an "UP" sound is triggered When the tick is lower than the previous one, a "DN" sound is triggered The main sound i chose is a Sheppard Tone : it's an audio effect that simulates and endless ramping sound up or down which is perfect for this task. but you can also select 14 different pre-made up/dn sounds or use your own sounds
There are three main parameters for Tick Sound Ask :
***Specialized for scalping trading on any timeframe***
Scalping Train use smart algorithm detects the price circles with time . give strong signals at the right time as result of combine the price and time.
our team spent months to develop this indicator specially for Scalping..with high success rates about 89% win trades .
Advantages Easy, visual and effective Signals. Gives you the ability to filter and further improve your trading strategies. Never repaints, never backpaints, never recalc
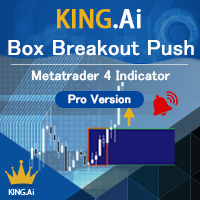
The brand new trading indicator using the box breakout strategy is presented by KING.Ai. This indicator with four-mode alerts is developed by KING.Ai ONLY. It is probably impossible that you could find a box breakout indicator like this one. It is very difficult for you to trade with the box breakout strategy as there is limited time for traders to monitor every currency. However, the box breakout strategy is very profitable. It is because when the price breaks the box, the trend will go further

Over 100,000 users on MT4 and MT5 Blahtech Candle Timer displays the remaining time before the current bar closes and a new bar forms. It can be used for time management Links [ Install | Update | Training ] Feature Highlights
The only candle timer on MT4 with no stutter and no lag S electable Location Tracks server time not local time Multiple colour Schemes Configurable Text Customisable alerts and messages Optimised to reduce CPU usage Input Parameters Text Location - Beside / Upper
FREE
This is the author's product of the trading-investment company Algorithmic Capital, which specializes in professional investor capital management and the creation of trading and analytical software. The Channel Enslaver indicator is created on an “all inclusive” basis. Its program code includes several important blocks at once: • A set of professional technical indicators that independently analyze quotes and generate trading signals. • An alert system that gives special signals (including Email
Revolution Martingale Pro
indicator for binary options!
at the time of opening and the appearance of the signal!
Blue diamond is shopping up.
A red diamond is an option down.
The indicator is already set to trade in binary options. ----------- protection is set against hitting on (steps - martingale knees) protection of several minuses under the row. ------------------------------------------- (Redrawing possible)

Alarm arrow indicator of increased sensitivity After closing the candle the arrows do not disappear Allows you to enter the transaction on time at the lowest price movements Can be used on any currency pairs, metals and cryptocurrency Suitable for working with binary options Distinctive features Does not redraw; Determines the price correction; Advanced settings for fine tuning; Works on all timeframes and on all symbols; Suitable for trading currencies, metals, options and cryptocurrency (Bitco

Quantum Swing 1. What is Quantum Swing The indicator calculates and displays future price levels based on quantum mathematics with high accuracy of probability and direction. Levels are displayed in the form of zones for making trading decisions; they clearly define a narrow price range for placing orders with a minimum stop-loss and maximum take-profit. The indicator displays future trading zones on different timeframes H1, H4, D, W. Quantum oscillations are also displayed without reference to
FREE
Данный индикатор Форекс построен на теории оценки силы тренда и расчёта, когда нужно входить в рынок. Как только появляется сигнал захода в рынок над свечёй вырисовуется стрелка которая и показывает дальнейшее направление цены. . Это полноценный индикатор который поможет вам принимать решение о входе в рынок и о позиции которую необходимо занять при открытии ордера.

Mars 1 is a Box Break is a powerful indicator of Break Zone for any par and any timeframe. It doesn't requires any additional indicators for the trading setup.The indicator gives clear signals about opening and closing trades.This Indicator is a unique, high quality and affordable trading tool.
Perfect For New Traders And Expert Traders Low risk entries. Never repaints signal. Never backpaints signal. Never recalculates signal. For MT4 Only Great For Scalping Great For Swing Trading Arrow Entr

MACD Display is a MACD disaplay and cross monitoring indicator,which can works on 6 timeframe at same time. Indicator advantage: 1. Deviation from the point can be drawn on the main picture and indicator drawing. It is convenient to observe and can be hidden or displayed by parameter setting. 2. Deviation from the entry point is clearly indicated by the arrow in the drawing. 3. Cross-cycle monitoring can simultaneously monitor the MACD deviation and the golden dead fork of the six-cycle framewor
Indicator for effective binary options trading.
Complete lack of redrawing The arrow indicates the direction of the next candle and the possible direction.
signal accuracy. Complete lack of redrawing. works great with support and resistance levels
it has an alert, it can be turned on or off in the settings
the accuracy of this tool is perfect
All successful trading.
Also see my other indicators

The indicator simplifies the decision-making process by recognizing the reversals using the built-in algorithm, and then confirms the signals at the support / resistance levels. In this way, the indicator tracks the market trend with unsurpassed reliability, ignoring the sharp fluctuations in the market and the noise around the average price. The indicator can be used for both small periods and long-term trading. The indicator is not redrawn and not late. 94% of deals are profitable. Take profit

Multi-timeframe indicator perfectly determines when there will be a rollback from the level ideal for binary options. of correct true signals Forex Stop Loss trading can be dragged behind the line thereby moving the deal to breakeven there is a signal in the indicator. The indicator showed excellent results during testing. Test in the test and make sure it is accurate. For any questions, suggestions, please always communicate with you.
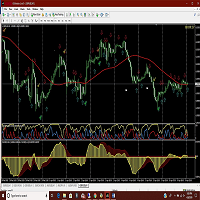
Amac indicator will give you alerts when the ADX crosses and also when the two MACD indicators cross. Helps in determining the trend direction, good for scalping against the main trend as well. Get mobile alerts and email in addition to the platform alerts. Arrows indicate MACD direction and Check marks show ADX turns. Works on all time frames but you can get more pips by using the 30 min and above. Be sure to view the photos!

This indicator guides you like a hunter. Tacheprofit and StopLoss levels. See the difference in the experiment. Works in all periods. Works at all rates. You can win with this system. The crossing of the mean and the re-test were done according to the rule. You can see the transactions by moving backwards on the strategy test screen. The whole system is automatically calculated.
multi-timeframe indicator. Ideal for both the Forex market and binary options. Good accuracy of this tool the indicator showed excellent results during testing. test it in a tester and make sure it is accurate.... complete lack of redrawing. You can choose absolutely any instrument. the indicator will provide many profitable and accurate signals. advantages of the indicator: advanced signals. high signal accuracy. frequency of occurrence of signals.

Mr Pip Scalping Indicator
is a momentum indicator that measures the magnitude of recent price changes to evaluate overbought or oversold conditions in the price of a stock or other asset with few major tweaks. This is NOT RSI. Features V2: Added Supply/Demand Filter
You can select which zone to see on the chart ( Important Resistance/Support; Verified Resistance/Support; etc ). You get alerts when prices is entering on a specific supply/demand zone. How to use? When the signal comes, you will

This indicator was created on the basis of the original extreme search indicators,
and as the filters are used is a modified RSI.
Signals are not repaint, so I recommend to analyze
history and choose your trading strategy.
Recommended TF - 5 and 15 minutes, expiration to the end of the candle.
Shows good results when Martin on the next candle or signal.
I do not recommend trading in the news and at the beginning of trading sessions, and avoid pairs with JPY,
on them results worse.
The arrow appe

Nygma Binary Options is a momentum indicator that measures the magnitude of recent price changes to evaluate overbought or oversold conditions in the price of a stock or other asset with few major tweaks. This is NOT RSI.
Features V3: Added Supply/Demand Filter: You must add your own S/R indicator .
You get alerts when prices is entering on a specific supply/demand zone. How to use the S/R Filter? Load the Nygma_Mod.ex4 into the chart, after that load your S/R indicator on the chart. In order
Provides maximum revenue from trends.
You can receive signals from Zigzag, Front Fibonacci Retracement, Back Fibonacci Retracement and Stochastic Oscillator indicators. You can run these indicators in the background. It will give you a warning at the levels you set. You can change all levels from the settings. Designed to help you get the most out of trends. Fibo Level : 38.2 / 61.8 / 76.4 Stochastic : 20 / 80

TT Arrows is a trend based indicator that very succesfully predicts the start of the new trend. The indicator is working with all trading instruments and in M5, M15, H1 and H4 timeframes. Up arrow signals a good time to enter a bullish trade while down arrow signals a good time to enter a bearish trade. The trade should be taken when the candle that has the arrow is closed. Following this strategy you will have have a high percentage of winning trades. Enjoy!
Индикатор работает по двум направлениям: прибыли и просадки , а также в двух измерениях: % и $ . Если выставляется значение $ , то % автоматически подгоняется под $ . При изменении депозита индикатор сам уровни корректирует по отношению того, на что был настроен, а другой параметр корректируется к первому. Корректировка появляется при изменении депозита. Округление числа с плавающей точкой у линий (для красивой читаемости) в значении доллара - 2, в проценте - 1. Уровни автоматически выставля

ZhiBiSmart eignet sich für alle Kartenzyklen aller Marktvarianten. Es verwendet den Trend-Back-Aufruf, um die Absprungsbande zu erstellen, die Band und Trend besser vorhersagen kann. Kaufen Sie die Bestellung: eine Markierung mit einem grünen Pfeil nach oben; Kaufen Sie das Schließen: Das grüne Kreuz wird angezeigt. Verkaufe die Bestellung: eine Markierung mit einem gelben Pfeil nach unten; Verkaufen Sie das Ende: eine gelbe Kreuzmarke; Parametereinstellungen: [TrendPeriod]: die Periode der Tren

All those involved in trading do certainly know that Moving Average Crossovers for being tradable should be reliable and also they need to have minimal lag.
BeST_Vervoort Zero Lagging MAs Strategy is a Metatrader Indicator that can help you to achieve it and is based on S.Vervoort's work about Reliable and of Zero Lag MAs Crossovers as described in his TASC_05/2008 article " The Quest For Reliable Crossovers ". It's a Multipotentiality Indicator as it can display of either simply the Zero Laggin
This indicator is designed to show the pair power of the major 28 paris with RSI,Stochostic,and CCI. The power value is sorted from the weak to the strong. The weaker pairs: the pairs occurs at least 2 times in the top 3 rows The stronger pairs: the pairs occurs at least 2 times in the bottom 3 rows Users can add another symbol, so it can calculate 28+1 symbols. My advice: https://www.mql5.com/en/blogs/post/729880
A free EA with Pair Power Matrix --- https://www.mql5.com/en/blogs/post/7328

The principle of the indicator.
The Strong Trend Flat Signal (STFS) indicator is the intersection of two, developed by the author, non-lagging moving averages with averaging periods 21 and 63. A simple moving average (SMA) with an averaging period (2n + 1) of bars is always obtained lagging by n bars. If SMA or other types of moving averages are the basis for making trading decisions, then their strong delay does not allow to open positions in time and close positio

This system is currently set for a multi time period. Examines the candles with a formula. The right time also notifies you. You can gain earnings using this system. Re-painting, feature is not available. Several indicator data, channel width and candlestick shadows are calculated. You can adjust the settings according to different time periods by trying the settings. The green line is the "take profit" level.

Pivot levels is indicator showing 7 pivot levels. It is adjusted for major use, including: all standard time frames
choice of periods to show three popular calculation formulas (typical, median, weighted) 9 level Camarilla pivot
pivot day shift choice of properties for lines and labels choice of showing alerts when crossing pivot lines Parameters: ----------Main parameters----------- Timeframe - time frame for pivot levels
Number of periods to show - displays pivot levels for number of periods
FREE

The indicator was developed with one purpose - adequate processing on stories and the maximum approach to the original (it was required for development of more difficult indicator and use in the expert). I think, everything who tried to get history from the original indicator understood that in it there is information only on extrema and nothing more. It is not sure that similar does not exist, but mine is found on other than original to an algorithm: - for one pass (programmers will understand)
The indicator is constructed on the basis of ZigZagHistory ( https://www.mql5.com/ru/market/product/37376 ). At the same time calculated on the current timeframe and on the specified high. The history of the high timeframe is displayed by hollow squares. The history of a current timeframe is displayed by rhombuses. Colors and the sizes of signs can be adjusted. Attention! The Price noise parameter - has significant effect on formation of extrema. Parameters:
High TimeFrame (HTF) - the high tim

Implementation of the channel on the MetaTrader 4, with real image of the lines.
The channel itself consists of two lines, equally spaced from above and below from the trend line. The indicator is not redrawn and not late. The principle of operation of the indicator is that, when placed on the chart, automatically determine the current state of the market, analyze historical data, based on historical data and display the trader directions to further actions.
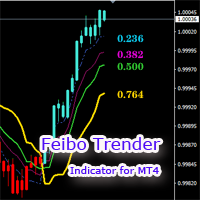
The Feibo Trender is a trend tracking indicator based on the Feibo section calculation. 1.The price is in an upward trend and candles turn blue .The price is in a downward trend and candles turn red . 2.The segmented areas of the channel are identified by lines of different colors that can as support or pressure reference locations . 3.The price broke through the yellow line, which marked the trend reversal. The indicator parameters can be customized and the settings are simple. If you have any
Average Daily Range with factor target and more functions (ADR)
Hello traders,
The upgraded ADR dashboard is much more better and more convenient for day trader, try it to experience the good things!
How to use Average Daily Range (ADR) Indicator? ADR is just a simple indicator tool to help trader identify the daily average range of an instrument. So for example we have the pairs EURUSD and that pairs usually makes a peak and bottom during the trading day and the point from the bottom to the

Signals and Alerts for AMA (Adaptive Moving Average) indicator based on these MQL5 posts: Adaptive Moving Average (AMA) and Signals of the Indicator Adaptive Moving Average . Note : this tool is based on the code of AMA indicator developed by MetaQuotes Software Corp.
Features The signals are triggered at closing of last bar/opening of a new bar; Any kind of alerts can be enabled: Dialog Box, Email message, SMS notifications for smartphones and tablets, and Sound alerts; Customizable
FREE

Renko Trade Alarm is designed to work on chart with Renko and Mean Renko candles. It generate B uy and S ell signals on the chart and send notifications. Visualization of signals: Swing - Formations 123. Pattern - Double Bottom, Double Top, Triple Bottom, Triple Top, Formations 123 Reverse. Scalp - Periodic change in the price direction, plus additional filters in the form of oscillators Stochastic and MACD. Ichi - Signals filtered by the Ichimoku indicator. For correct operation an offl

The Quantum GBPX is the latest addition to our suite of currency indices, and one which we have been asked for many times, and even more so since Brexit. It is an index which has taken us some time to develop, and through a series of complex calculations draws its primary data from a basket of currencies based on the old style dollar index, the Dixie. This is converted to a chart for the British pound. The result is an accurate index which describes strength and weakness for the GBP currency in

can recognize candlestick patterns
he also recognizes the lows and highs of the price for a certain time.
MTF works on all currency pairs in futures and sulfur, cryptocurrency does not redraw. his work can be seen in the test.
you can trade at any time of the day but the preferred trading time during the European American session ----------------------------------------------------------------------------------------------------------------------------------------------------------

Derzeit 20% reduziert!
Dieses Dashboard ist eine sehr leistungsfähige Software, die mit mehreren Symbolen und bis zu 9 Zeitrahmen arbeitet. Es basiert auf unserem Hauptindikator (Beste Bewertungen: Advanced Supply Demand ).
Das Dashboard gibt einen guten Überblick. Es zeigt: Gefilterte Angebots- und Nachfragewerte einschließlich der Zonenstärkebewertung, Pips-Abstände zu/und innerhalb von Zonen, Es hebt verschachtelte Zonen hervor, Es gibt 4 Arten von Alarmen für die gewählten Symbole in al

Sehr geehrte Kollegen Händler, installieren Sie die Demo - Version für den Tester macht keinen Sinn. So wurde es konzipiert. Sie werden keine Tick-Geschichte und prifit oder Verlust sehen. Dieser Indikator Tester wird nicht nehmen. Zweifeln Sie nicht . Die Punkte zeigen eine starke Bewegungsrichtung. Funktioniert nicht auf der Maschine, müssen Sie manuell öffnen Sie den deal und schließen.Gewinn sehen Sie sich die Punkte an, die ich denke, im Screenshot werden Sie verstehen. Ich schließe nach je

Oscillator helps determine the direction of the market Shows the direction of the price movement and is painted in the appropriate color. Allows you to conduct trend and counter trend trading It works on all timeframes, on any currency pairs, metals and cryptocurrency Can be used when working with binary options Distinctive features Does not redraw; Simple and clear settings; It works on all timeframes and on all symbols; Suitable for trading currencies, metals, options and cryptocurrency (Bitco
This indicator displays entry points in the market where to open your positions. The indicator is based on Parabolic, SuperTrend and Bollinger Bands to increase profitability and reduce the number of losing trades. It helps to find breakout of the support or resistance line and shows where to enter the market. The dashboard shows the results of the indicator (total pips win, loss, % of win and so on). The notification of entry points comes to the phone. It uses closed bars, no tick data. When yo
WaveAnalyzer works on the basis of the ZagZag indicator. When a wave formation appears on the chart, which can be chosen from the list in the program settings, it informs the trader in the following ways:
- Starts Alert.
- Informs by voice.
- Sends a letter.
- Sends a push notification to a smartphone.
- Makes a screenshot, which can be viewed in the MQL4 / Files folder.
In the future we plan to expand the functionality of this indicator.
Thus, by placing on the chart several indicators w

The indicator shows the potential trend direction by cyclical-wave dependence. Thus, all the rays of the intersection will be optimal rays, in the direction of which the price is expected to move, taking into account the indicator period. Rays can be used as a direction for potential market movement. But we must not forget that the approach must be comprehensive, the indicator signals require additional information to enter the market.

Several years of observing the principles of the operation of the Super Zone market worked, then and now, because the indicator allows you to see the trading range of the week and even the month that large market participants use. We are very easy to use on the H4 in the weekly range ( in the tester it not work in the demo mode ) - we sell from the upper zones and buy from the lower zones. Marks zones from the beginning of the week (month) that do not redraw , works on almost all currency pairs
Ist Ihnen bekannt, warum der MetaTrader Market die beste Plattform für den Verkauf von Handelsstrategien und technischer Indikatoren ist? Der Entwickler braucht sich nicht mit Werbung, Programmschutz und Abrechnung mit Kunden zu beschäftigen. Alles ist bereits erledigt.
Sie verpassen Handelsmöglichkeiten:
- Freie Handelsapplikationen
- Über 8.000 Signale zum Kopieren
- Wirtschaftsnachrichten für die Lage an den Finanzmärkte
Registrierung
Einloggen
Wenn Sie kein Benutzerkonto haben, registrieren Sie sich
Erlauben Sie die Verwendung von Cookies, um sich auf der Website MQL5.com anzumelden.
Bitte aktivieren Sie die notwendige Einstellung in Ihrem Browser, da Sie sich sonst nicht einloggen können.