Neue technische Indikatoren für den MetaTrader 4 - 35

This indicator labels swing highs and swing lows as well as the candle pattern that occurred at that precise point. The indicator can detect the following 6 candle patterns: hammer , inverse hammer , bullish engulfing , hanging man , shooting star and bearish engulfing .
The notations HH, HL, LH, and LL you can see on the labels are defined as follows:
HH : Higher high
HL : Higher low
LH : Lower high
LL : Lower low
Setting
Length: Sensitivity of the swing high/low de

Lets dabble a bit into Elliot Waves.
This is a simple indicator which tries to identify Wave 1 and 2 of Elliot Impulese Wave and then projects for Wave 3.
Ratios are taken from below link: https://elliottwave-forecast.com/elliott-wave-theory/ - Section 3.1 Impulse
Wave 2 is 50%, 61.8%, 76.4%, or 85.4% of wave 1 - used for identifying the pattern. Wave 3 is 161.8%, 200%, 261.8%, or 323.6% of wave 1-2 - used for setting the targets
Important input parameters MaximumNumBars : To calculate
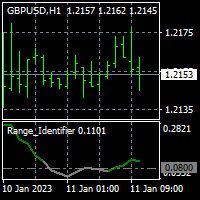
To get access to MT5 version please click here . - This is the exact conversion from TradingView: "Range Identifier" By "Mango2Juice". - All twelve averaging options are available: EMA, DEMA, TEMA, WMA, VWMA, SMA, SMMA, RMA, HMA, LSMA, Kijun, McGinley - This is a light-load processing and non-repaint indicator. - Buffer is available for the main line on chart and not for thresholds. - You can message in private chat for further changes you need.

Identify Engulfing candle pattern with Arrows & Alert ( built-in RSI filter). This indicator helps you to identify Engulfing candle pattern or Outside bar (OB) on the chart with arrows, along with an alert when a new Engulfing candle appears. Engulfing candle pattern is one of the most important reversal Price Action signals. You can choose between standard Engulfing (Engulfing based on candle body) or non standard Engulfing (Engulfing based on candle high - low )
Alerts can be turned on a
Parabolic SAR Parabolic SAR Technical Indicator was developed for analyzing the trending markets. The indicator is constructed on the price chart. This indicator is similar to the Moving Average Technical Indicator with the only difference that Parabolic SAR moves with higher acceleration and may change its position in terms of the price. The indicator is below the prices on the bull market (Up Trend), when it’s bearish (Down Trend), it is above the prices. If the price crosses Parabolic SAR

Everyday trading represents a battle of buyers ("Bulls") pushing prices up and sellers ("Bears") pushing prices down. Depending on what party scores off, the day will end with a price that is higher or lower than that of the previous day. Intermediate results, first of all the highest and lowest price, allow to judge about how the battle was developing during the day. It is very important to be able to estimate the Bears Power balance since changes in this balance initially signalize about possi

Everyday trading represents a battle of buyers ("Bulls") pushing prices up and sellers ("Bears") pushing prices down. Depending on what party scores off, the day will end with a price that is higher or lower than that of the previous day. Intermediate results, first of all the highest and lowest price, allow to judge about how the battle was developing during the day. It is very important to be able to estimate the Bears Power balance since changes in this balance initially signalize about possi

Everyday trading represents a battle of buyers ("Bulls") pushing prices up and sellers ("Bears") pushing prices down. Depending on what party scores off, the day will end with a price that is higher or lower than that of the previous day. Intermediate results, first of all the highest and lowest price, allow to judge about how the battle was developing during the day. It is very important to be able to estimate the Bears Power balance since changes in this balance initially signalize about possi

Universal Swing Arrows ist ein pfeilbasierter Indikator, der entwickelt wurde, um Swing-Trading-Signale bereitzustellen. Es kann für jedes Handelspaar und jeden Handelszeitrahmen verwendet werden. DIE PFEILE ERSCHEINEN AUF DER AKTUELLEN (0) KERZE. DIE SIGNALE NICHT NEU LACKIEREN! Der Indikator kann als eigenständiges Handelssystem oder als Teil Ihrer persönlichen Handelsstrategie verwendet werden. Der Pfeil des Indikators ist nicht nur ein Signal, sondern auch Ihr mögliches Stop-Loss-Level. Der

Dieser benutzerdefinierte Indikator, den ich für Metatrader 4 entworfen habe, um die Eastern Standard Time (Ortszeit von New York) von jedem Metatrader 4-Server aus leicht identifizieren zu können. Sie können dies jedoch verwenden, um Ihre Ortszeit zu identifizieren, indem Sie die Zeitzone aus dem Dropdown-Menü ändern. Es ermöglicht Ihnen, jeder bestimmten Zeit in der ausgewählten Zeitzone Ihrer Wahl eine vertikale Linie in einer beliebigen Farbe hinzuzufügen. Sie können horizontale automatisch
FREE
Der MTF Optimal Trailing TP-Indikator funktioniert genau wie der Optimal Trailing Take Profit, druckt aber Signale als Balken statt als Pfeile und druckt gleichzeitig für zwei verschiedene Zeitrahmen.
Er kann sowohl als Einstiegsinstrument als auch als Take Profit dienen. Wir verwenden es sowohl als Einstiegs- als auch als Take-Profit-Tool.
Am besten verwenden Sie es wie folgt:
Finden Sie mit dem Ultimate Sniper Dashboard eine Bewegung in einem höheren Zeitrahmen
Gehen Sie auf einen niedr

Optimaler Stoploss-FinderDie Anwendung der üblichen und beliebten Stoploss-Techniken, wie z. B. feste Stop Losses oder das Setzen von Stop Losses unter früheren Höchst- und Tiefstständen, ist aus mehreren Gründen nachteilig:1. Die Makler kennen diese Bereiche bereits, so dass es für sie ein Leichtes ist, sie zu übernehmen. 2. Man kann nicht wirklich immer einen festen Stoploss für einen Markt verwenden, da er zu verschiedenen Zeiten sehr breit oder sehr dünn werden kann, und man entweder weniger
Der Optimal Trailing TP-Indikator kann sowohl als Einstiegsinstrument als auch als Instrument zur Gewinnverfolgung eingesetzt werden. Sein einzigartiges Design ermöglicht es ihm, Kauf- und Verkaufssignale zu geben. Wenn Sie sich bereits in einer Position befinden, können Sie die Signalpfeile ignorieren. Wenn Sie noch nicht in einer Position sind, können die Pfeile Sie auf eine Bewegung in diese Richtung auf dem Zeitrahmen oder Währungspaar hinweisen, auf das der Indikator eingestellt ist. Sie kö

Der Indikator zeigt die aktuelle Serverzeit und die Zeit an, bis der aktuelle Balken geschlossen ist. Die Informationen sind in den Momenten der Veröffentlichung von Nachrichten sehr nützlich, wenn Händler darauf warten, dass die Kerze geschlossen wird, um eine Handelssitzung zu beginnen. Sie können die Schriftgröße und -farbe an Ihre Grafikvorlage anpassen.
Die Einstellungen: Text color - die Farbe des Anzeigetextes Text size - die Größe des Anzeigetextes Füge mich zu deinen Freunden hinzu,
FREE

** All Symbols x All Timeframes scan just by pressing scanner button ** *** Contact me after the purchase to send you instructions and add you in "Trend Reversal group" for sharing or seeing experiences with other users. Introduction: Trendlines are the most famous technical analysis in trading . Trend lines continually form on the charts of markets across all the different timeframes providing huge opportunities for traders to jump in and profit on the action. In the other hand, The tr

Free Market structure zig zag to assist in price action trading the screenshots describe how to use and how to spot patterns new version comes with alerts, email alert and push notification alert can be used on all pairs can be used on all timeframes you can add additional confirmation indicators the indicator shows you your higher high and low highs as well as your lower lows and lower highs the indication makes price action analysis easier to spot.
FREE
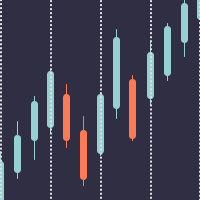
Better Period Separators For MetaTrader 4 The built-in period separators feature doesn’t allow users to specify the time period, so you can use this indicator to create more customizable period separators. On intraday charts, you could place period separators at a specific time, you could also place extra period separators at a specific time on Monday to mark the start of a week. On higher timeframe charts, this indicator works the same as the built-in period separators, On the daily chart, peri
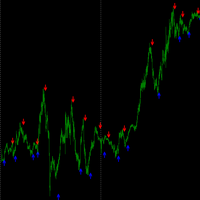
This indicator gives you nice trigger entry....whatever it is your trading style. You can use on different timeframes and also you can select from the setting the sensibility of the indicator itself, changing the input parameter "cycle period". For faster trigger signals you need to use shorter "cycle periods". You can use it in reversal strategy as well as in trending strategy. Added: - Sound Notification - PopUp Notification - Mobile Push Notification (To make it work follow the inst

Tame the trend just got easier! The PDS indicator will signal the use of price sentiment. Just one setting!
Study the offer of the indicator and get the opportunity for profitable trading based on a proven and tested strategy. The mathematical algorithm proves its performance even to skeptics under any market conditions. It goes well with any trading strategy. Never recalculates signals. Signals appear at the opening of the bar. Works with any financial instruments, including forex, cryptocur

Introduction The ST Cross indicator is based on the traditional Moving Average (MA) Cross which uses a fast and slow moving average. Entry signals to buy and sell are given when both moving averages cross. However with the basic strategy there are a lot of false signals. In order to filter the trades we use the 200 (MA) to identify the overall direction of the trend. Input Settings Master Trend Period - 200 Period moving average used to get the trend direction. Fast
FREE

Median Renko Terminator works best with renko charts if you do not have a renko chart generator I will email it to you for free and give you the correct settings for scalping or to swing trade NON-REPAINT COMES WITH ALERTS WHEN THERE IS A SIGNAL Conditions to sell: big purple arrow shows you the direction first then you take the small purple arrow to enter the same direction of the purple arrow. Conditions to buy: big white arrow shows you the up direction first then you take small white arrow
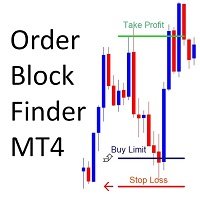
!! FLASH SALE !! Over 80% off !! For ONE week only. Now only $47 - normally $297! >>> Ends on 30 June 2023 - Don't miss it!
Sends Alerts – On MT4 To Your Phone To Your Email
Does not repaint .
Works on any Forex pair, any timeframe.
10 Activations allowed so you are free from limitations >> MT5 Version Here
For spreads from a tiny 0.1 pips RAW/ECN Accounts, click here . Check out my Waka Esque EA signal here: >> High Risk Settings or Medium Risk Settings .
What Is An

The indicator is coded to be suitable for every parity and every period. The purpose of the indicator is to capture the correct signal levels. The product is equipped with all notification and alarm options. In this way, you will be able to receive signals even if you are not at the screen. The product tries to find the signals in the trend direction as a strategy. Thus, it is more reliable. you have input signals. For default settings, recommended periods should be M15,M30,H1.
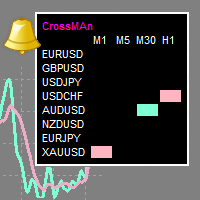
"CrossMAn" is a table indicator that gives signals about the intersection of two moving averages, on selected instruments and time periods.
The intersection of moving averages is one of the most popular signals on the stock exchange.
The signal is displayed as colored rectangles in the table. Thus, you can assess at a glance which tool should be paid attention to.
(Crossman does not add moving averages to the chart.)
The indicator table can be dragged with the mouse.
The size of the table

rsi sniper It has the strategy of an rsi line where the same indicator marks you buy and sell , When the line turns red, it marks a sale, it comes with alerts! + a red arrow that also confirms the sale, the same for the purchase, when the line becomes true mark sale, plus the alert accompanied by the phlegm that marks on the candle! works for all seasons ideal for scalping and day trading, suitable for forex and synthetic indices, all pairs are tradeable ! enjoy the sniper!
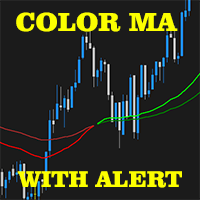
2 EMA Color Alerts Indicator is a powerful tool for any trader looking to stay on top of market movements. By using exponential moving averages (EMAs), this indicator can provide early warning signals for potential market reversals and trend changes. One of the key features of the 2 EMA Color Alerts Indicator is its customizable alerts. With this feature, traders can set their own parameters for receiving alerts, such as the EMA periods and the type of alert (e.g. sound, pop-up, email). This al
FREE

Bank Executive Indicator Uses A Simple method of tracking price as it moves across the chart and signals when a potential long or short position is active and indicates this to the trader giving you the opportunity to take a position on the market. Or you can simply use this indicator to give yourself signals and determine if you want to take the trade or learn the strategy on your own.

Bank Expert Indicator Uses A Simple method of tracking price as it moves across the chart and signals when a potential long or short position is active and indicates this to the trader giving you the opportunity to take a position on the market. Or you can simply use this indicator to give yourself signals and determine if you want to take the trade or learn the strategy on your own. The Signals From this indicator are targeted at long-term positions and focus on top quality call outs.

The Hull Moving Average (HMA), developed by Alan Hull from 2005, one of the most fast-moving Average, reduce lag and easy to use to identify Trend for both Short & Long term. This Indicator is built based on exact formula of Hull Moving Average with 3 phases of calculation: Calculate Weighted Moving Average (WMA_01) with period n/2 & (WMA_02) with period n Calculate RAW-HMA: RAW-HMA = 2 * WMA_01(n/2) - WMA_02(n)
Weighted Moving Average with period sqrt(n) of RAW HMA HMA = WMA (RAW-HMA, sqrt(n
FREE

To get access to MT5 version please click here . - This is a conversion from TradingView: "Hull Suite" By "Insilico". - This is a light-load processing and non-repaint indicator. - You can message in private chat for further changes you need. note: Color filled areas and colored candles are not supported in MT4 version. Here is the source code of a simple Expert Advisor operating based on signals from Hull Suite . #property strict input string EA_Setting= "" ; input int magic_number= 1234 ; inp

Uses a trend filter to plot the lines and arrows. Great for scalping. Settings: TrendPeriod: change to your preference. Alerts. How to use: Can be used on any time frame. Attached to chart, and wait for arrow to appear on multiple timeframes. Buy : - Blue arrow and blue line cross below price on multiple time frames; e.g., on D,W,M or H1,H4,Daily or M30,H1,H4 Sell : - Yellow arrow and red line cross above price on multiple time frames; e.g., on D,W,M or H1, H4, Daily or M30,H1,H4
**Best r
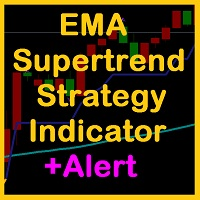
Exponential moving average (EMA) and super trend are popular and good indicators that is often and used to determine the trend direction. One of the best trading strategies with trailing stop is trading strategy with using a combination of Exponential Moving Average (EMA) and Super Trend indicators. EMA SuperTrend Strategy Indicator is the indicator consist of EMA, Super Trend and Alert function also other calculations are needed. It's also has extra indicator there are Automated Fibonacci Retr

Innovative Max Min swing This is a really different indicator for drawing Max and Min on the charts. This indicator draws Min and Max levels in a innovative way, based on a volatility proprietary calculation. In this way you will be able to draw trendlines in an objective way and also to see the break of Max and Min levels. You have three paramaters you can play with, in order to suite the volatility to your trading style. The indicator works on every time frame. Added: - Sound Notification
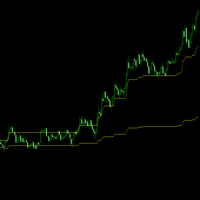
Is the market ranging (balance) or trending (Imbalance) ? This indicator exports a huge concept used in volume analysis (value area) into the price action. It makes it on Intraday level. How to read it? Simple! But you need to make practice. Making profit in market is more than a 2-rule system.
When the price inside the lines, the market is in "range mode".
If the price is above the upper line, the market is trending up.
If the price is below the lower line the market is trending down

Clear trend filter This is a filter-trend indicator. From the settings you can select to use more filter or less. The very interesting part of the indicator comes out using with all the filter. In this way you can follow the trend easily even when the market is without a strong trend, but is instead more flat. I personally use it on 1 minutue timeframe with MORE FILTER (you can select it from the input setting) in order to have an overlook of trend in the market. Added: - Sound Notificatio
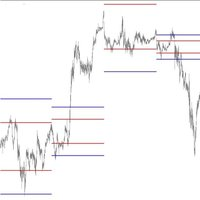
Equilibrium Levels support resistence Intraday indicator --> it means it works on lower TimeFrames , from 1minute to 4hours. This indicator is able to calculate and draw 2 levels (1 support and 1 resistence) representing the Barycenter's levels for a specific day session. From the setting you can choose only one parameter, that's the lenght of Barycenter's orbit. I personally attach the same indicator 2 times on the same chart, inputting as orbit: 0.15 and 0.30. Then what you will no
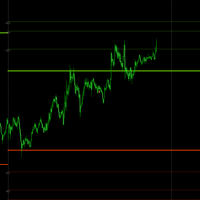
This indicator draws the projections of Fibonacci above the yesterday high and below the yesterday low. Why?
1) First of all, in this you can take the pulse of the market (trend or range). For instance If the price runs above yesterday's high the trend is UP.
2) In this way you will have automatic targets for the trend
3) you can wait the market on excess levels for contrarian and low risk trades.
If you buy the product feel free to contact me for additional tips or info.
I wish you
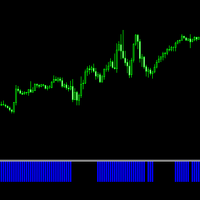
This is a clear and simple filter I've created based on a Ichimoku strategy and setup. I personally like to use the indicator in a multi timeframe approach. It can be used in a double way:
1) Every time the indicator change the colour, you can use the this first change as your trigger point.
2) You can follow the indicator for the trend direction and trade with your other signals.
Added: - Sound Notification - PopUp Notification - Mobile Push Notification (To make it work follow
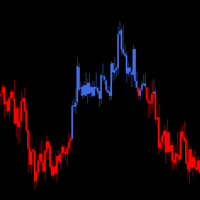
Never aginst the trend This is a really top indicator indicating the main trend in a clear and easy way. I reccomend you to use it on multiple timeframe in order to create a powerful view and strategy. It works on every market in the same way. If you trade against the trend you will work more for less, so stick with the trend. I hope you will find it useful. All the best with your trading! Keep it simple stupid, is the way! Added: - Sound Notification - PopUp Notification - Mobile Push Noti
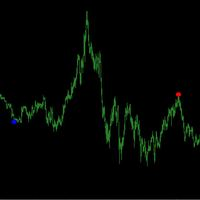
Semi automatic system John Bollinger bands Entry Bollinger Excess with Filter.With this indicator you can build your own semi-automatic strategy based on bollinger bands excess. You can play with the settings to find the best solution for your style and trading attitude. The indicator shows a signal whenever it finds a trigger-entry(coded inside) based on bollinger bands excess and an additional trend-filter(moving average). This tool will support your manual trading in order to easily spot
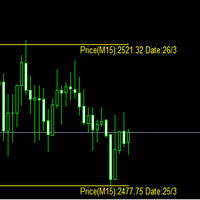
This indicator can spot strong volume levels on different timeframes. Everything is customised from the setting. You can hide by the colour the leveles you don't need. In this way you will map the market with reaction zone and you can use them as target levels or entry levels depending on your strategy. Hope you will find it useful and all the best with your trading. Added: - Sound Notification - PopUp Notification - Mobile Push Notification (To make it work follow the instructions: htt

'Zig Zag Percentage strenght' This indicator is awesome. Why? It's able to show the percentage of the last leg, compared with the previous leg. In this way you have a better understanding of the forces in play in that moment. In fact, for example, if you see that the up extensions are, in percentage, greater of the down legs, that means that there is more bullish pressure or maybe the market is starting to reverse from downtrend to uptrend. Hope you will ind it useful !
Based on Trend Following Strategy, QCAFE SUITE was built to get more accurate signal for Traders to decide whether to enter trades, included in the SUITE is QCAFE+ filter to eliminate false signals. The Signals are generated based on formula of Hull Moving Average ( HMA ) to minimize the lag of a traditional moving average - developed by Alan Hull in 2005 Setting: Limited Bars of back test Fast Period Low Period Fast/Low period to generate Buy/Sell signal
Based MA Period B ased Moving Averag

We’ll start off by just testing the default DMI crossover strategy. We’ll buy when the 14-period DMI-plus crosses above the 14-period DMI-minus, and sell once the former crosses below the latter. Here are the results: As you see, the strategy seems to work well in bull markets. Still, this isn’t something we’d like to trade in its raw form! So how could we go about improving the strategy? We’ll one common approach is to demand that ADX is above 25. However, in our tests, we’ve found out that a l
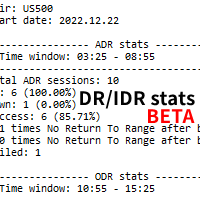
Based on the free DR/IDR indicator but with basic stats. Has the feature to export the daily data to a HTML file. So you can check the daily DRs yourself. Be mindful that the stats can vary from different broker feeds. So make sure your MT4 has enough data.
Scroll back in your MT4 and check for any gaps in the feed. Sometimes you will have to scroll back to update the stats. Feel free to contact me for questions related to the purchase, installation and use of the Indicator.
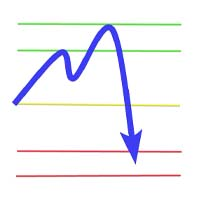
To measure the daily range, sell when above 30 pips in the European or US session, buy when below 30 pips in the European or US session. Take profit only around 30 pips because this is only an indicator for daily trading. FEATURES : Sum Range, max 30 Show Rectangle
Show Level
OC SR Line Width OC SR Line Color Show Label
Custom Label Position
Custom Font Label
Custom Font Size
Custom Mark Session
Show Line Break Event Point
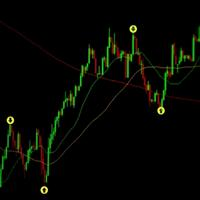
Indicator with 95% Assertiveness
Average of 2% to 3% per day of the value of your capital
Indicator that directs buy and sell entries based on bullish and bearish price targets.
Here are some settings to make it operational:
Currency pair: XAUUSD Timeframe: 15 Minutes Do not operate with news Better nighttime performance
Easy setup Full support
Schedule Take Profit to 100 pips
Entry only on the second candle
Any further queries, please get in touch. Support via WhatsApp.

The Accelerator MT4 forex indicator was designed by Bill Williams’ and warns you of early trend changes for any currency pair. The indicator is also known as the Accelerator/Deceleration forex indicator. It basically looks for changes in momentum, either accelerating or decelerating. As you can see from the EUR/USD H1 chart shown below, the indicator draws green and red bars above and below the 0.00 level. Green and red bars above the 0.00 level suggest bullish momentum in price (price goes up).

Please send me Direct message on MQL5 CHAT after purchasing the Indicator for Training and Installation Support There are some additional files that is important to use with the Indicator . So be sure to contact me after purchasing the Indicator So that I can add you for training and support .
If you find any difficulty with installation then send me Direct message here So that I can connect with you via Anydesk or Teamview for the product installation. " Smart Order Block Indicator " to find

TradeMo ist ein 100 % genauer Signalindikator, der nur auf Kursbewegungen reagiert. Wenn also die 8 linearen gleitenden Durchschnitte die 10 linearen gleitenden Durchschnitte kreuzen, erwarten Sie ein Kaufsignal und wenn die 8 linearen gleitenden Durchschnitte die 10 linearen gleitenden Durchschnitte unterschreiten, erwarten Sie ein Verkaufssignal. Das ist es! Sehen Sie, wie ich hier erkläre, wie ich es verwende.
Der Indikator passt sich an alle Zeitrahmen an, aber ich empfehle, einen höheren

Real Trade trades on time frames under 1 hour. Trade in uptrends and downtrend directions. Trade with the higher time trend directions and trade the first candle. Use the opposite to exit or use ratio to exit 1:1 or higher along with trailing stops. Trade Real Trends during active hours and with higher trend direction for the best results. Load indicator in tester to study the results and potential. Use the scalping arrows trading with the trend or use the Fib targets or both. Recommend f

What is a Point of Interest? Traders who follow Smart Money Concepts may call this a Liquidity Point, or where areas of liquidity have been built up by retail traders for for Big Banks to target to create large price movements in the market. As we all know, retail traders that use outdated and unreliable methods of trading like using trendlines, support and resistance, RSI, MACD, and many others to place trades and put their stop losses at keys points in the market. The "Big Banks" know these me
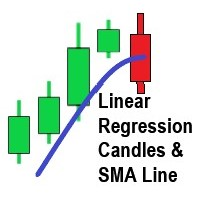
Dieser Indikator für MT4 basiert auf dem derzeit beliebten Indikator auf Trading View mit ähnlichem Namen.
4 (OHLC) Arrays werden mit linearen Regression-Werten für jeden Preis gefüllt. Die Periode der linearen Regression ist eine Eingabe, die größer als 2 sein muss (sie wird standardmäßig auf 2 gesetzt, wenn Sie versuchen, eine 1 einzugeben).
Die Periode der linearen Regression ist abhängig von den Marktbedingungen einstellbar. Der SMA hat auch eine Periodenanpassung.
Kerzen werden mit G

Zeigt Preisumkehrpunkte mit Pfeilen an. Funktioniert in allen Zeitrahmen und allen Währungspaaren. Sowohl für Scalping als auch für den langfristigen Handel geeignet. Wenn der blaue Pfeil erscheint, müssen Sie eine Kauforder eröffnen. Wenn der rote Pfeil erscheint, müssen Sie eine Verkaufsorder eröffnen. Empfohlene Zeiträume M5, M15, H1, H4. Der Indikator zeigt die besten Ergebnisse bei GBPUSD, XAUUSD, EURUSD, USDJPY, AUDUSD, USDCHF, EURGBP, EURJPY, EURCHF und anderen wichtigen Währungspaaren.

VaviStar is an indicator based on trend retracements determined by ZigZag segments. It is theorized, and statistics confirm, that stocks react to certain retracement levels. Many use Fibonacci retracement levels (23.6%, 38.2%, 61.8%). It is assumed that once the price goes beyond the 61.8% retracement, we can already speak of a trend reversal. This indicator allows you to comfortably chart a segment of the ZigZag with the relative operating levels chosen. With a reversal mindset , you can use it

"Pattern 123" is an indicator-a trading system built on a popular pattern, pattern 123.
This is the moment when we expect a reversal on the older trend and enter the continuation of the small trend, its 3rd impulse.
The indicator displays signals and markings on an open chart. You can enable/disable graphical constructions in the settings.
The indicator has a built-in notification system (email, mobile terminal, standard terminal alert).
"Pattern 123" has a table that displays signals from

X-axis lines prevail in grid manner, ruled by Average True Range. There’s an inevitable change in specific periods of time of this matter! The Average True Range (ATR) indicator is not directly based on volume. Instead, it measures volatility in price movements. It’ll stretch, expand, shrink, and evolve with 4 timely choices of grid states! MATR means “multiplying average true range” in which grandeurs the grid pip-distant levels, seeming to grasp a wave of perfectly synched parameters in ac
FREE
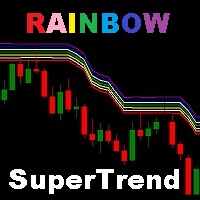
Super Trend is one of the most popular custom indicators that it doesn't provided in metatrader 4 (MT4) platform. Rainbow SuperTrend has some advantages, there are can display the trend direction and stop loss line based on Average True Range (ATR). This indicator is good to used for trailing stop trading style, because when the price direction is trending the stop loss point can adjust based on supertrend line. It is the high recommended to using this indicator combined with oscillator indicat
FREE

Fibo Quartz. It has a special fibonnaci where the indicator is placed and it adapts only to any temporality, works great for forex, all pairs. for crypto also if any broker offers. special for scalping and intraday With the indicator alone and the candles you can get high percentages of profit. That's why the Quartz fibo is made. World Investor. MT4!!!!!!!!!

Buy Sell Professional. It consists of an automated buying and selling strategy according to the arrow that appears on the graph and the alarm that goes off every time you mark a sale or purchase. Special for scalping and intraday. It works for all forex pairs, and if the broker has crypto too! The indicator also has a moving average, trix and mom to capture each movement of the market!

Double top and bottom indicator is a pattern scanning indicator which scans the tops and bottoms using zig zag pattern. When it find price bouncing back from the same point twice after a long trend then it generate arrow signals whenever the last resistance points is broken for double bottom and last support price broken for double top. Unlike other top bottom scanner it does not give only 1 signal. it alerts user when ever the last support /resistance is broker from double top/bottom pattern un
FREE

Dear Trader It is my pleasure to introduce to you my tool called the " Forex Sniper Indicator" . The major aim of this tool is to help serious traders and investors in all type of Financial Markets to catch price next movement right at the moment the price direction is about to change. This tool can be used to snipe the price direction in both down trend, uptrend and ranging markets. This tool can be used as the stand alone tool though it may be combined with other tools as well. My goal is to h

Traditional RSI is one of the most popular and must-known indicator that every traders would use. In this combination, we use two RSI period with smoothed factor to smooth the RSI lines for better results. Besides, bottom of Indicator is the Trend-filter display in different colors in order to let Traders identify the trends much easier Grey : Sideway market Light-Blue : Weak UP-Trend Blue : Strong UP-Trend Light-Red : Weak DOWN-Trend Red : Strong DOWN-Trend Signal: Blue-Arrow
FREE
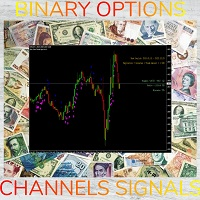
SYSTEM INTRODUCTION: The Binary Options Channels System Is Specifically Designed For Binary Options Trading. Unlike Other Systems And Indicators That Were Adopted From Other Trading Environments For Binary Options. Little Wonder Why Many Of Such Systems Fail To Make Money . Many End Up Loosing Money For Their Users. A Very Important Fact That Must Be Noted Is The Fact That Application Of Martingale Is not Required. Thus Making It Safer For Traders Usage And Profitability. A Trader Can Use Fi
SYSTEM INTRODUCTION: The Binary Options Momentum System Is Specifically Designed For Binary Options Trading. Unlike Other Systems And Indicators That Were Adopted From Other Trading Environments For Binary Options. Little Wonder Why Many Of Such Systems Fail To Make Money . Many End Up Loosing Money For Their Users. A Very Important Fact That Must Be Noted Is The Fact That Application Of Martingale Is not Required. Thus Making It Safer For Traders Usage And Profitability. A Trader Can Use Fi
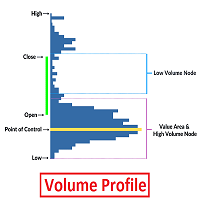
Volume Profile is an advanced charting study that displays trading activity over a specified time period at specified price levels. The study (accounting for user defined parameters such as number of rows and time period) plots a histogram on the chart meant to reveal dominant and/or significant price levels based on volume. Essentially, Volume Profile takes the total volume traded at a specific price level during the specified time period and divides the total volume into either buy volume or s

This indicator graphically displays profit ($),risk/reward and % of risk according SL&TP Open orders on Current Symbol. when you open orders on current symbol and set StoplLoss and TakeProfit this indicator automatically calculate Risk/Reward and calculate %risk Of Equity Account that your order get stop Loss. If you trade on several symbols at the same time, you can install the indicator on each one separately and see the relevant calculations on each one.
FREE

The MP Andean Oscillator is used to estimate the direction and also the degree of variations of trends. It contains 3 components: Bull component, Bear component and Signal component. A rising Bull component indicates that the market is up-trending while a rising Bear component indicates the presence of down-trending market. Settings: Oscillator period: Specifies the importance of the trends degree of variations measured by the indicator. Signal line per: Moving average period of the Signal line
FREE

MP Gradient Adaptive RSI oscillator uses AMA with the basic RSI to cover the retracements with minimum lag. Trigger line crossing the oscillator will provide an entry point for trader.
Settings: RSI period: period of the oscillator Sensitivity of the oscillator: controls the sensitivity of the oscillator to retracements, with higher values minimizing the sensitivity to retracements. RSI applied price: source input of the indicator Number of bars to draw: is used when the Fill Type option is n
FREE

MAD - Moving Average Distance The MAD Indicator uses ATR and the distance to a moving average to determine if price has the potential for mean reversion. Works on all time frames and pairs. It will only check for the condition at the beginning of a new candle so it doesn't repaint. A signal will include an arrow on the chart, alert popup and cell phone notification.
Settings: ATR_Multiplier: Multiplier of ATR for the calculation. (Recommended: 5)
MA_Period: Moving Average Period to use (EMA
Der MetaTrader Market ist die beste Plattform für den Verkauf von Handelsroboter und technischen Indikatoren.
Sie brauchen nur ein gefragtes Programm für die MetaTrader Plattform schreiben und schön gestalten sowie eine Beschreibung hinzufügen. Wir helfen Ihnen, das Produkt im Market Service zu veröffentlichen, wo Millionen von MetaTrader Benutzern es kaufen können. Konzentrieren Sie sich auf dem Wesentlichen - schreiben Sie Programme für Autotrading.
Sie verpassen Handelsmöglichkeiten:
- Freie Handelsapplikationen
- Über 8.000 Signale zum Kopieren
- Wirtschaftsnachrichten für die Lage an den Finanzmärkte
Registrierung
Einloggen
Wenn Sie kein Benutzerkonto haben, registrieren Sie sich
Erlauben Sie die Verwendung von Cookies, um sich auf der Website MQL5.com anzumelden.
Bitte aktivieren Sie die notwendige Einstellung in Ihrem Browser, da Sie sich sonst nicht einloggen können.