Neue technische Indikatoren für den MetaTrader 4 - 63
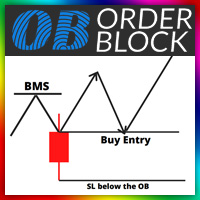
Orde Block Detector: The order block detector can automatically identify the breakthrough of the market structure. After the trend framework breaks through, the order block area can be drawn automatically. In order to draw the OB area more accurately, we also automatically find the candle on the left and right sides of the original candle according to its trading principle, and draw a more accurate ob area through more subtle quantitative rule judgment. Futures : 1. Customize the BMS color, and
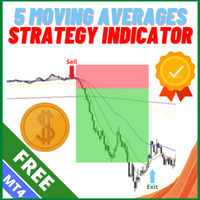
Description: For a comprehensive understanding of our indicators, we invite you to explore the entire Q&A section within this MQL5 blog post here . The Moving Average 5EMA Indicator is a valuable tool designed to provide comprehensive insights into market trends and potential entry and exit points. It incorporates five exponential moving average (EMA) lines, each representing the average price over different periods. This powerful combination offers a deeper understanding of price movements a
FREE

The indicator signals the appearance of a possible divergent bar based on the shape of the bar without angulation detection. A bullish divergent bar is a bar that closes in its upper half (the higher the better), has a lower minimum than the previous bar, and drops sharply away from the Alligator indicator. A bearish divergent bar is a bar that closes in its lower half (the lower the better), has a higher high than the previous bar, and moves up sharply from the Alligator.
SETTINGS History - hi

The indicator signals the appearance of a possible divergent bar based on the shape of the bar and its standard deviation from the Alligator indicator. A bullish divergent bar is a bar that closes in its upper half (the higher the better), has a lower minimum than the previous bar, and drops sharply away from the Alligator. A bearish divergent bar is a bar that closes in its lower half (the lower the better), has a higher high than the previous bar, and moves up sharply from the Alligator. Stand

This indicator draws on the chart high and low prices of different periods . And If you want, Indicator can alert you when the current price arrive these levels. Alert Options: Send Mobil Message, Send E-mail, Show Message, Sound Alert Time Periods: M1, M5, M15, M30, H1, H4, D1, W1, MN Inputs: TimeShift: You can set start hour for calculating. And that way you can see levels independently from broker server's time-zone. PipDeviation: You can set price sensibility for alert (Default: 3) Lines
FREE
PAX BDB Trade Chaos system of Bill Williams (Bearish/Bullish divergent bar)
One of the signals of the "Trade Chaos" system of Bill Williams. (First wiseman) When bar moving away from the "Alligator" indicator and there is divergence on the Awesome Oscillator indicator, it shows a potential point of movement change. It is based on the opening/closing of the bar, the position relative to the previous ones, the Alligator and AO. When trading, the entrance is at the breakthrough of the bar(short
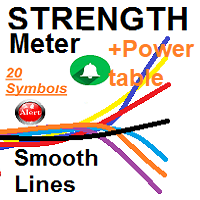
separate indicator window for Currencies Strength smooth lines for up to 20 symbols based on (5) time frames &&& MAIN Window Power TABLE for up to 20 Symbols for (5) timeframes and the Total calculated Symbols strength for each
1- Currencies Strength - It draws smooth lines for up to 20 currencies pairs representing Volatility strength and power calculated by 5 selected time frames not only ***Works on any Time frame but i recommend from M15 M30 H1 .... (lowest frames need higher index of
Binary Strong Indication Indicator is Designed Based on 14 Different Strategies Based. You can Use Binary Strong Indication Indicator for Binary Option Trading or if you want you can Try it for Forex. Time-Frame : M1 Depend on your choice on which time frame you want to get Indication. Trade Time Duration: 60 Seconds or 5 Minutes Mostly we Used it for 60 seconds in iq option but you can use it for any binary broker. Input Parameters : HLB = 30 it means Highest & Lowest Point of 30 Bars. This Val

** All Symbols x All Timeframes scan just by pressing scanner button ** After 17 years of experience in the markets and programming, Winner indicator is ready. I would like to share with you! *** Contact me to send you instruction and add you in "123 scanner group" for sharing or seeing experiences with other users. Introduction The 123 Pattern Scanner indicator with a special enhanced algorithm is a very repetitive common pattern finder with a high success rate . Interestingly, this Winner in

A machine translation from English product description was used. We apologies for possible imprecisions. Es wurde eine maschinelle Übersetzung der englischen Produktbeschreibung verwendet. Eventuelle Ungenauigkeiten bitten wir zu entschuldigen. Ein Visualisierungssystem für beliebte Candlestick-Preisaktionsmuster. Nach dem Anbringen markiert der Indikator automatisch die nächsten Muster auf dem Diagramm: Pinocchio Bar – ein kleiner Körperriegel mit einer langen „Nase“, einem sehr bekannten umgek
[ MT5-Version ] Orderblock-Indikator MT4 Der Order Block Indicator MT4 ist derzeit der genaueste und anpassbarste Indikator auf dem Markt. Es wurde entwickelt, um die Analyse von Operationen basierend auf Auftragsblöcken und Angebots- und Nachfragezonen zu erleichtern. Diese Zonen sind mögliche Umkehrpunkte einer Bewegung. Orderblock Indicator MT4 hebt aktive Orderblöcke von bis zu 4 TFs gleichzeitig hervor. Gleichzeitig bietet der Order Block Indicator MT4 ein visuelles Warnsystem, mit dem
KT Bollinger Shots works using a striking blend of the slingshot pattern and the mean-reversion phenomenon applied to financial markets.
In addition, a mathematical algorithm is used with variable deviation to fine-tune the indicator's signals on a different level.
Winning Trade: After a signal, if price touches the middle band in profit, it is considered a winner. Losing Trade: After a signal, if price touches the opposite band or touches the middle band in loss, it is considered a loser.
!
Advanced Indicator Scanner is a multi-symbol multi-timeframe scanner that works with hundreds of custom indicators available across the web including mql5 website market and codebase indicators.
Advanced Indicator Scanner features:
Scans your indicator in 28 customizable instruments and 9 timeframes. Monitors up to 2 lines(buffers) of an indicator. Showing of indicator value on buttons. You can choose between 3 alert modes: Single symbol and timeframe Multiple timeframes of a symbol Multiple
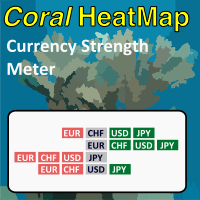
Coral Heatmap is a currency strength meter based on the ATR values for the selected timeframe. There are two main view modes: All Currencies (default) - see the ranked strength of all currencies in a single view Selected Currency - see the relative strength of all other currencies compared to a selected currency You can optionally display the timeframe selection toolbar; timeframe is always synchronized to the current chart timeframe. Use keyboard shortcuts to quickly navigate currencies (up/d
Get FREE Advanced Online Course and Learn About Our Advanced Trading System, Link in the Bio! Click Here.
Our Mission and Vision: Why Am I Even Here?Here is The Deal Brother, We Offer: Premium Quality Indicators: The Highest Quality Possible Algorithms. Unlimited Activations: Can be used on Unlimited number of Computers, MT4s and MT5s for lifetime. Inexpensive Prices: 30$ is the lowest price possible, Knowing that more than 50% of our Indicators are 100% FREE.
But Why Am I telling You this?
FREE

移動平均線クロス、ボリンジャーと移動平均線のクロス、移動平均線の角度でサイン表示
MT5インジケータ こちらに サイト とがあります。 このインジケータは3つのパターンでサインを表示(切り替え可能)します。 ① 移動平均線のクロス ② ボリンジャーバンドと短期移動平均線とのクロス ③ ボリンジャーバンドと短期移動平均線とのクロスと、中期移動平均線と長期移動平均線の角度 移動平均線のクロス 指定した短期移動平均線と長期移動平均線のゴールデンクロスでは買いサイン、デットクロスでは売りサインを表示します。 ディフォルトでは短期は5,長期は20となっています。 もちろん変更可能になります。 移動平均線の種類をEMA(指数平滑移動平均線)やSMMA(平滑化移動平均)などに変更可能で適する価格も変更可能になります。 ボリンジャーバンドと短期移動平均線のクロス ボリンジャーバンド(以降BB)と短期移動平均線のクロスでサインを表示します。 ディフォルトではBB+1σと5MAのゴールデンクロスで買いサイン、BB-1σと5MAのデットクロスで売りサインでサインを表示します。 BBの期間や、B
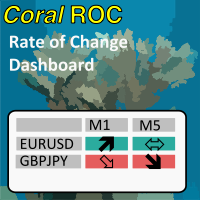
Coral Rate of Change Dashboard displays "rate of change" calculations across multiple symbols and timeframes simultaneously. See at a glance which pairs are moving, and how quickly. Receive alerts when any symbol + timeframe is experiencing very strong movement. You can display data for currency pairs, or for individual currencies (takes the average for each currency across all available pairs). See the CoralDash product description for the core functionality of the dashboard (symbol exposu
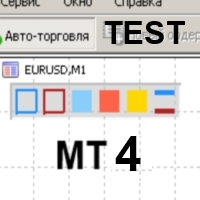
Color Levels - удобный инструмент для тех, кто использует технический анализ с использованием таких инструментов, как Трендовая линия и Прямоугольник. Имеется возможность настройки двух пустых прямоугольников, трех закрашенных и двух трендовых линий. Настройки индикатора крайне просты и делятся на пронумерованные блоки: С цифрами 1 и 2 вначале - настройки пустых прямоугольников (рамок); С цифрами 3, 4 и 5 - настройки закрашенных прямоугольников; С цифрами 6 и 7 - настройки трендовых линий. Объе
FREE
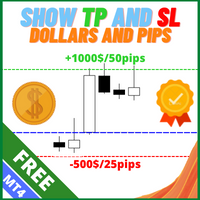
Description: For a comprehensive understanding of our indicators, we invite you to explore the entire Q&A section within this MQL5 blog post here . The "Show TP and SL Values" Indicator is a valuable technical analysis tool designed to enhance your trading experience by displaying the (TP) and (SL) levels directly on your chart. This simple yet effective tool provides traders with crucial information, allowing for better decision-making and risk management. Key Features: TP and SL Display:
FREE

This indicator simplifies your entry zones by displaying the areas where you can plan your entry that potentially could give you high risk/reward ratios. Other than picking the most optimal entry points, the Hot Zone indicator can act as your typical support/resistance indicator for pullbacks for all timeframes. You can use this indicator as the only trading indicator or use it with another indicator for reentry purposes. Besides, when using Hot Zones, the risk/reward ratio should be well abov
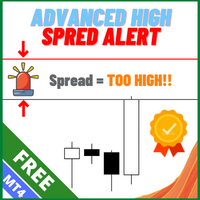
Description: For a comprehensive understanding of our indicators, we invite you to explore the entire Q&A section within this MQL5 blog post here . The "High Spread Alert" Indicator is a valuable tool for traders, providing real-time information about spread fluctuations in the forex market. As a technical analysis tool, it helps traders make informed decisions by alerting them to periods of high spread, which can impact trading conditions and execution. Key Features: Spread Monitoring: The i
FREE

Индикатор "Trend zone" Помощник трейдеру, показывает на графике текущую тенденцию. Он надеюсь станет незаменимым индикатором в ваше трейдинге. Индикатор не перерисовывается и не меняет свои значения про переключение временных периодов The "Trend zone" indicator is a trader's assistant, shows the current trend on the chart. I hope it will become an indispensable indicator in your trading. The indicator does not redraw and does not change its values about switching time periods
FREE
Индикатор "BO indicator at zero bar" для торговли бинарных опционов. Индикатор выдаёт свои сигналы на нулевом баре не перерисовывает и не меняет свои показатели при переключении временных периодов. Рекомендую использовать индикатор совместно с другим индикатором как фильтр "BO indicator at zero bar" indicator for binary options trading. The indicator gives its signals on the zero bar, does not redraw and does not change its indicators when switching time periods. I recommend using the indicato
Индикатор "Reversal zone" показывает силовые уровни и возможные точки разворота на текущем графике. Индикатор "Reversal zone" поможет трейдеру разобраться с текущей ситуацией The "Reverse zone" indicator shows power levels and possible reversal points on the current chart. The "Reverse zone" indicator will help the trader to deal with the current situation

Индикатор "Zigzag levels" основан на индикаторе зигзаг. Индикатор показывает зоны уровней поддержки и сопротивления относительно индикатору зигзаг. Индикатор "Zigzag levels" сделает хорошую службу в вашем трейдинге. Всем больших профитов!!! The Zigzag levels indicator is based on the zigzag indicator. The indicator shows the zones of support and resistance levels relative to the zigzag indicator. The Zigzag levels indicator will do a good service in your trading. Big profits for everyone!!!
(Automatische Übersetzung) Die meisten Händler kennen den berühmten japanischen Heikin-Ashi- Indikator, der im 18. Jahrhundert von Munehisa Homma entwickelt wurde. Es wird manchmal Heiken-Ashi geschrieben, aber seine Bedeutung bleibt dieselbe, nämlich „durchschnittlicher Balken“ auf Japanisch. Dies ist eine Implementierung des sehr bekannten Heikin-Ashi- Indikators, jedoch mit einigen zusätzlichen Funktionen. Zum einen ermöglicht es die Gewichtung seiner Werte nach dem Volumen , sei es das Tick-
FREE

Tritt dem Koala Trading Solution-Kanal in der MQL5-Community bei, um die neuesten Signale und Nachrichten zu allen Koala-Produkten zu erfahren. Der Beitrittslink befindet sich unten: https://www.mql5.com/en/channels/koalatradingsolution Beschreibung :
Wir freuen uns, Ihnen unseren neuen kostenlosen Indikator vorzustellen, der auf einem der professionellen und beliebten Indikatoren auf dem Devisenmarkt (Parabolic SAR) basiert. Dieser Indikator ist eine neue Modifikation des ursprünglichen Pa
FREE

MT5-Version Fibonacci-Bollinger-Bänder MT4 Fibonacci Bollinger Bands ist ein hochgradig anpassbarer Indikator, der Unterstützungs- und Widerstandsbereiche anzeigt. Dieser Indikator kombiniert die Logik für die Bollinger-Bänder mit dem Fibonacci-Level. Fibonacci-Bollinger-Bänder sind der Erste Indikator auf dem Markt, der es dem Benutzer ermöglicht, bis zu 12 Fibonacci-Levels, den Typ des gleitenden Durchschnitts und die für die Berechnungen zu verwendende Preisdatenquelle zu 100% anzupasse
FREE
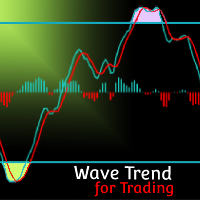
MT5-Version Wellentrend MT4 Wave Trend ist ein Oszillator, der dabei hilft, Marktumkehrungen auf äußerst genaue Weise zu identifizieren. Dass der Oszillator über dem überkauften Niveau liegt und ein Abwärtskreuzen des schnellen in den langsamen MA zeigt normalerweise ein gutes VERKAUFS-Signal an. Wenn die Oszillatoren unter dem überverkauften Niveau liegen und der schnelle MA den langsameren MA kreuzt, hebt dies normalerweise ein gutes KAUFEN-Signal hervor. Der Wave Trend Indikator kann auch v
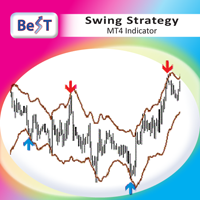
BeST Swing Strategy is a Metatrader indicator based on the corresponding Jim Berg's work about volatility as described in his article "The Truth About Volatility" (TASC 2/2005).The indicator consists of 2 channel lines deriving as (MA +/- times the ATR) and can be used as a standalone trading system.The outlier prices of the Market as of the indicator's values can be used for producing Entry and Exit Signals.
Advantages of the indicator == Uses 2 Swing Strategies (Normal and Reverse)
== Never

Contact me after payment to send you the User-Manual PDF File. ADVANCE PRICE ACTION TRADING CONCEPT. To test the indicator, you can download the demo version on my product list. it’s free (only shows patterns that have occurred in the past of the market). Quasimodo is a reversal trading pattern that appears at the end of an uptrend. As a price formation, the Quasimodo pattern is depicted by three peaks and two valleys, where: First, the middle peak is the highest, while the outside two peaks
The only volatility calculator for ANY custom time period. Place up to 5 vertical lines on chart at your chosen times to find the average volatility / expected price movement for any custom time period starting at each line time (e.g. from the time you opened your trade or from the start of a session etc). Use the average volatility to set achievable take profit targets for your trades. Also use the visual on-chart HISTORICAL lines to easily analyse price action at specific times of day + get

** All Symbols x All Timeframes scan just by pressing scanner button ** *** Contact me to send you instruction and add you in "RSI scanner group" for sharing or seeing experiences with other users.
Introduction RSI divergence is a main technique used to determine trend reversing when it’s time to sell or buy because prices are likely to drop or pick in the charts. The RSI Divergence indicator can help you locate the top and bottom of the market. This indicator finds Regular divergence for pul

The Qv² Halifax - Indicator developed through a complex series of calculations, which aims to easily identify buylng and selling signals.
Buy signal are indicated by up arrows.
Sell signal are indicated by down arrows.
An important detail: In order to make the indicator work, the timeframes M1, M5. M15. M30, H1 D1 must be all updated.
It can be used on all pairs (I use it on Gold).
it is a very good deal in the trending market
To learn more about my work click here
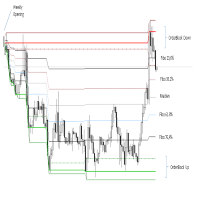
The indicator is activated at the beginning of each week and detects both bullish and bearish ORDERBLOCK potentials. These levels are of high operational probability, being able to use a minimum ratio of 3 to 1 to maximize profits. It is recommended to use pending orders at the OB levels of the chart and place the SL up to a maximum of 20 pips from the entry price.
Submit the indicator to Backtesting to become familiar with its performance and complement it with other trend or oscillation type

The indicator is triggered at the start of each trading day and detects both bullish and bearish ORDERBLOCK potentials. These levels are of high operational probability, being able to use a minimum ratio of 3 to 1 to maximize profits. It is recommended to use TimeFrame M5 to M30 for a proper display and consider pending orders at the OB levels of the chart and place the SL up to a maximum of 20 pips from the entry price.
Submit the indicator to Backtesting to become familiar with its performan

RSI Trend Line is a simple indicator that draws trend lines.
Parameters:
Level Step - the step between the highs and lows.
Period_RSI - standard parameter of the RSI indicator.
Upper Line Color - sets the color of the trend lines for UP.
LowerLine Color - sets the color of the trend lines for Down.
Alerts - the parameter is responsible for On/Off notifications when trend lines intersect with RSI. By default, it is On.
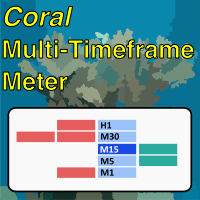
Coral Multi TF Meter allows you to quickly see how price is moving on a single currency pair across multiple timeframes at once. You can select which timeframes to display; the size, position, colors of cells; whether to display values or not; and how often the meter is updated. The calculation is based on ATR distance for each displayed timeframe. Hover over the header cell for the row (with the currency name in it) to see the current ATR value (in pips) for that period. When "Display Values
Highly configurable Force Index indicator. Features: Highly customizable alert functions (at levels, crosses, direction changes via email, push, sound, popup) Multi timeframe ability Color customization (at levels, crosses, direction changes) Linear interpolation and histogram mode options Works on strategy tester in multi timeframe mode (at weekend without ticks also) Adjustable Levels Parameters:
Force Index Timeframe: You can set the current or a higher timeframes for Force Index. Force Ind
FREE
Highly configurable Rate of Change (ROC) indicator. Features: Highly customizable alert functions (at levels, crosses, direction changes via email, push, sound, popup) Multi timeframe ability Color customization (at levels, crosses, direction changes) Linear interpolation and histogram mode options Works on strategy tester in multi timeframe mode (at weekend without ticks also) Adjustable Levels Parameters:
ROC Timeframe: You can set the current or a higher timeframes for ROC. ROC Bar Shift:
FREE
CoralPage is a simple little utility to add navigation controls to your chart. You can now easily step through the symbols in the Market Watch without having to click-and-drag a symbol from the Market Watch onto your chart. It's a simple but indispensable time-saver! Click move to the first, previous, next or last symbol in the Market Watch. Shift-click to go the the previous or next symbol that has an open order. CoralPage is completely free. If you like this, please check out my other prod
FREE

CoralDash is a simple symbol shortcut dashboard. The Symbol List has many presets to choose from: Market Watch Open Orders Current Chart Majors A custom list Clicking the symbol has two available actions Set the current chart symbol Filter the list of symbols shown in the dashboard based on one currency (e.g., see all EUR pairs) Click the "PAIR" cell in the header to toggle between the two available actions Click the symbol cell to apply the action For the filter, click the left side to selec
FREE

Этот индикатор имеет универсальный алгоритм торговли, который основан на импульсе цены . Все максимально упрощено - только сигналы на Buy и Sell . Есть оповещения, чтобы не пропустить открытие позиции.
Не требует оптимизации и дополнительных настроек!
Для любых типов инструментов: валюты, нефть, металлы, криптовалюты. Для любых таймфреймов: от M1 до D1 . Для любых стилей торговли: скальпинг, интрадэй, свинг, долгосрок . Если Вам необходима дополнительная информация или есть вопросы по

The indicator (Current Strength) is represented in a separate window by Blue and Pink histogram . The parameter NPeriod represents the number of bars on which we calculate the variation of forces, the recommended value is 5. The Blue histogram measures the buyers force , while the Pink histogram measures the sellers force . The change in color signifies the change in strength which leads t he price . Each drop (especially below 52.8) after touching levels 96.3 or 1.236 must be condidered

Индикатор " Nostradamus ind" мощный инструмент для торговли на рынке форекс. " Nostradamus ind" не перерисовывается и не меняет свои значения при переключении временных периодов. The "Nostradamus ind" indicator is a powerful tool for trading on the forex market. "Nostradamus ind" does not redraw and does not change its values when switching time periods.

Индикатор "Trend direction ind" является трендовым индикатором. Индикатор "Trend direction ind"не запаздывает, выдает сигналы на нулевом баре и не перерисовывает при переключении таимфреймов. С индикатором "Trend direction ind" вы будете с легкостью определять текущую тенденцию. The "Trend direction ind" indicator is a trend indicator. The "Trend direction ind" indicator does not lag, gives signals at the zero bar and does not redraw when switching time frames. With the "Trend direction ind
This indicator helps to trade in the right direction of the market, by knowing the bias of the market. If you are a swing trader this is the best indicator for you. You will just see the bias on the top right of your chart/screen. You can sometime wait for reversals then continue with the trend/bias. Indicator is based on moving averages and showing daily bias of the market. KEEP IN MIND THAT THE BIAS IS STRICTLY SHOWING THE DAILY TIMEFRAME TREND ONLY.
You can check the video attached.
German Schreiben Sie auf Russisch 'WICHTIGER HINWEIS – LIZENZ & AKTIVIERUNG ERFORDERLICH' Aktivierungsanweisungen: Kontaktieren Sie uns bitte sofort nach Abschluss Ihres Kaufs, um Ihren Lizenzschlüssel, Ihr Passwort oder Ihre Aktivierungsdetails zu erhalten. Ohne diese funktioniert die Software nicht. Wir sind hier, um einen reibungslosen Aktivierungsprozess zu gewährleisten und Ihnen bei Fragen zu helfen. Mehrsprachige Anpassung Um Ihr Handelserlebnis zu verbessern, bieten wir eine volls

** All Symbols x All Timeframes scan just by pressing scanner button ** *** Contact me to send you instruction and add you in "ABCD scanner group" for sharing or seeing experiences with other users. Introduction This indicator scans AB=CD retracement patterns in all charts. The ABCD is the basic foundation for all harmonic patterns and highly repetitive with a high success rate . The ABCD Scanner indicator is a scanner reversal ABCD pattern that helps you identify when the price is about to ch
Der Tick-Indikator
ist ein sehr leistungsfähiges Werkzeug für das Scalping. Es zeigt Ihnen die Auf- und Abwärtsbewegung auf dem Markt.
Auf diese Weise können Sie die Richtung viel schneller erkennen.
Der Indikator ist sehr einfach zu installieren und kann in allen Zeitrahmen und allen Paaren Forex, Bitcoin .....
Installieren Sie einfach die Datei im Indikatorordner Ihres MT4-Terminals, aktualisieren oder starten Sie das Terminal neu und ziehen Sie es auf das Diagramm, das Sie handeln möchte
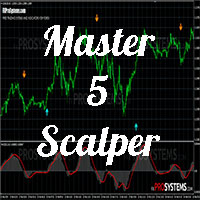
Hallo Trader, insbesondere Scalper Dieses Mal stelle ich einen speziellen Indikator für Scalper in einem 5-Minuten-Zeitrahmen vor
Es wird erwartet, dass dieser Indikator für Anfänger hilfreich ist, die verwirrt sind, wenn sie nach einem leicht verständlichen Scalper-Indikator suchen
OK fortfahren
Dieser Indikator läuft nur in einem 5-Minuten-Zeitrahmen Dieser Indikator ist auch in der Lage, Händlern Benachrichtigungen über das Handy bereitzustellen, indem er die MQID auf Ihrer Handelsplattfo

MT5-Version MA-Band MT4 MA Ribbon ist ein erweiterter Indikator mit einem gleitenden Durchschnitt von 8 Perioden. Das MA-Band kann verwendet werden, um die Trendrichtung und Umkehrung zu identifizieren und Marktfortsetzungspunkte sowie potenzielle Einstiegspunkte, partielle Gewinnpunkte und Ausstiegspunkte. JETZT KOSTENLOS AUSPROBIEREN! Einstiegspunkte für Long- und Short-Positionen können gefunden werden, wenn der Preis in das Band eintritt oder es verlässt, erneut testet oder eine de

Volatility under control. The indicator shows the optimal depth for setting goals within the day and on the average trend. It also builds pivot zones for the estimated correction depth. As an accompaniment, the key levels of the structure are displayed for several timeframes. Classical volatility indicators ATR & ADX on fixed timeframes are used for calculation. The calculation takes into account the spread, and if the market is slightly volatile, you will see a warning about the risk. You can c
FREE

Der technische Indikator sucht in Echtzeit nach Kerzen, die die in den Einstellungen festgelegte Größe überschreiten und gibt Signale an. In der Regel erscheinen solche ungewöhnlich großen Kerzen entweder am Anfang starker Impulse oder am Ende einer gerichteten Kursbewegung. Am Anfang des Impulses kann das Signal als Grundlage für die Suche nach einem Einstiegspunkt dienen, am Ende der Bewegung ist es ein Zeichen für einen Höhepunkt und kann von einem nahen Ende des Trends sprechen. Die Referenz
FREE

Odyssey is a global trend indicator. If you do not yet have your own trading strategy, you can use our ready-made trading strategy. This is a hybrid trend indicator, as it is based on the signals of several internal algorithms. The indicator also uses the oscillator algorithm in recalculations. The indicator also calculates the oversold and overbought levels of a trading instrument. Thus, having all the necessary information, the indicator generates signals when the trend changes.
Despite the

Anand is a forex trend arrow indicator for identifying potential entry points. I like it, first of all, because it has a simple mechanism of work, adaptation to all time periods and trading tactics. It indicates a short-term and long-term trend. operations. The simplest way to use the indicator is to open a trade in the direction of an existing trend. The indicator allows you to study the real and historical market trends in more detail!
Determining the market trend is an important task for tr

The main application of the Rwanda indicator is to generate buy and sell signals. Displays the Rwanda indicator signals on the price function chart using a mathematical approach. The indicator determines the long-term and short-term trend. The best result is given by the combination of the indicator with fundamental news, it can act as a news filter, that is, it can show how the market reacts to this or that news.
With this indicator, you can predict future values. The indicator is designed to

One of the main definitions for monitoring the currency market is a trend, which is why the Citizen indicator was created in order to display the trend in a visual form. You should use the indicator as an additional indicator, that is, you need to use this indicator for example to perfectly display price movements! Its signals are based on a reliable algorithm. When used simultaneously on multiple timeframes, this indicator truly "makes the trend your friend". With it, you can follow trends on m

The main purpose of the Deathly indicator is to evaluate the market. Red dots indicate that the priority should be to open SELL positions. The blue color indicates that it is time for BUY trades. Using the indicator is very convenient and easy. The indicator is universal. It is applied at any time intervals. You can use the indicator to trade different assets. The tool is perfect for Forex trading. It is actively used for trading in commodity, commodity and stock markets.
The indicator impleme

The Andhadhun trend step indicator will give you stability if you follow his signals. And you will be able to distinguish between work and the emotional component. It basically uses the process of identifying the rate of change in price growth and allows you to find entry and exit points from the market. Just look at the screenshots and you will determine the principles of working with the indicator yourself.
The indicator analyzes the state of the market, the phase of its movement and largely

A fundamental technical indicator that allows you to assess the current market situation in order to enter the market of the selected currency pair in a trend and with minimal risk.
Many beginners who first enter the market often have better luck than a professional who has spent years learning. The reason for this phenomenon is the unconscious entry of beginners into the trend, when even without any indicators it becomes clear where the market is moving.
The Apartment indicator basically us

The intelligent algorithm of the Godfather indicator accurately determines the trend, filters out market noise and generates entry and exit levels. The indicator will help in finding entry points when analyzing the price chart. The program first receives a "snapshot" of the graph, then analyzes it. The results are reported to the trader in the form of signals. The main purpose of this indicator is to determine the moments of entries and exits from transactions, so the indicator displays only th

With the help of the Elephant Forex indicator algorithm, you can quickly understand what kind of trend is currently developing in the market. The indicator indicates on the chart the main trend at the current moment in the market. A change in direction, in terms of market fundamentals, means a shift in trading interest towards sellers or buyers.
If you do not take into account speculative throws, which as a result do not affect the overall trend, then the moment of a real “reversal” is always

The advantage of working on the Special Agent signal indicator is that the trader does not need to independently conduct a technical analysis of the chart. Determining the market trend is an important task for traders, and the tool gives ready-made signals in the form of directional arrows. This tool is an arrow (signal).
Special Agent is a trend indicator, a technical analysis tool that helps to determine the exact direction of the trend: either up or down price movement for a trading pair of

Indikator, der Dir jederzeit die aktuelle Anzahl sowie Gewinn- und Verlustsumme der geschlossenen Deals im eingeloggten Konto für einen einstellbaren Zeitraum anzeigt. Dazu am besten "Komplette Historie" in der Kontohistorie laden und dann den gewünschten Zeitraum (z.B. 1.1.2022-1.1.2023, also Kalenderjahr 2022) eingeben. Eingabe-Optionen: - Zeitraum (Achtung: entsprechende Daten müssen in die Kontohistorie des Terminals geladen werden) - Anzeige Dealanzahl - Anzeige GuV gesamt - Anzeige GuV fü
The principle of this indicator is very simple: detecting the trend with Moving Average, Predicting BUY and SELL signals with arrows, alerts and notifications. The parameters are fixed and automatically calculated on M30 timeframe. You can trade with small timeframe or using Dash DIY Ai Robot, Dash Smart Boxing5 Strategy for autotrading on any timeframe and any currency pairs. You can download template and the presets file for autotrading with Dash Smart Boxing5 Strategy . Example: If you instal

Features:
- Moving Average Slope for Max Past Bars - Slope Period - Slope Thresholds - Multiple Slope Type options - See slope visually as a histogram - Info Panel Show/Hide Slope Calculations and Types:
The slope value is calculated using the Slope Period. Suppose Period is 5, it will check the MA value for bar (x) and bar (x+5). And find the slope angle between them.
Read detailed description about Slope Types and Settings here: https://www.mql5.com/en/blogs/post/747651
FREE
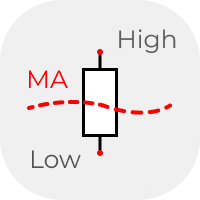
The classic idea of comparing the size of candles. Above / below - the average for a certain period. Usually used on D1, W1 and higher timeframes in candlestick analysis patterns. But you can also use the data from the indicator in your analysis system. The data is presented as a histogram in a separate window. The averaging method can be selected in the settings.
FREE

Gartley Hunter - An indicator for searching for harmonic patterns (Gartley patterns) and their projections. The indicator is equipped with a system of alerts and push notifications. Manual (Be sure to read before purchasing) | Version for MT5 Advantages
1. 12 harmonic patterns: 7 classical and 5 exotic. New patterns will be added as the indicator develops. 2. Constant automatic search for harmonic patterns. The indicator is capable of finding from the smallest to the largest patterns. 3. Automa

Result look on https://t.me/BonosuProBinary Pair : All Forex Pairs Time Frame : M1 Expaired : 1-2 Minutes Trade Time Once Time a Day Backtester, Alert Avaliable Average Signals Generate 5 - 20 Signals All Pair A Day Broker Time Zone GMT+3 Default Setting [Example Broker GMT+3 : Alpari, FBS, XM] Support Broker : Deriv, IQOption, Alpari, Binomo, Olymtrade, Qoutex, GCoption, etc Support Auto Trading : MT2 Trading, Binary Bot, Intrade Bot, Binomo Bot, Olymptrad Bot, MX2 trading, Price Pro, etc Ind
Der MetaTrader Market ist die beste Plattform für den Verkauf von Handelsroboter und technischen Indikatoren.
Sie brauchen nur ein gefragtes Programm für die MetaTrader Plattform schreiben und schön gestalten sowie eine Beschreibung hinzufügen. Wir helfen Ihnen, das Produkt im Market Service zu veröffentlichen, wo Millionen von MetaTrader Benutzern es kaufen können. Konzentrieren Sie sich auf dem Wesentlichen - schreiben Sie Programme für Autotrading.
Sie verpassen Handelsmöglichkeiten:
- Freie Handelsapplikationen
- Über 8.000 Signale zum Kopieren
- Wirtschaftsnachrichten für die Lage an den Finanzmärkte
Registrierung
Einloggen
Wenn Sie kein Benutzerkonto haben, registrieren Sie sich
Erlauben Sie die Verwendung von Cookies, um sich auf der Website MQL5.com anzumelden.
Bitte aktivieren Sie die notwendige Einstellung in Ihrem Browser, da Sie sich sonst nicht einloggen können.