
Data Science and Machine Learning (Part 05): Decision Trees
What is a Decision Tree?
A decision tree is a type of supervised Machine Learning technique used to categorize or make predictions based on how a previous set of questions were answered. A model is a form of supervised learning, meaning that the model is trained and tested on a set of data that contains the desired categorization.
The decision tree may not always provide clear-cut answers or decisions Instead, it may present the options so the data scientist can make an informed decision of their own. Decision trees imitate the way we humans think, so it's generally easy for data scientists to understand and interpret the results.

Terminology Alert!
I forgot to describe the terminology of supervised and unsupervised learning in my first article of this series, so here it is.
Supervised Learning
Supervised learning is an approach to creating artificial intelligence (AI), where a computer algorithm gets trained on input data that is labeled for a particular output, the model is trained until it can detect the underlying patterns and relationships between the input data and the output labels, enabling it to yield accurate results when presented with never seen before data.
In contrast to supervised learning, in this approach, the algorithm is presented with unlabeled data and designed to detect patterns or similarities on its own.
Algorithms commonly used in supervised learning programs include the following:
- Linear regression
- Logistic regression
- Decision Trees
- Support Vector Machines
- Random forests
The chief difference between supervised and unsupervised learning is in how the algorithm learns. In unsupervised learning, the algorithm is given unlabeled data as a training set. Unlike in supervised learning, there are no correct output values; the algorithm determines patterns and similarities within the data as opposed to relating it to some external measurements, in other words, algorithms can function freely to learn more about the data and find interesting or unexpected things that human beings weren't looking for.
We are currently on supervised learning we will learn about unsupervised learning in the next few articles.
How do decision Trees work?
Decision Trees use multiple algorithms to decide to split a node into two or more subset nodes. The creation of subnodes increases the homogeneity of resultant sub-nodes. In other words, we can say that the purity of the node increases concerning the target variable. The decision tree algorithm splits nodes on all available variables and then selects the split that results in the most homogeneous sub-nodes.
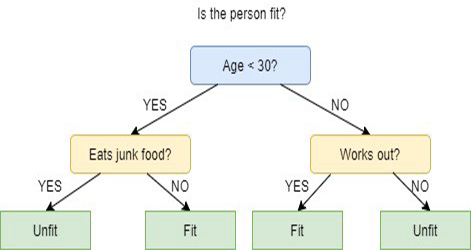
The algorithm selection is based on the type of target variables.
The following are the Algorithms used in the Decision Tree:
- ID3 > Extension of D3
- C4.5 > Successor of ID3
- CART > Classification and Regression Tree
- CHAID > Chi-square Automatic Interaction Detection, performs multi-level splits when computing classification trees
- MARS > Multivariate Adaptive Regression Splines
In this article I am going to create a decision tree based on the ID3 algorithm, we'll discuss and use the other algorithms in the next Articles of this series.
The Goal of Decision Tree
The main goal of the decision trees algorithm is to separate the data with impurity and into pure or close to nodes, for example, there is a basket with apples are mixed with oranges and the decision tree when is trained on how apples look like in terms of their color and size, will separate oranges into their own basket and oranges in their own basket too.
ID3 Algorithm
ID3 stands for Iterative Dichotomiser 3 and is named such because the algorithm iteratively(repeatedly) dichotomizes (divides) features into two or more groups at each step.
Invented by Ross Quinlan, ID3 uses a top-down greedy approach to build a decision tree. In simple words, the top-down greedy approach means that it starts building the tree from the top and the greedy approach means that at each iteration we select the best feature at the present moment to create a node.
Generally, ID3 is only used for classification problems with nominal data(basically, data that cannot be measured).
That being said, there are two types of Decision Trees.
- Classification Trees
- Regression Trees
01: Classification Trees
Classification trees are just like the tree we are about to learn in this Article, where we have features with no continuous numerical or ordered values, that we want to classify.
Classification trees classify things into categories.
02: Regression Trees
These are built with ordered values and with continuous values .
Decision Tree predicts numerical values.
Steps in ID3 Algorithm
01: It begins with the original dataset as the root node.
for the sake of building the basic library, we are going to use the simple dataset of playing tennis in certain weather conditions, here is our dataset overview, this is a small dataset (only 14 rows).
To draw a decision tree using this Algorithm we need to understand which attributes provides the most information gain of all the Attributes, let me explain.
One of these attributes (columns) has to be a root node to begin with but, how do decide which column to be a root node? This is where we use the Information gain.
Information Gain
Information gain calculates the reduction in the entropy and measures how well a give feature separates or classifies the target classes. The feature with the highest information gain is selected as the best one.
![]()
Entropy
entropy is the measure of uncertainty of a random variable, it characterizes the impurity in the given sample.
The formula for entropy is,
![]()
The first thing that we have to do is to find the entropy of the entire dataset, by this it means finding the entropy of target variables since all these columns are projected to the target column PlayTennis.
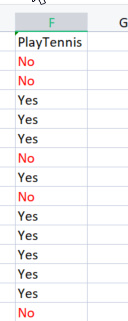
let's write some code,
we know for sure that before we can find the entropy of our target variables we need to have the total number of negative values marked No and positive values marked Yes, these values could help us obtain the probabilities of the elements inside our column to obtain such values let's write code to do such a thing inside Entropy Function
double CDecisionTree::Entropy(int &SampleNumbers[],int total)
 {
    double Entropy = 0;
    double entropy_out =0; //the value of entropy that will be returned

     for (int i=0; i<ArraySize(SampleNumbers); i++)
        {
              double probability1 = Proba(SampleNumbers[i],total);
              Entropy += probability1 * log2(probability1);
        }

    entropy_out = -Entropy;

    return(entropy_out);
 }
The function is easy to understand at a glance especially if you've read the formula but, pay attention to the Array SampleNumbers[] The samples are what is is the inside are the column, we can also refer to samples as the classes for example in this target column our samples are Yes and NO.
Successfully run of the function on the TargetArray column will result into
12:37:48.394    TestScript      There are 5 No
12:37:48.394    TestScript      There are 9 Yes
12:37:48.394    TestScript      There are 2 classes
12:37:48.394    TestScript      "No"  "Yes"
12:37:48.394    TestScript      5     9
12:37:48.394    TestScript      Total contents = 14
Now that we have these numbers let's proceed finding the entropy using this our formula
![]()
if you pay attention to the formula, you'll notice that the logarithm that we are dealing with here is that of base 2, which is binary logarithm(read for more information) to find the log of base 2 we divide the log2 to the log of the argument value.
double CDecisionTree::log2(double value)
 {
   return (log10(value)/log10(2));
 }
Since the base is the same, it's all good.
I have also coded a function Proba( ) to help us get the probability of a class of values, here it is.
double CDecisionTree::Proba(int number,double total)
 {
    return(number/total);
 }
Elephant in the room. To find the probability of an element in our column we find how many times it has appeared divide by the total number of all elements in that column, You may have noticed that there are 5 elements which are No and 9 elements which are Yes so,
probability of no = 5/14(total number of elements) = 0.357142..
probability of yes = 9/14(same story) = 0.6428571...
Finally, to find the Entropy of an Attribute/dataset column
     for (int i=0; i<ArraySize(SampleNumbers); i++)
        {
              double probability1 = Proba(SampleNumbers[i],total);
              Entropy += probability1 * log2(probability1);
        }
      entropy_out = -Entropy;
If we run this function on the Target varible the output will be
13:37:54.273    TestScript      Proba1 0.35714285714285715
13:37:54.273    TestScript      Proba1 0.6428571428571429
13:37:54.273    TestScript      Entropy of the entire dataset = 0.9402859586706309
B A M
Now we know the entropy of the entire dataset which is basically the entropy of the values of y, and we have the function to find the entropy in hand. Let's find the entropy of each and every column in the dataset.
Now that we have the entropy of the entire dataset, The Next Step is to Find the Entropy of Members Inside Each Independent variable column, The aim of finding this kind of entropy in independent variables is to help us find the Information gain, for each data column.
Before we use our Library to find the Entropy of the Outlook column let's calculate it by hand so that you can get a clear understanding on what is being done.
We take the column outlook in comparison to its target variable.
Outlook vs PlayTennis Column
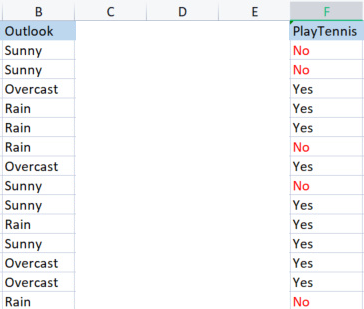
Unlike how we did find the Entropy of the Entire dataset which is also referred to as the Entropy of the Target variable, To find the Entropy of an Independent variable we have to refer it to the Target variable since that is our goal,
Values in Outlook
We have 3 different values which are Sunny, Overcast and Rain. we have to find the entropy of each of these values with respect to their target variable
Samples(Sunny) (positive and negative samples of Sunny) = [2 Positive (The Yes's), 3 Negative(The No's)]
Now that we have the number of positives and negatives, The Probability of Yes Playing Tennis in a sunny day will be
probability1= 2(number of times Yes appeared) / 5(total number of sunny days)
so 2/5 = 0.4
In Contrast
The probability of not playing on sunny day will be 0.6 i.e. 3/5 = 0.6
Finally, the entropy of playing in sunny day will be, refer to the formula
Entropy(Sunny) = - (P1*log2P1 + P2*log2P2)
Entropy(Sunny) = -(0.4*log2 0.4 + 0.6*log2 0.6)
Entropy(Sunny) = 0.97095
Now let's find the entropy of Overcast
Samples in overcast.
Positive samples 4 (samples with Yes in the Target column), Negative samples 0 (samples with No in the Target column). This Situation is an exception.
Exceptions in the ID3 Algorithm
When it happens that there is zero (0) negative samples while there are positive samples or the opposite, there is zero (0) positive samples meanwhile there are negative samples, whenever this happens the Entropy is bound to zero(0).
We say that is a pure node, there is no need of splitting it since it has homogenous samples you will understand more what I mean by this when we draw a tree.
Another exception is:
When it happens that is an equal number of Positive Samples and Negative Samples, mathematically the entropy will be one (1).
The only exception that we must handle effectively is when there is zero value in samples because zero may lead to zero divide here is the new function, with the ability to handle such exceptions.
double CDecisionTree::Entropy(int &SampleNumbers[],int total)
 {
    double Entropy = 0;
    double entropy_out =0; //the value of entropy that will be returned

     for (int i=0; i<ArraySize(SampleNumbers); i++)
        {
            if (SampleNumbers[i] == 0) { Entropy = 0; break; } //Exception

              double probability1 = Proba(SampleNumbers[i],total);
              Entropy += probability1 * log2(probability1);
        }

     if (Entropy==0)     entropy_out = 0;  //handle the exception
     else                entropy_out = -Entropy;

    return(entropy_out);
 }
Lastly, let's find the Entropy of Rain
Rain Samples;
There are 3 positive Samples (Samples with Yes in the Target column).
There are 2 Negative Samples (Samples with No in the Target column).
Finally the Entropy of playing Tennis in a rainy day.
Entropy(Rain) = - (P1*log2P1 + P2*log2P2)
Entropy(Rain) = -(0.6*log2 0.6 + 0.4*log2 0.4)
Entropy(Rain) = 0.97095
Here are the Entropy values we've obtained from Outlook column
| Entropy From Outlook column |
|---|
| Entropy(Sunny) = 0.97095 |
| Entropy(Overcast) = 0 |
| Entropy(Rain) = 0.97095 |
So, that is how to find the entropy of samples manually now if we use our program to find those entropies, the output will be:
PD      0       13:47:20.571    TestScript      <<<<<<<<    Parent Entropy  0.94029  A = 0  >>>>>>>>
FL      0       13:47:20.571    TestScript         <<<<<   C O L U M N  Outlook   >>>>>
CL      0       13:47:20.571    TestScript           <<   Sunny   >> total > 5
MH      0       13:47:20.571    TestScript      "No"  "Yes"
DM      0       13:47:20.571    TestScript      3 2
CQ      0       13:47:20.571    TestScript      Entropy of Sunny = 0.97095
LD      0       13:47:20.571    TestScript           <<   Overcast   >> total > 4
OI      0       13:47:20.571    TestScript      "No"  "Yes"
MJ      0       13:47:20.571    TestScript      0 4
CM      0       13:47:20.571    TestScript      Entropy of Overcast = 0.00000
JD      0       13:47:20.571    TestScript           <<   Rain   >> total > 5
GN      0       13:47:20.571    TestScript      "No"  "Yes"
JH      0       13:47:20.571    TestScript      2 3
HR      0       13:47:20.571    TestScript      Entropy of Rain = 0.97095
We are going to use these values to find the Information gain of the entire data using the formula we've discussed previously.
![]()
Now, let me find the entropy manually so that you understand what's going on behind closed doors.
Information Gain(IG) = EntropyofEntireDataset - Summation of the product of probability of a sample and its entropy.
IG = E(dataset) - ( Prob(sunny) * E(sunny) + Prob(Overcast)*E(Overcast) + Prob(Rain)*E(Rain) )
IG = 0.9402 - ( 5/14 * (0.97095) + 4/14 * (0) + 5/14(0.97095) )
IG = 0.2467 (This is an information gain of the Outlook Column)
When we convert the formula into code will be:
double CDecisionTree::InformationGain(double parent_entropy, double &EntropyArr[], int &ClassNumbers[], int rows_)
 {
    double IG = 0;

    for (int i=0; i<ArraySize(EntropyArr); i++)
      {
        double prob = ClassNumbers[i]/double(rows_);
        IG += prob * EntropyArr[i];
      }

     return(parent_entropy - IG);
 }
Calling the function
if (m_debug) printf("<<<<<< Column Information Gain %.5f >>>>>> \n",IGArr[i]);
Output
PF 0 13:47:20.571 TestScript <<<<<< Column Information Gain 0.24675 >>>>>>
Now, we have to repeat the process for all the columns and find their information Gains. The output will be:
RH      0       13:47:20.571    TestScript (EURUSD,H1)  Default Parent Entropy 0.9402859586706309
PD      0       13:47:20.571    TestScript (EURUSD,H1)  <<<<<<<<    Parent Entropy  0.94029  A = 0  >>>>>>>>
FL      0       13:47:20.571    TestScript (EURUSD,H1)     <<<<<   C O L U M N  Outlook   >>>>>
CL      0       13:47:20.571    TestScript (EURUSD,H1)       <<   Sunny   >> total > 5
MH      0       13:47:20.571    TestScript (EURUSD,H1)  "No"  "Yes"
DM      0       13:47:20.571    TestScript (EURUSD,H1)  3 2
CQ      0       13:47:20.571    TestScript (EURUSD,H1)  Entropy of Sunny = 0.97095
LD      0       13:47:20.571    TestScript (EURUSD,H1)       <<   Overcast   >> total > 4
OI      0       13:47:20.571    TestScript (EURUSD,H1)  "No"  "Yes"
MJ      0       13:47:20.571    TestScript (EURUSD,H1)  0 4
CM      0       13:47:20.571    TestScript (EURUSD,H1)  Entropy of Overcast = 0.00000
JD      0       13:47:20.571    TestScript (EURUSD,H1)       <<   Rain   >> total > 5
GN      0       13:47:20.571    TestScript (EURUSD,H1)  "No"  "Yes"
JH      0       13:47:20.571    TestScript (EURUSD,H1)  2 3
HR      0       13:47:20.571    TestScript (EURUSD,H1)  Entropy of Rain = 0.97095
PF      0       13:47:20.571    TestScript (EURUSD,H1)  <<<<<<  Column Information Gain 0.24675 >>>>>>
QP      0       13:47:20.571    TestScript (EURUSD,H1)
KH      0       13:47:20.571    TestScript (EURUSD,H1)     <<<<<   C O L U M N  Temp   >>>>>
PR      0       13:47:20.571    TestScript (EURUSD,H1)       <<   Hot   >> total > 4
QF      0       13:47:20.571    TestScript (EURUSD,H1)  "No"  "Yes"
OS      0       13:47:20.571    TestScript (EURUSD,H1)  2 2
NK      0       13:47:20.571    TestScript (EURUSD,H1)  Entropy of Hot = 1.00000
GO      0       13:47:20.571    TestScript (EURUSD,H1)       <<   Mild   >> total > 6
OD      0       13:47:20.571    TestScript (EURUSD,H1)  "No"  "Yes"
KQ      0       13:47:20.571    TestScript (EURUSD,H1)  2 4
GJ      0       13:47:20.571    TestScript (EURUSD,H1)  Entropy of Mild = 0.91830
HQ      0       13:47:20.571    TestScript (EURUSD,H1)       <<   Cool   >> total > 4
OJ      0       13:47:20.571    TestScript (EURUSD,H1)  "No"  "Yes"
OO      0       13:47:20.571    TestScript (EURUSD,H1)  1 3
IH      0       13:47:20.571    TestScript (EURUSD,H1)  Entropy of Cool = 0.81128
OR      0       13:47:20.571    TestScript (EURUSD,H1)  <<<<<<  Column Information Gain 0.02922 >>>>>>
ID      0       13:47:20.571    TestScript (EURUSD,H1)
HL      0       13:47:20.571    TestScript (EURUSD,H1)     <<<<<   C O L U M N  Humidity   >>>>>
FH      0       13:47:20.571    TestScript (EURUSD,H1)       <<   High   >> total > 7
KM      0       13:47:20.571    TestScript (EURUSD,H1)  "No"  "Yes"
HF      0       13:47:20.571    TestScript (EURUSD,H1)  4 3
GQ      0       13:47:20.571    TestScript (EURUSD,H1)  Entropy of High = 0.98523
QK      0       13:47:20.571    TestScript (EURUSD,H1)       <<   Normal   >> total > 7
GR      0       13:47:20.571    TestScript (EURUSD,H1)  "No"  "Yes"
DD      0       13:47:20.571    TestScript (EURUSD,H1)  1 6
OF      0       13:47:20.571    TestScript (EURUSD,H1)  Entropy of Normal = 0.59167
EJ      0       13:47:20.571    TestScript (EURUSD,H1)  <<<<<<  Column Information Gain 0.15184 >>>>>>
EL      0       13:47:20.571    TestScript (EURUSD,H1)
GE      0       13:47:20.571    TestScript (EURUSD,H1)     <<<<<   C O L U M N  Wind   >>>>>
IQ      0       13:47:20.571    TestScript (EURUSD,H1)       <<   Weak   >> total > 8
GE      0       13:47:20.571    TestScript (EURUSD,H1)  "No"  "Yes"
EO      0       13:47:20.571    TestScript (EURUSD,H1)  2 6
LI      0       13:47:20.571    TestScript (EURUSD,H1)  Entropy of Weak = 0.81128
FS      0       13:47:20.571    TestScript (EURUSD,H1)       <<   Strong   >> total > 6
CK      0       13:47:20.571    TestScript (EURUSD,H1)  "No"  "Yes"
ML      0       13:47:20.571    TestScript (EURUSD,H1)  3 3
HO      0       13:47:20.571    TestScript (EURUSD,H1)  Entropy of Strong = 1.00000
LE      0       13:47:20.571    TestScript (EURUSD,H1)  <<<<<<  Column Information Gain 0.04813 >>>>>>
IE      0       13:47:20.571    TestScript (EURUSD,H1)
Now that We have the Information Gain(s) for all the columns we are going to start drawing our Decision Tree, How?
The Aim of This initial process was to find the information gains for all the columns so that we can decide which column to be the Root Node, The Column with a big number of information gain than all the other will become the root node, In this case the Outlook has the highest Information Gain so it will become the Root Node of our decision Tree, let's draw the tree now.
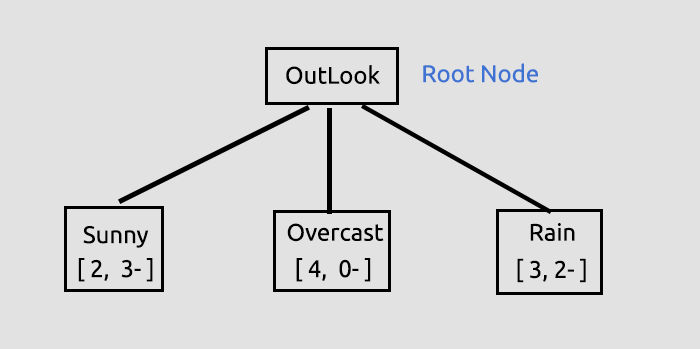
This Information on outlook is given by the Library, when you run the Script Test Script linked at the end of the Article, a lot of information is being printed when you are on debug mode of the library which is default.
The Information gain was obtained, from its function then stored inside an Array of double values that stores all the information gains, then finally the maximum value inside an array will be our target value.
         //--- Finding the Information Gain

                        ArrayResize(IGArr,i+1); //information gains matches the columns number

                        IGArr[i] = InformationGain(P_EntropyArr[A],EntropyArr,ClassNumbers,rows);

                        max_gain = ArrayMaximum(IGArr);
The output will be
QR      0       13:47:20.571    TestScript (EURUSD,H1)  Parent Noce will be Outlook with IG = 0.24675
IK      0       13:47:20.574    TestScript (EURUSD,H1)  Parent Entropy Array and Class Numbers
NL      0       13:47:20.574    TestScript (EURUSD,H1)  "Sunny"    "Overcast" "Rain"
NH      0       13:47:20.574    TestScript (EURUSD,H1)  0.9710 0.0000 0.9710
FR      0       13:47:20.574    TestScript (EURUSD,H1)  5 4 5
More explanations on the Tree we have drawn to this point.
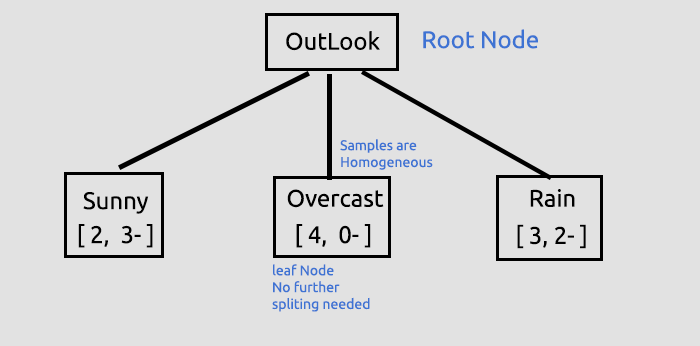
This was the first yet, crucial step where we were finding the root node and splitting that root node into branches and leaves, we are going to continue to split the data until there is nothing to split, here we are going to continue the process by splitting the branch with Sunny items and the branch with Rain items.
Overcast consists homogenous items (it is pure) so we say that it has been completely classified, when it comes to decision tree we call it a leaf. It won't generate branches.
But before we go further into splitting the data more there are crucial steps we need to do with the current dataset we have.
CLASSIFYING THE REMAINING DATASET MATRIX
We have to classify the remaining dataset matrix to put the rows with the same values in ascending orders, this will be helpful creating branches and leaves with the homogeneous contents (something we are eager to achieve).
void CDecisionTree::MatrixClassify(string &dataArr[],string &Classes[], int cols)
 {
   string ClassifiedArr[];
   ArrayResize(ClassifiedArr,ArraySize(dataArr));

   int fill_start = 0, fill_ends = 0;
   int index = 0;
   for (int i = 0; i<ArraySize(Classes); i++)
     {
      int start = 0;  int curr_col = 0;
      for (int j = 0; j<ArraySize(dataArr); j++)
        {
          curr_col++;

            if (Classes[i] == dataArr[j])
              {
                //printf("Classes[%d] = %s dataArr[%d] = %s ",i,Classes[i],j,dataArr[j]);

                 if (curr_col == 1)
                     fill_start =  j;
                 else
                   {
                      if (j>curr_col)
                        fill_start = j - (curr_col-1);
                      else fill_start = (curr_col-1) - j;

                      fill_start  = fill_start;
                      //Print("j ",j," j-currcol ",j-(curr_col-1)," curr_col ",curr_col," columns ",cols," fill start ",fill_start );

                   }

                 fill_ends = fill_start + cols;

                 //printf("fillstart %d fillends %d j index = %d i = %d ",fill_start,fill_ends,j,i);
//---
                  //if (ArraySize(ClassifiedArr) >= ArraySize(dataArr)) break;
                  //Print("ArraySize Classified Arr ",ArraySize(ClassifiedArr)," dataArr size ",ArraySize(dataArr)," i ",i);


                  for (int k=fill_start; k<fill_ends; k++)
                    {
                      index++;
                      //printf(" k %d index %d",k,index);
                      //printf("dataArr[%d] = %s index = %d",k,dataArr[k],index-1);
                      ClassifiedArr[index-1] = dataArr[k];
                    }

                if (index >= ArraySize(dataArr)) break; //might be infinite loop if this occurs
              }

          if (curr_col == cols) curr_col = 0;
        }

      if (index >= ArraySize(dataArr)) break; //might be infinite loop if this occurs
     }

    ArrayCopy(dataArr,ClassifiedArr);
    ArrayFree(ClassifiedArr);
 }
Why are there too many code commented out? Our library still needs improvements and the comments are for the sake of debugging, hopefully you'll play with them.
When we call this function and print the output we will get
JG      0       13:47:20.574    TestScript (EURUSD,H1)  Classified matrix dataset
KL      0       13:47:20.574    TestScript (EURUSD,H1)  "Outlook"     "Temp"        "Humidity"    "Wind"        "PlayTennis "
GS      0       13:47:20.574    TestScript (EURUSD,H1)  [
QF      0       13:47:20.574    TestScript (EURUSD,H1)  "Sunny" "Hot"   "High"  "Weak"  "No"
DN      0       13:47:20.574    TestScript (EURUSD,H1)  "Sunny"  "Hot"    "High"   "Strong" "No"
JF      0       13:47:20.574    TestScript (EURUSD,H1)  "Sunny" "Mild"  "High"  "Weak"  "No"
ND      0       13:47:20.574    TestScript (EURUSD,H1)  "Sunny"  "Cool"   "Normal" "Weak"   "Yes"
PN      0       13:47:20.574    TestScript (EURUSD,H1)  "Sunny"  "Mild"   "Normal" "Strong" "Yes"
EH      0       13:47:20.574    TestScript (EURUSD,H1)  "Overcast" "Hot"      "High"     "Weak"     "Yes"
MH      0       13:47:20.574    TestScript (EURUSD,H1)  "Overcast" "Cool"     "Normal"   "Strong"   "Yes"
MN      0       13:47:20.574    TestScript (EURUSD,H1)  "Overcast" "Mild"     "High"     "Strong"   "Yes"
DN      0       13:47:20.574    TestScript (EURUSD,H1)  "Overcast" "Hot"      "Normal"   "Weak"     "Yes"
MG      0       13:47:20.574    TestScript (EURUSD,H1)  "Rain" "Mild" "High" "Weak" "Yes"
QO      0       13:47:20.574    TestScript (EURUSD,H1)  "Rain"   "Cool"   "Normal" "Weak"   "Yes"
LN      0       13:47:20.574    TestScript (EURUSD,H1)  "Rain"   "Cool"   "Normal" "Strong" "No"
LE      0       13:47:20.574    TestScript (EURUSD,H1)  "Rain"   "Mild"   "Normal" "Weak"   "Yes"
FE      0       13:47:20.574    TestScript (EURUSD,H1)  "Rain"   "Mild"   "High"   "Strong" "No"
GS      0       13:47:20.574    TestScript (EURUSD,H1)  ]
DH      0       13:47:20.574    TestScript (EURUSD,H1)  columns = 5 rows = 70
B A M, The function works like magic
Okay, next crucial step is
REMOVING LEAF NODES FROM THE DATASET
Before the next iteration of all the process we have done to this point it is very important to remove leaf nodes since they are not going to make any branches, makes sense right? by the way they are a node of pure values.
We remove all the rows that has the value of the Leaf Node. In this case we remove all the rows with Overcast.
    //--- Search if there is zero entropy in the Array

            int zero_entropy_index = 0;
            bool zero_entropy = false;
            for (int e=0; e<ArraySize(P_EntropyArr); e++)
              if (P_EntropyArr[e] == 0) { zero_entropy = true; zero_entropy_index=e; break; }

            if (zero_entropy) //if there is zero in the Entropy Array
              {
                MatrixRemoveRow(m_dataset,p_Classes[zero_entropy_index],cols);

                rows_total = ArraySize(m_dataset); //New number of total rows from Array
                 if (m_debug)
                  {
                    printf("%s is A LEAF NODE its Rows have been removed from the dataset remaining Dataset is ..",p_Classes[zero_entropy_index]);
                    ArrayPrint(DataColumnNames);
                    MatrixPrint(m_dataset,cols,rows_total);
                  }

                //we also remove the entropy from the Array and its information everywhere else from the parent Node That we are going to build next

                ArrayRemove(P_EntropyArr,zero_entropy_index,1);
                ArrayRemove(p_Classes,zero_entropy_index,1);
                ArrayRemove(p_ClassNumbers,zero_entropy_index,1);
              }

            if (m_debug)
             Print("rows total ",rows_total," ",p_Classes[zero_entropy_index]," ",p_ClassNumbers[zero_entropy_index]);
The output after running this block of code will be
NQ      0       13:47:20.574    TestScript (EURUSD,H1)  Overcast is A LEAF NODE its Rows have been removed from the dataset remaining Dataset is ..
GP      0       13:47:20.574    TestScript (EURUSD,H1)  "Outlook"     "Temp"        "Humidity"    "Wind"        "PlayTennis "
KG      0       13:47:20.574    TestScript (EURUSD,H1)  [
FS      0       13:47:20.575    TestScript (EURUSD,H1)  "Sunny" "Hot"   "High"  "Weak"  "No"
GK      0       13:47:20.575    TestScript (EURUSD,H1)  "Sunny"  "Hot"    "High"   "Strong" "No"
EI      0       13:47:20.575    TestScript (EURUSD,H1)  "Sunny" "Mild"  "High"  "Weak"  "No"
IP      0       13:47:20.575    TestScript (EURUSD,H1)  "Sunny"  "Cool"   "Normal" "Weak"   "Yes"
KK      0       13:47:20.575    TestScript (EURUSD,H1)  "Sunny"  "Mild"   "Normal" "Strong" "Yes"
JK      0       13:47:20.575    TestScript (EURUSD,H1)  "Rain" "Mild" "High" "Weak" "Yes"
FL      0       13:47:20.575    TestScript (EURUSD,H1)  "Rain"   "Cool"   "Normal" "Weak"   "Yes"
GK      0       13:47:20.575    TestScript (EURUSD,H1)  "Rain"   "Cool"   "Normal" "Strong" "No"
OI      0       13:47:20.575    TestScript (EURUSD,H1)  "Rain"   "Mild"   "Normal" "Weak"   "Yes"
IQ      0       13:47:20.575    TestScript (EURUSD,H1)  "Rain"   "Mild"   "High"   "Strong" "No"
LG      0       13:47:20.575    TestScript (EURUSD,H1)  ]
IL      0       13:47:20.575    TestScript (EURUSD,H1)  columns = 5 rows = 50
HE      0       13:47:20.575    TestScript (EURUSD,H1)  rows total 50 Rain 5
B A M
The last but not least crucial process at this point is:
REMOVING THE PARENT OR THE ROOT NODE COLUMN FROM THE DATASET
Since we have already detected it as the root node and we have drawn it to our tree, we no longer need it to our dataset, our dataset has to remain with unclassified values
//---    REMOVING THE PARENT/ ROOT NODE FROM OUR DATASET

            MatrixRemoveColumn(m_dataset,max_gain,cols);

         // After removing the columns assign the new values to these global variables

            cols = cols-1;   // remove that one column that has been removed
            rows_total = rows_total - single_rowstotal; //remove the size of one column rows

         // we also remove the column from column names Array
            ArrayRemove(DataColumnNames,max_gain,1);

//---

            printf("Column %d removed from the Matrix, The remaining dataset is",max_gain+1);
            ArrayPrint(DataColumnNames);
            MatrixPrint(m_dataset,cols,rows_total);
The output of this block of code will be
OM      0       13:47:20.575    TestScript (EURUSD,H1)  Column 1 removed from the Matrix, The remaining dataset is
ON      0       13:47:20.575    TestScript (EURUSD,H1)  "Temp"        "Humidity"    "Wind"        "PlayTennis "
HF      0       13:47:20.575    TestScript (EURUSD,H1)  [
CR      0       13:47:20.575    TestScript (EURUSD,H1)  "Hot"  "High" "Weak" "No"
JE      0       13:47:20.575    TestScript (EURUSD,H1)  "Hot"    "High"   "Strong" "No"
JR      0       13:47:20.575    TestScript (EURUSD,H1)  "Mild" "High" "Weak" "No"
NG      0       13:47:20.575    TestScript (EURUSD,H1)  "Cool"   "Normal" "Weak"   "Yes"
JI      0       13:47:20.575    TestScript (EURUSD,H1)  "Mild"   "Normal" "Strong" "Yes"
PR      0       13:47:20.575    TestScript (EURUSD,H1)  "Mild" "High" "Weak" "Yes"
JJ      0       13:47:20.575    TestScript (EURUSD,H1)  "Cool"   "Normal" "Weak"   "Yes"
QQ      0       13:47:20.575    TestScript (EURUSD,H1)  "Cool"   "Normal" "Strong" "No"
OG      0       13:47:20.575    TestScript (EURUSD,H1)  "Mild"   "Normal" "Weak"   "Yes"
KD      0       13:47:20.575    TestScript (EURUSD,H1)  "Mild"   "High"   "Strong" "No"
DR      0       13:47:20.575    TestScript (EURUSD,H1)  ]
B A M
Now the reason we were being able to confidently leave some parts of the dataset is because the library is drawing a tree that leaves clues as to where the dataset goes into, here is a tree we have draws to this point.

Looks ugly, but it is good enough for demonstration purposes we'll try creating it with HTML in the next Article series, help me achieve so in my GitHub repository for this Linked below, Right now let me finish by describing the remaining process in building a tree, The logs after we iterate this process until there is nothing to split are as follows
HI      0       13:47:20.575    TestScript (EURUSD,H1)  Final Parent Entropy Array and Class Numbers
RK      0       13:47:20.575    TestScript (EURUSD,H1)  "Sunny" "Rain"
CL      0       13:47:20.575    TestScript (EURUSD,H1)  0.9710 0.9710
CE      0       13:47:20.575    TestScript (EURUSD,H1)  5 5
EH      0       13:47:20.575    TestScript (EURUSD,H1)  <<<<<<<<    Parent Entropy  0.97095  A = 1  >>>>>>>>
OF      0       13:47:20.575    TestScript (EURUSD,H1)     <<<<<   C O L U M N  Temp   >>>>>
RP      0       13:47:20.575    TestScript (EURUSD,H1)       <<   Hot   >> total > 2
MD      0       13:47:20.575    TestScript (EURUSD,H1)  "No"  "Yes"
MQ      0       13:47:20.575    TestScript (EURUSD,H1)  2 0
QE      0       13:47:20.575    TestScript (EURUSD,H1)  Entropy of Hot = 0.00000
FQ      0       13:47:20.575    TestScript (EURUSD,H1)       <<   Mild   >> total > 5
KJ      0       13:47:20.575    TestScript (EURUSD,H1)  "No"  "Yes"
NO      0       13:47:20.575    TestScript (EURUSD,H1)  2 3
DH      0       13:47:20.575    TestScript (EURUSD,H1)  Entropy of Mild = 0.97095
IS      0       13:47:20.575    TestScript (EURUSD,H1)       <<   Cool   >> total > 3
KH      0       13:47:20.575    TestScript (EURUSD,H1)  "No"  "Yes"
LM      0       13:47:20.575    TestScript (EURUSD,H1)  1 2
FN      0       13:47:20.575    TestScript (EURUSD,H1)  Entropy of Cool = 0.91830
KD      0       13:47:20.575    TestScript (EURUSD,H1)  <<<<<<  Column Information Gain 0.20999 >>>>>>
EF      0       13:47:20.575    TestScript (EURUSD,H1)
DJ      0       13:47:20.575    TestScript (EURUSD,H1)     <<<<<   C O L U M N  Humidity   >>>>>
HJ      0       13:47:20.575    TestScript (EURUSD,H1)       <<   High   >> total > 5
OS      0       13:47:20.575    TestScript (EURUSD,H1)  "No"  "Yes"
FD      0       13:47:20.575    TestScript (EURUSD,H1)  4 1
NG      0       13:47:20.575    TestScript (EURUSD,H1)  Entropy of High = 0.72193
KM      0       13:47:20.575    TestScript (EURUSD,H1)       <<   Normal   >> total > 5
CP      0       13:47:20.575    TestScript (EURUSD,H1)  "No"  "Yes"
JR      0       13:47:20.575    TestScript (EURUSD,H1)  1 4
MD      0       13:47:20.575    TestScript (EURUSD,H1)  Entropy of Normal = 0.72193
EL      0       13:47:20.575    TestScript (EURUSD,H1)  <<<<<<  Column Information Gain 0.24902 >>>>>>
IN      0       13:47:20.575    TestScript (EURUSD,H1)
CS      0       13:47:20.575    TestScript (EURUSD,H1)     <<<<<   C O L U M N  Wind   >>>>>
OS      0       13:47:20.575    TestScript (EURUSD,H1)       <<   Weak   >> total > 6
CK      0       13:47:20.575    TestScript (EURUSD,H1)  "No"  "Yes"
GM      0       13:47:20.575    TestScript (EURUSD,H1)  2 4
OO      0       13:47:20.575    TestScript (EURUSD,H1)  Entropy of Weak = 0.91830
HE      0       13:47:20.575    TestScript (EURUSD,H1)       <<   Strong   >> total > 4
GI      0       13:47:20.575    TestScript (EURUSD,H1)  "No"  "Yes"
OJ      0       13:47:20.575    TestScript (EURUSD,H1)  3 1
EM      0       13:47:20.575    TestScript (EURUSD,H1)  Entropy of Strong = 0.81128
PG      0       13:47:20.575    TestScript (EURUSD,H1)  <<<<<<  Column Information Gain 0.09546 >>>>>>
EG      0       13:47:20.575    TestScript (EURUSD,H1)
HK      0       13:47:20.575    TestScript (EURUSD,H1)  Parent Noce will be Humidity with IG = 0.24902
OI      0       13:47:20.578    TestScript (EURUSD,H1)  Parent Entropy Array and Class Numbers
JO      0       13:47:20.578    TestScript (EURUSD,H1)  "High"   "Normal" "Cool"
QJ      0       13:47:20.578    TestScript (EURUSD,H1)  0.7219 0.7219 0.9183
QO      0       13:47:20.578    TestScript (EURUSD,H1)  5 5 3
PJ      0       13:47:20.578    TestScript (EURUSD,H1)  Classified matrix dataset
NM      0       13:47:20.578    TestScript (EURUSD,H1)  "Temp"        "Humidity"    "Wind"        "PlayTennis "
EF      0       13:47:20.578    TestScript (EURUSD,H1)  [
FM      0       13:47:20.578    TestScript (EURUSD,H1)  "Hot"  "High" "Weak" "No"
OD      0       13:47:20.578    TestScript (EURUSD,H1)  "Hot"    "High"   "Strong" "No"
GR      0       13:47:20.578    TestScript (EURUSD,H1)  "Mild" "High" "Weak" "No"
QG      0       13:47:20.578    TestScript (EURUSD,H1)  "Mild" "High" "Weak" "Yes"
JD      0       13:47:20.578    TestScript (EURUSD,H1)  "Mild"   "High"   "Strong" "No"
KS      0       13:47:20.578    TestScript (EURUSD,H1)  "Cool"   "Normal" "Weak"   "Yes"
OJ      0       13:47:20.578    TestScript (EURUSD,H1)  "Mild"   "Normal" "Strong" "Yes"
CL      0       13:47:20.578    TestScript (EURUSD,H1)  "Cool"   "Normal" "Weak"   "Yes"
LJ      0       13:47:20.578    TestScript (EURUSD,H1)  "Cool"   "Normal" "Strong" "No"
NH      0       13:47:20.578    TestScript (EURUSD,H1)  "Mild"   "Normal" "Weak"   "Yes"
ER      0       13:47:20.578    TestScript (EURUSD,H1)  ]
LI      0       13:47:20.578    TestScript (EURUSD,H1)  columns = 4 rows = 40
CQ      0       13:47:20.578    TestScript (EURUSD,H1)  rows total 36 High 5
GH      0       13:47:20.578    TestScript (EURUSD,H1)  Column 2 removed from the Matrix, The remaining dataset is
MP      0       13:47:20.578    TestScript (EURUSD,H1)  "Temp"        "Wind"        "PlayTennis "
QG      0       13:47:20.578    TestScript (EURUSD,H1)  [
LL      0       13:47:20.578    TestScript (EURUSD,H1)  "Hot"  "Weak" "No"
OE      0       13:47:20.578    TestScript (EURUSD,H1)  "Hot"    "Strong" "No"
QQ      0       13:47:20.578    TestScript (EURUSD,H1)  "Mild" "Weak" "No"
QE      0       13:47:20.578    TestScript (EURUSD,H1)  "Mild" "Weak" "Yes"
LQ      0       13:47:20.578    TestScript (EURUSD,H1)  "Mild"   "Strong" "No"
HE      0       13:47:20.578    TestScript (EURUSD,H1)  "Cool" "Weak" "Yes"
RM      0       13:47:20.578    TestScript (EURUSD,H1)  "Mild"   "Strong" "Yes"
PF      0       13:47:20.578    TestScript (EURUSD,H1)  "Cool" "Weak" "Yes"
MR      0       13:47:20.578    TestScript (EURUSD,H1)  "Cool"   "Strong" "No"
IF      0       13:47:20.578    TestScript (EURUSD,H1)  "Mild" "Weak" "Yes"
EN      0       13:47:20.578    TestScript (EURUSD,H1)  ]
ME      0       13:47:20.578    TestScript (EURUSD,H1)  columns = 3 rows = 22
ER      0       13:47:20.578    TestScript (EURUSD,H1)  Final Parent Entropy Array and Class Numbers
HK      0       13:47:20.578    TestScript (EURUSD,H1)  "High"   "Normal" "Cool"
CQ      0       13:47:20.578    TestScript (EURUSD,H1)  0.7219 0.7219 0.9183
OK      0       13:47:20.578    TestScript (EURUSD,H1)  5 5 3
NS      0       13:47:20.578    TestScript (EURUSD,H1)  <<<<<<<<    Parent Entropy  0.91830  A = 2  >>>>>>>>
JM      0       13:47:20.578    TestScript (EURUSD,H1)     <<<<<   C O L U M N  Temp   >>>>>
CG      0       13:47:20.578    TestScript (EURUSD,H1)       <<   Hot   >> total > 2
DM      0       13:47:20.578    TestScript (EURUSD,H1)  "No"  "Yes"
LF      0       13:47:20.578    TestScript (EURUSD,H1)  2 0
HN      0       13:47:20.578    TestScript (EURUSD,H1)  Entropy of Hot = 0.00000
OJ      0       13:47:20.578    TestScript (EURUSD,H1)       <<   Mild   >> total > 5
JS      0       13:47:20.578    TestScript (EURUSD,H1)  "No"  "Yes"
GD      0       13:47:20.578    TestScript (EURUSD,H1)  2 3
QG      0       13:47:20.578    TestScript (EURUSD,H1)  Entropy of Mild = 0.97095
LL      0       13:47:20.578    TestScript (EURUSD,H1)       <<   Cool   >> total > 3
JQ      0       13:47:20.578    TestScript (EURUSD,H1)  "No"  "Yes"
IR      0       13:47:20.578    TestScript (EURUSD,H1)  1 2
OE      0       13:47:20.578    TestScript (EURUSD,H1)  Entropy of Cool = 0.91830
RO      0       13:47:20.578    TestScript (EURUSD,H1)  <<<<<<  Column Information Gain 0.15733 >>>>>>
PO      0       13:47:20.578    TestScript (EURUSD,H1)
JS      0       13:47:20.578    TestScript (EURUSD,H1)     <<<<<   C O L U M N  Wind   >>>>>
JR      0       13:47:20.578    TestScript (EURUSD,H1)       <<   Weak   >> total > 6
NH      0       13:47:20.578    TestScript (EURUSD,H1)  "No"  "Yes"
JM      0       13:47:20.578    TestScript (EURUSD,H1)  2 4
JL      0       13:47:20.578    TestScript (EURUSD,H1)  Entropy of Weak = 0.91830
QD      0       13:47:20.578    TestScript (EURUSD,H1)       <<   Strong   >> total > 4
JN      0       13:47:20.578    TestScript (EURUSD,H1)  "No"  "Yes"
JK      0       13:47:20.578    TestScript (EURUSD,H1)  3 1
DM      0       13:47:20.578    TestScript (EURUSD,H1)  Entropy of Strong = 0.81128
JF      0       13:47:20.578    TestScript (EURUSD,H1)  <<<<<<  Column Information Gain 0.04281 >>>>>>
DG      0       13:47:20.578    TestScript (EURUSD,H1)
LI      0       13:47:20.578    TestScript (EURUSD,H1)  Parent Noce will be Temp with IG = 0.15733
LH      0       13:47:20.584    TestScript (EURUSD,H1)  Parent Entropy Array and Class Numbers
GR      0       13:47:20.584    TestScript (EURUSD,H1)  "Hot"  "Mild" "Cool"
CD      0       13:47:20.584    TestScript (EURUSD,H1)  0.0000 0.9710 0.9183
GN      0       13:47:20.584    TestScript (EURUSD,H1)  2 5 3
CK      0       13:47:20.584    TestScript (EURUSD,H1)  Classified matrix dataset
RL      0       13:47:20.584    TestScript (EURUSD,H1)  "Temp"        "Wind"        "PlayTennis "
NK      0       13:47:20.584    TestScript (EURUSD,H1)  [
CQ      0       13:47:20.584    TestScript (EURUSD,H1)  "Hot"  "Weak" "No"
LI      0       13:47:20.584    TestScript (EURUSD,H1)  "Hot"    "Strong" "No"
JM      0       13:47:20.584    TestScript (EURUSD,H1)  "Mild" "Weak" "No"
NI      0       13:47:20.584    TestScript (EURUSD,H1)  "Mild" "Weak" "Yes"
CL      0       13:47:20.584    TestScript (EURUSD,H1)  "Mild"   "Strong" "No"
KI      0       13:47:20.584    TestScript (EURUSD,H1)  "Mild"   "Strong" "Yes"
LR      0       13:47:20.584    TestScript (EURUSD,H1)  "Mild" "Weak" "Yes"
KJ      0       13:47:20.584    TestScript (EURUSD,H1)  "Cool" "Weak" "Yes"
IQ      0       13:47:20.584    TestScript (EURUSD,H1)  "Cool" "Weak" "Yes"
DE      0       13:47:20.584    TestScript (EURUSD,H1)  "Cool"   "Strong" "No"
NR      0       13:47:20.584    TestScript (EURUSD,H1)  ]
OI      0       13:47:20.584    TestScript (EURUSD,H1)  columns = 3 rows = 30
OO      0       13:47:20.584    TestScript (EURUSD,H1)  Hot is A LEAF NODE its Rows have been removed from the dataset remaining Dataset is ..
HL      0       13:47:20.584    TestScript (EURUSD,H1)  "Temp"        "Wind"        "PlayTennis "
DJ      0       13:47:20.584    TestScript (EURUSD,H1)  [
DL      0       13:47:20.584    TestScript (EURUSD,H1)  "Mild" "Weak" "No"
LH      0       13:47:20.584    TestScript (EURUSD,H1)  "Mild" "Weak" "Yes"
QL      0       13:47:20.584    TestScript (EURUSD,H1)  "Mild"   "Strong" "No"
MH      0       13:47:20.584    TestScript (EURUSD,H1)  "Mild"   "Strong" "Yes"
RQ      0       13:47:20.584    TestScript (EURUSD,H1)  "Mild" "Weak" "Yes"
MI      0       13:47:20.584    TestScript (EURUSD,H1)  "Cool" "Weak" "Yes"
KQ      0       13:47:20.584    TestScript (EURUSD,H1)  "Cool" "Weak" "Yes"
FD      0       13:47:20.584    TestScript (EURUSD,H1)  "Cool"   "Strong" "No"
HQ      0       13:47:20.584    TestScript (EURUSD,H1)  ]
NN      0       13:47:20.584    TestScript (EURUSD,H1)  columns = 3 rows = 24
IF      0       13:47:20.584    TestScript (EURUSD,H1)  rows total 24 Mild 5
CO      0       13:47:20.584    TestScript (EURUSD,H1)  Column 1 removed from the Matrix, The remaining dataset is
DM      0       13:47:20.584    TestScript (EURUSD,H1)  "Wind"        "PlayTennis "
PD      0       13:47:20.584    TestScript (EURUSD,H1)  [
LN      0       13:47:20.584    TestScript (EURUSD,H1)  "Weak" "No"
JI      0       13:47:20.584    TestScript (EURUSD,H1)  "Weak" "Yes"
EL      0       13:47:20.584    TestScript (EURUSD,H1)  "Strong" "No"
GO      0       13:47:20.584    TestScript (EURUSD,H1)  "Strong" "Yes"
JG      0       13:47:20.584    TestScript (EURUSD,H1)  "Weak" "Yes"
JN      0       13:47:20.584    TestScript (EURUSD,H1)  "Weak" "Yes"
JE      0       13:47:20.584    TestScript (EURUSD,H1)  "Weak" "Yes"
EP      0       13:47:20.584    TestScript (EURUSD,H1)  "Strong" "No"
HK      0       13:47:20.584    TestScript (EURUSD,H1)  ]
PP      0       13:47:20.584    TestScript (EURUSD,H1)  columns = 2 rows = 10
HG      0       13:47:20.584    TestScript (EURUSD,H1)  Final Parent Entropy Array and Class Numbers
FQ      0       13:47:20.584    TestScript (EURUSD,H1)  "Mild" "Cool"
OF      0       13:47:20.584    TestScript (EURUSD,H1)  0.9710 0.9183
IO      0       13:47:20.584    TestScript (EURUSD,H1)  5 3
HERE IS AN OVERVIEW OF THE BUILD TREE function, I found this piece of code hard and confusing to read that despite the process seeming easy when calculating the values manually, so I decided to explain it in details on this section.
void CDecisionTree::BuildTree(void)
 {
    int ClassNumbers[];

    int max_gain = 0;
    double IGArr[];
    //double parent_entropy = Entropy(p_ClassNumbers,single_rowstotal);

    string p_Classes[];     //parent classes
    double P_EntropyArr[];  //Parent Entropy
    int p_ClassNumbers[]; //parent/ Target variable class numbers

    GetClasses(TargetArr,m_DatasetClasses,p_ClassNumbers);

    ArrayResize(P_EntropyArr,1);
    P_EntropyArr[0] = Entropy(p_ClassNumbers,single_rowstotal);

//--- temporary disposable arrays for parent node information

   string TempP_Classes[];
   double TempP_EntropyArr[];
   int    TempP_ClassNumbers[];

//---

    if (m_debug) Print("Default Parent Entropy ",P_EntropyArr[0]);

    int cols = m_colschosen;


      for (int A =0; A<ArraySize(P_EntropyArr); A++)
        {
           printf("<<<<<<<<    Parent Entropy  %.5f  A = %d  >>>>>>>> ",P_EntropyArr[A],A);


             for (int i=0; i<cols-1; i++) //we substract with one to remove the independent variable coumn
               {
                  int rows = ArraySize(m_dataset)/cols;

                    string Arr[]; //ArrayFor the current column
                    string ArrTarg[]; //Array for the current target

                    ArrayResize(Arr,rows);
                    ArrayResize(ArrTarg,rows);

                       printf("   <<<<<   C O L U M N  %s   >>>>>  ",DataColumnNames[i]);
                       int index_target=cols-1;
                       for (int j=0; j<rows; j++) //get column data and its target column
                          {
                              int index = i+j * cols;
                              //Print("index ",index);
                              Arr[j] = m_dataset[index];

                              //printf("ArrTarg[%d] = %s m_dataset[%d] =%s ",j,ArrTarg[j],index_target,m_dataset[index_target]);
                              ArrTarg[j] = m_dataset[index_target];

                              //printf("Arr[%d] = %s ArrTarg[%d] = %s ",j,Arr[j],j,ArrTarg[j]);

                              index_target += cols; //the last index of all the columns
                          }

         //--- Finding the Entropy

                     //The function to find the Entropy of samples in a given column inside its loop
                        //then restores all the entropy into one array


         //--- Finding the Information Gain

                        //The Function to find the information gain from the entropy array above

         //---

                        if (i == max_gain)
                         {
                          //Get the maximum information gain of all the information gain in all columns then
                        //store it to the parent information gain
                         }

         //---

                  ZeroMemory(ClassNumbers);
                  ZeroMemory(SamplesNumbers);

               }

         //---- Get the parent Entropy, class and class numbers
               // here we store the obtained parent class from the information gain metric then we store them into a parent array
                  ArrayCopy(p_Classes,TempP_Classes);
                  ArrayCopy(P_EntropyArr,TempP_EntropyArr);
                  ArrayCopy(p_ClassNumbers,TempP_ClassNumbers);

         //---

            string Node[1];
            Node[0] = DataColumnNames[max_gain];

            if (m_debug)
            printf("Parent Node will be %s with IG = %.5f",Node[0],IGArr[max_gain]);

            if (A == 0)
             DrawTree(Node,"parent",A);

             DrawTree(p_Classes,"child",A);


         //---  CLASSIFY THE MATRIX
         MatrixClassify(m_dataset,p_Classes,cols);


         //--- Search if there is zero entropy in Array if there is any remove its data from the dataset


            if (P_EntropyArr[e] == 0) { zero_entropy = true; zero_entropy_index=e; break; }

            if (zero_entropy) //if there is zero in the Entropy Array
              {
                MatrixRemoveRow(m_dataset,p_Classes[zero_entropy_index],cols);

                rows_total = ArraySize(m_dataset); //New number of total rows from Array


                //we also remove the entropy from the Array and its information everywhere else from the parent Node That we are going to build next

                ArrayRemove(P_EntropyArr,zero_entropy_index,1);
                ArrayRemove(p_Classes,zero_entropy_index,1);
                ArrayRemove(p_ClassNumbers,zero_entropy_index,1);
              }

            if (m_debug)
             Print("rows total ",rows_total," ",p_Classes[zero_entropy_index]," ",p_ClassNumbers[zero_entropy_index]);

//---    REMOVING THE PARENT/ ROOT NODE FROM OUR DATASET

            MatrixRemoveColumn(m_dataset,max_gain,cols);

         // After removing the columns assing the new values to these global variables

            cols = cols-1;   // remove that one column that has been removed
            rows_total = rows_total - single_rowstotal; //remove the size of one column rows

         // we also remove the column from column names Array
            ArrayRemove(DataColumnNames,max_gain,1);


//---


      }


 }
The Bottom Line
You now understand the basic calculations involved in classification trees, this is a tough and long topic to cover in one article, hopefully I will complete it in the next Article or two, though the library has almost anything you need to start building decision tree algorithms to help you solve the trading problems that you care about.
Thanks for reading, My GitHub repository linked here https://github.com/MegaJoctan/DecisionTree-Classification-tree-MQL5.
 Developing a trading Expert Advisor from scratch (Part 10): Accessing custom indicators
 Developing a trading Expert Advisor from scratch (Part 9): A conceptual leap (II)
 Learn how to design a trading system by Ichimoku
- Free trading apps
- Over 8,000 signals for copying
- Economic news for exploring financial markets
You agree to website policy and terms of use
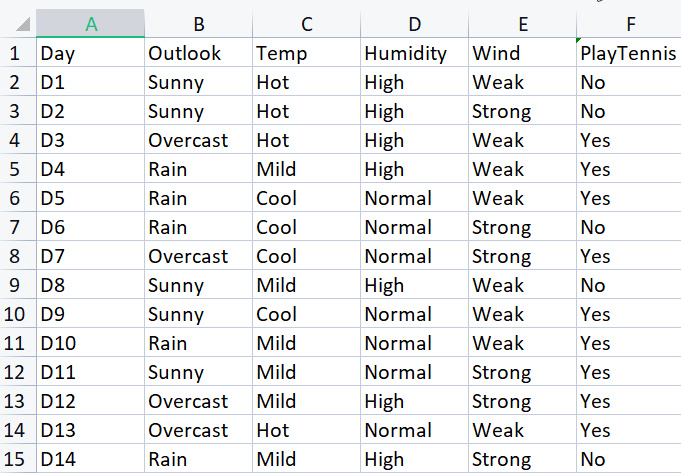
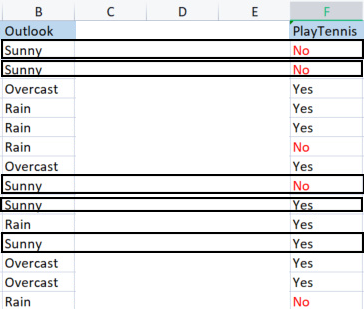
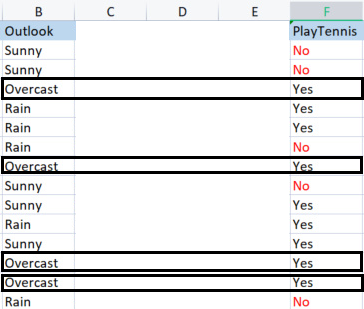
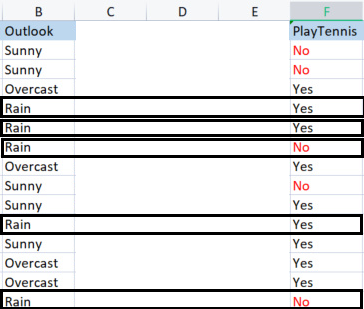
Hello Mr. Omega,
Thank you so much for the ID3 solution. it is very useful for me. However I provided and attached an excel sheet in this regards, that I think it's clear for your explains.
Many Thanks again,
F.Mahmoudian
Hello Mr. Omega,
Thank you so much for the ID3 solution. it is very useful for me. However I provided and attached an excel sheet in this regards, that I think it's clear for your explains.
Many Thanks again,
F.Mahmoudian
many thanks to it, I'm still trying to figure out how to let the script draw the tree itself
many thanks to it, I'm still trying to figure out how to let the script draw the tree itself
Thanks so much