
Creating an MQL5 Expert Advisor Based on the Daily Range Breakout Strategy
Introduction
In this article, we will explore how to create an Expert Advisor (EA) in MetaQuotes Language 5 (MQL5) based on the Daily Range Breakout strategy. As traders continuously seek effective automated trading solutions, the Daily Range Breakout strategy offers a systematic approach that capitalizes on price movements beyond a defined range, making it an attractive option for Forex traders in MetaTrader 5.
We will begin by outlining the fundamental principles of the Daily Range Breakout strategy, providing a solid foundation for its implementation in automated trading. Next, we will delve into the specifics of identifying breakout conditions and establishing entry and exit points. Following this, we will guide you through the coding process in MQL5, highlighting essential functions and logic that drive the strategy. Additionally, we will discuss the importance of backtesting and optimizing the program to ensure its effectiveness in trading conditions. The topics we'll cover in this article include:
- Understanding the Daily Range Breakout Strategy
- The Expert Advisor Blueprint
- Implementing the Daily Range Breakout in MQL5
- Backtesting and Optimization
- Conclusion
By the end of this article, you will be equipped with the knowledge to develop an MQL5 Expert Advisor that effectively utilizes the Daily Range Breakout strategy, enhancing your trading approach. Let's get started.
Understanding the Daily Range Breakout Strategy
The Daily Range Breakout strategy is a well-known trading method among Forex traders. It allows them to take advantage of vast price movements that happen after the market has formed a daily range. The strategy uses the market's price action to figure out where important support and resistance levels are. Once these traders know where these levels are, they trade breakouts of them, looking for the probable big moves that usually happen after the market breaks one of these levels.
This strategy centers on the daily range, which is established as the difference between the highest and lowest prices of a currency pair within a trading day. The breakout points are inferred from the range of the previous trading day. A breakout occurs when the price moves above an established resistance level or below a support level. In hindsight, the last day's prices seem to lay down very well-defined levels to use as potential breakout points. When the price breaks up through the resistance level, a long position is taken. When the price breaks down through the support level, a short position is taken. Here is an illustration of what we mean.
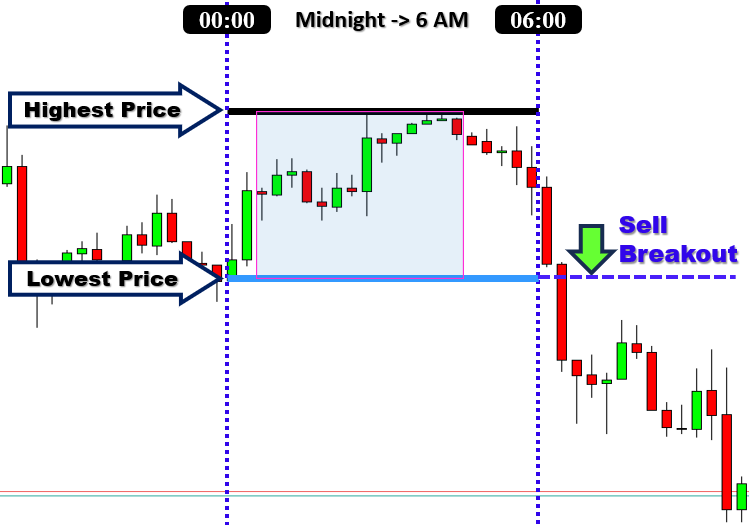
For maximum effectiveness, this strategy is employed on either the 1-hour or 4-hour chart. When traders use this template on these time frames, they can often capture the larger, more significant price moves. This is because the strategy is mostly clear of the noise present in the lower time frames. The breakout strategy commonly utilizes price action from the Asian session to determine the daily range, before executing trades during the London and New York sessions. Breakout strategies typically have the problem of giving false signals, and the Daily Range Breakout is no exception. So, as with any trading strategy, it is vital to manage risk when using the Daily Range Breakout. Place your stop-loss orders just below the last swing low for long positions and above the last swing high for short trades to keep your risk reasonable. This will be our strategy. It manages risk by using a stop-loss order placed above or below the last swing high or low, as the case may be. Here is an illustration again for the stop-loss logic.
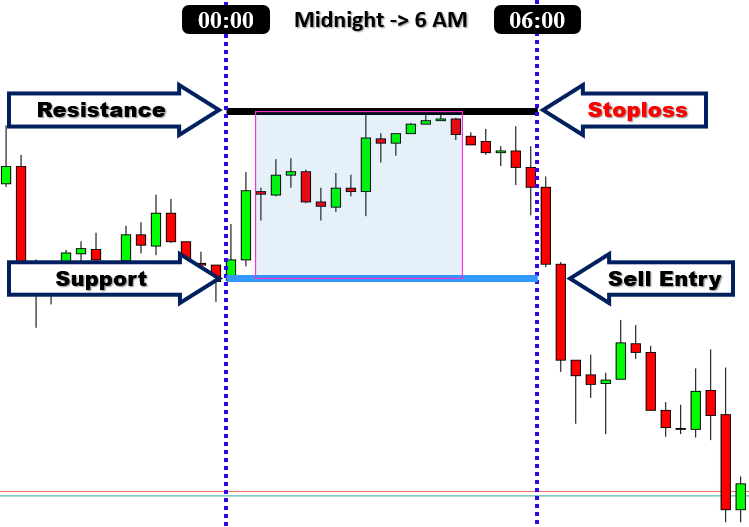
The Daily Range Breakout strategy is beneficial in several respects. First, its simplicity makes it a suitable choice for both beginner and experienced traders. Second, it utilizes defined levels, which keeps traders from making too many discretionary decisions. The way this method of trading breaks down the market makes for a clear picture before and after each daily session. In the morning, the market's trading activity can be delineated into a specific "range." Then, after the morning session has closed, "breaking" through either the upper or lower line of the range becomes a possible signal for entering a trade on the following day. We will further define our trading parameters in the next section by providing a clear blueprint with all the specific details.
The Expert Advisor Blueprint
Upper Range Breakout: Buy Condition
When the price breaks above the established upper range from the previous day, it signifies a bullish breakout and suggests that the market may continue to rise. This breakout indicates strong buying interest and the potential for further upward movement. We open a buy position when the current bar's closing price is above the upper range level, aiming to profit from the momentum that typically follows such breakouts.
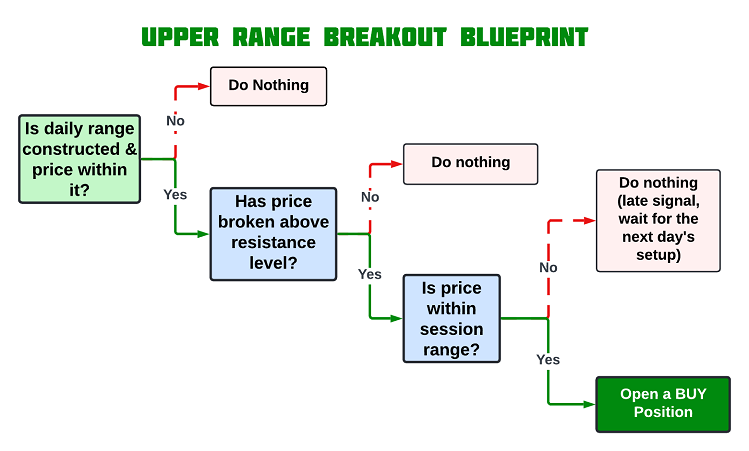
Lower Range Breakout: Sell Condition
Conversely, when the price breaks below the established lower range from the previous day, it signifies a bearish breakout and suggests that the market may continue to decline. This breakout indicates strong selling pressure and the potential for further downward movement. We open a sell position when the current bar's closing price is below the lower range level, anticipating continued price weakness following the breakout.
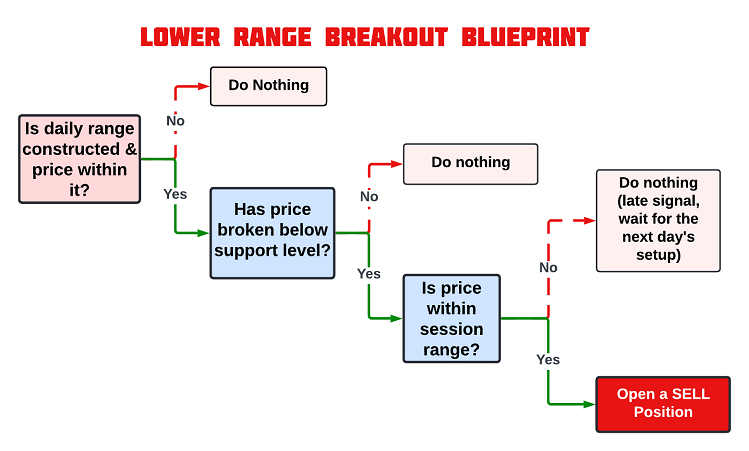
These visual representations of the strategy blueprint will be helpful when we are implementing these trading conditions in MQL5, serving as a reference for coding precise entry and exit rules.
Implementing the Daily Range Breakout in MQL5
After learning all the theories about the Daily Range Breakout trading strategy, let us then automate the theory and craft an Expert Advisor (EA) in MetaQuotes Language 5 (MQL5) for MetaTrader 5.
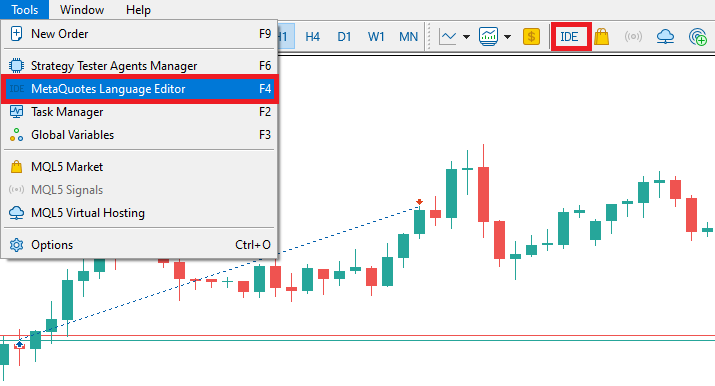
To create an expert advisor (EA), on your MetaTrader 5 terminal, click the Tools tab and check MetaQuotes Language Editor, or simply press F4 on your keyboard. Alternatively, you can click the IDE (Integrated Development Environment) icon on the tools bar. This will open the MetaQuotes Language Editor environment, which allows the writing of trading robots, technical indicators, scripts, and libraries of functions.
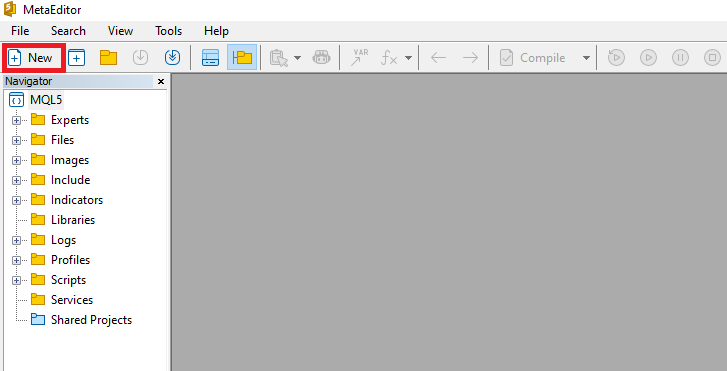
Once the MetaEditor is opened, on the tools bar, navigate to the File tab and check New File, or simply press CTRL + N, to create a new document. Alternatively, you can click on the New icon on the tools tab. This will result in a MQL Wizard pop-up.
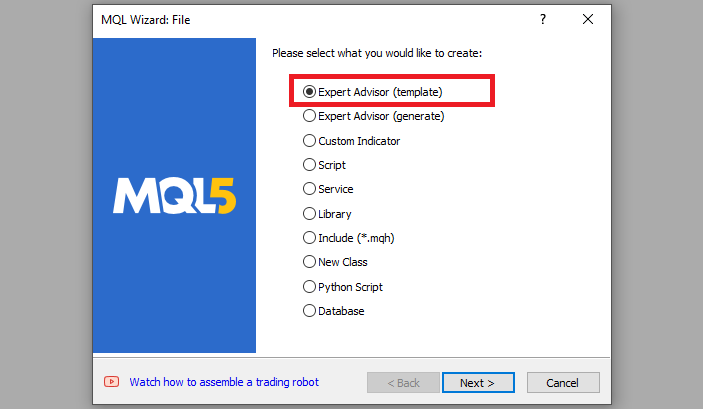
On the Wizard that pops, check Expert Advisor (template) and click Next.
On the general properties of the Expert Advisor, under the name section, provide your expert's file name. Note that to specify or create a folder if it doesn't exist, you use the backslash before the name of the EA. For example, here we have "Experts\" by default. That means that our EA will be created in the Experts folder and we can find it there. The other sections are pretty much straightforward, but you can follow the link at the bottom of the Wizard to know how to precisely undertake the process.
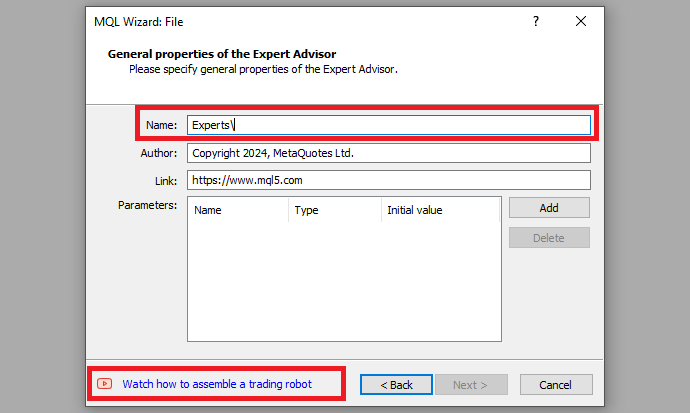
After providing your desired Expert Advisor file name, click on Next, click Next, and then click Finish. After doing all that, we are now ready to code and program our strategy.
First, we start by defining some metadata about the Expert Advisor (EA). This includes the name of the EA, the copyright information, and a link to the MetaQuotes website. We also specify the version of the EA, which is set to "1.00".
//+------------------------------------------------------------------+
//|                          Daily Range Breakout Expert Advisor.mq5 |
//|      Copyright 2024, ALLAN MUNENE MUTIIRIA. #@Forex Algo-Trader. |
//|                                     https://forexalg0-trader.com |
//+------------------------------------------------------------------+
#property copyright "Copyright 2024, ALLAN MUNENE MUTIIRIA. #@Forex Algo-Trader"
#property link      "https://forexalg0-trader.com"
#property description "Daily Range Breakout Expert Advisor"
#property version   "1.00"
When loading the program, information that depicts the one shown below is realized.
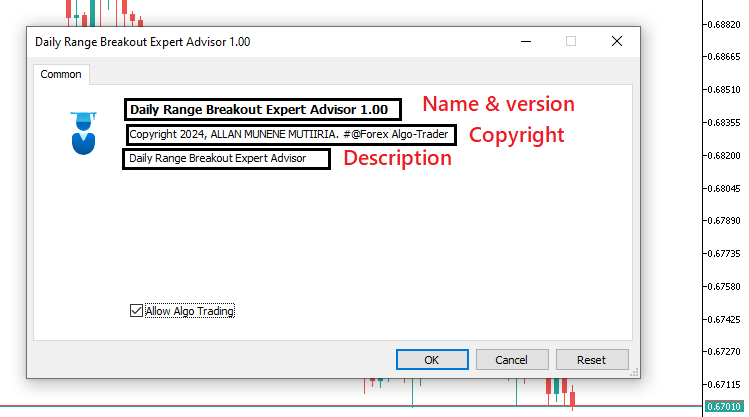
First, we include a trade instance by using #include at the beginning of the source code. This gives us access to the "CTrade class", which we will use to create a trade object. This is crucial as we need it to open trades.
#include <Trade/Trade.mqh>
CTrade obj_Trade;
The preprocessor will replace the line #include <Trade/Trade.mqh> with the content of the file Trade.mqh. Angle brackets indicate that the Trade.mqh file will be taken from the standard directory (usually it is terminal_installation_directory\MQL5\Include). The current directory is not included in the search. The line can be placed anywhere in the program, but usually, all inclusions are placed at the beginning of the source code, for a better code structure and easier reference. Declaration of the obj_Trade object of the CTrade class will give us access to the methods contained in that class easily, thanks to the MQL5 developers.
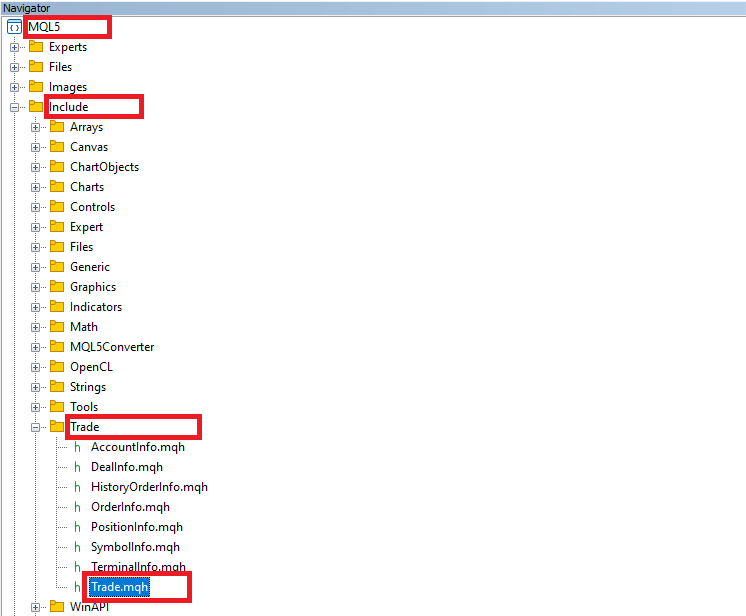
After that, we need to declare several important variables to store and track the range breakout data.
double maximum_price = -DBL_MAX;      //--- Initialize the maximum price with the smallest possible value
double minimum_price = DBL_MAX;       //--- Initialize the minimum price with the largest possible value
datetime maximum_time, minimum_time;  //--- Declare variables to store the time of the highest and lowest prices
bool isHaveDailyRange_Prices = false; //--- Boolean flag to check if daily range prices are extracted
bool isHaveRangeBreak = false;        //--- Boolean flag to check if a range breakout has occurred
Here, we declare several important variables to track key price data and handle range breakouts in the trading logic. First, we initialize two double variables, "maximum_price" and "minimum_price", which will store the highest and lowest prices found during a specific period. The "maximum_price" is set to -DBL_MAX, the smallest possible double value, ensuring that any price encountered will be higher and replace this initial value. Similarly, we set "minimum_price" to DBL_MAX, the largest possible double value, ensuring that any lower price will replace it as the minimum.
We also declare two datetime variables, "maximum_time" and "minimum_time", to store the exact times when the maximum and minimum prices occur. These will help us later if we need to reference the specific moments these price levels were reached.
Additionally, two bool variables are declared to handle the logic related to price ranges and breakouts. The first, "isHaveDailyRange_Prices", is initialized to false and serves as a flag to indicate whether the daily range prices (i.e., the maximum and minimum) have been successfully determined. The second, "isHaveRangeBreak", also initialized to false, acts as a flag to indicate whether a breakout has occurred, meaning the price has moved outside the daily range. Additionally, we will visually present the ranges in the chart. Thus, we will need names for the ranges and we can declare them here as well.
#define RECTANGLE_PREFIX "RANGE RECTANGLE " //--- Prefix for naming range rectangles
#define UPPER_LINE_PREFIX "UPPER LINE "     //--- Prefix for naming upper range line
#define LOWER_LINE_PREFIX "LOWER LINE "     //--- Prefix for naming lower range line
Here, we define three preprocessor directives that create prefixes for naming various graphical objects associated with a trading range. We use the directive #define RECTANGLE_PREFIX "RANGE RECTANGLE " to establish a consistent naming convention for rectangles representing the trading range, making it easier to identify and manage those objects within the chart. Similarly, #define UPPER_LINE_PREFIX "UPPER LINE " creates a prefix specifically for the upper boundary line of the range, while LOWER_LINE_PREFIX "LOWER LINE " serves the same purpose for the lower boundary line. By using these prefixes, we ensure that all graphical objects related to the range are systematically named, which aids in maintaining clarity and organization in the code, especially when multiple objects may be present on the chart.
From that, we can now graduate to the actual code-processing logic. We will execute our logic on tick processes and thus we will dive directly into the OnTick event handler, which is called and executed on every tick that is processed on the chart.
//+------------------------------------------------------------------+
//| Expert tick function                                             |
//+------------------------------------------------------------------+
void OnTick(){
//---

}
This is simply the default tick event handler that we will use to base our control logic. Next, we need to declare some variables to hold our time range logic.
   static datetime midnight = iTime(_Symbol,PERIOD_D1,0);  //--- Get the time of midnight (start of the day) for daily chart
   static datetime sixAM = midnight + 6 * 3600;            //--- Calculate 6 AM based on midnight time
   static datetime scanBarTime = sixAM + 1 * PeriodSeconds(_Period); //--- Set scan time for the next bar after 6 AM
We declare three static variables to manage the time-related functions. The first variable, "midnight", is assigned the value returned by the iTime function, which retrieves the time of midnight for the daily chart of the current symbol, denoted by _Symbol and the period set to PERIOD_D1, to indicate that we want to deal with daily candlesticks. 0 denotes the current bar. This establishes a baseline reference point for daily calculations.
Next, we calculate the time for "sixAM" by adding six hours, represented as 6 * 3600, where 3600 is the number of seconds in an hour (that is 1 hour multiplied by 60 minutes multiplied by 60 seconds) to the "midnight" variable. This allows us to specify a time for daily analysis after the market opens, facilitating our analysis of price action starting from the early hours of the trading day.
Finally, we establish the variable "scanBarTime" to indicate the scan time for the next bar after "sixAM". We achieve this by dynamically adding an extra bar to the current 6 AM scan time so that we consider the 6 AM bar as well for the scan. The 1 represents the number of bars to jump the scan to and the PeriodSeconds function automatically converts the current chart period to seconds. For example, we could have a 1-hour chart, which means that we convert the 1 hour to seconds and multiply the seconds by 1 bar, which would typically yield 3600 seconds, and then add them to 6 AM, landing us at 7 AM bar. Overall, these static variables are crucial for implementing our time-based logic within the trading strategy.
Next, we can also declare variables to define our valid breakout ranges in time, if a breakout happens after 7 hours or a specific time like 1 PM, we don't consider any signal valid, and thus we wait for the next day's setup.
   static datetime validBreakTime_start = scanBarTime;     //--- Set the start of valid breakout time
   static datetime validBreakTime_end = midnight + (6+5) * 3600; //--- Set the end of valid breakout time to 11 AM
Here, we declare two additional static variables to define the time window for valid breakout conditions within our trading strategy. The first variable, "validBreakTime_start", is initialized with the value of "scanBarTime", which we previously established. This sets the beginning of our valid breakout time, allowing us to focus on price action starting from the next bar after 6 AM.
The second variable, "validBreakTime_end", is calculated by adding (6 + 5) * 3600 to the "midnight" variable. This expression specifies the end of our valid breakout period, which corresponds to 11 AM. By establishing this time frame, we create a clear window during which we will evaluate breakout conditions, ensuring that our trading decisions are based on price movements that occur within this defined range. After all that, we are all set to begin our logic. The first thing we need to consider is that we want to check for the setups every day, so, we will require to have a logic that identifies a new day.
   if (isNewDay()){
        //---

   }
We use an if statement to check for a new day and if it does exist, we execute the code snippet inside it. We use a custom boolean function "isNewDay" to check for a new day. Its logic is as below:
bool isNewDay() {
   //--- Flag to indicate if a new day has started
   bool newDay = false;

   //--- Structure to hold the current date and time
   MqlDateTime Str_DateTime;

   //--- Convert the current time to a structured format
   TimeToStruct(TimeCurrent(), Str_DateTime);

   //--- Static variable to store the previous day
   static int prevDay = 0;

   //--- Get the current day from the structured time
   int currDay = Str_DateTime.day;

   //--- If the previous day is the same as the current day, we're still on the same day
   if (prevDay == currDay) {
      newDay = false;
   }
   //--- If the current day differs from the previous one, we have a new day
   else if (prevDay != currDay) {
      //--- Print a message indicating the new day
      Print("WE HAVE A NEW DAY WITH DATE ", currDay);

      //--- Update the previous day to the current day
      prevDay = currDay;

      //--- Set the flag to true, indicating a new day has started
      newDay = true;
   }

   //--- Return whether a new day has started
   return (newDay);
}
Here, we define the boolean function "isNewDay," which is responsible for determining whether a new day has started in our trading strategy. We initialize a boolean variable "newDay" to "false", which serves as a flag to indicate whether a new day has begun. To keep track of the current date and time, we create a structure of type MqlDateTime called "Str_DateTime". We use the function TimeToStruct to convert the current time obtained from the current time into a structured format, filling the "Str_DateTime" structure with relevant date and time information.
Next, we declare a static integer variable "prevDay", initialized to zero, which stores the day of the last recorded date. We then retrieve the current day from the "Str_DateTime" structure, assigning it to the integer variable "currDay".
We compare "prevDay" with "currDay". If they are equal, it means we are still within the same day, and we set "newDay" to "false". Conversely, if "prevDay" differs from "currDay," we recognize that a new day has begun. In this case, we print a message indicating the transition to a new day using the Print function, updating the "prevDay" variable with the value of "currDay". We then set the "newDay" flag to "true", confirming that a new day has started. Finally, the function returns the value of the "newDay" flag, allowing us to use this information in our trading logic to determine if any actions need to be taken based on the start of a new day.
It is now in this function that we reset everything when it is a new day for the day's calculations and control logic mapping as follows.
      //--- Reset values for the new day
      midnight = iTime(_Symbol,PERIOD_D1,0);    //--- Get the new midnight time
      sixAM = midnight + 6 * 3600;              //--- Recalculate 6 AM
      scanBarTime = sixAM + 1 * PeriodSeconds(_Period); //--- Recalculate the scan bar time

      validBreakTime_start = scanBarTime;       //--- Update valid breakout start time
      validBreakTime_end = midnight + (6+5) * 3600; //--- Update valid breakout end time to 11 AM

      maximum_price = -DBL_MAX;                 //--- Reset the maximum price for the new day
      minimum_price = DBL_MAX;                  //--- Reset the minimum price for the new day

      isHaveDailyRange_Prices = false;          //--- Reset the daily range flag for the new day
      isHaveRangeBreak = false;                 //--- Reset the breakout flag for the new day
In the function, we reset various variables and parameters at the beginning of a new trading day to prepare for fresh calculations and data tracking. We start by obtaining the new midnight time for the current day using the function iTime, which provides the timestamp for the start of the current daily bar. We then update the variable "midnight" with this new value.
Next, we recalculate the time for 6 AM by adding 6 hours, represented as "6 * 3600", to the newly set "midnight" variable. This gives us a reference point for the start of the trading session in the morning. Following this, we set "scanBarTime" to be one bar after 6 AM by adding the duration of one period, obtained through the PeriodSeconds function, ensuring that we align our calculations with the current chart period.
We then proceed to update the valid breakout time windows by setting "validBreakTime_start" to the newly calculated "scanBarTime." This adjustment indicates the starting point for considering potential breakouts during the trading day. We also set "validBreakTime_end" to be 11 AM by calculating it as "midnight + (6 + 5) * 3600", ensuring that we have a clear endpoint for our breakout evaluation. Furthermore, we reset the values of "maximum_price" and "minimum_price" to track price movements for the new day, initializing "maximum_price" to -DBL_MAX (the lowest possible value) and "minimum_price" to DBL_MAX (the highest possible value). This reset allows us to capture the highest and lowest prices throughout the day accurately.
Finally, we set the boolean flags "isHaveDailyRange_Prices" and "isHaveRangeBreak" to "false", indicating that we have not yet established a daily range or identified a range breakout for the new day. This complete reset prepares our system for fresh calculations, ensuring that we accurately monitor the price action as the day unfolds. Now we can graduate to the bar scan logic. We do not need to do the scan on every tick, but just when there is a new bar that has been generated. Thus, we will need to have another control logic to handle new bar identification.
   if (isNewBar()){
        //---

   }
Here, we still use an if statement in conjunction with the "isNewBar" function to effect the new bar generation logic. The function code adapted is shown below in a code snippet.
bool isNewBar() {
   //--- Static variable to hold the previous number of bars
   static int prevBars = 0;

   //--- Get the current number of bars on the chart
   int currBars = iBars(_Symbol, _Period);

   //--- If the number of bars hasn't changed, return false
   if (prevBars == currBars) return (false);

   //--- Update the previous bar count with the current one
   prevBars = currBars;

   //--- Return true if a new bar has been formed
   return (true);
}
We begin by declaring a static variable called "prevBars," which stores the previous count of bars displayed on the chart. The static keyword ensures that the variable retains its value between function calls, allowing us to track changes in the bar count effectively. Next, we obtain the current number of bars on the chart using the function iBars, where _Symbol represents the trading instrument and _Period refers to the chart's time frame. This function returns the total number of bars currently available for the specified symbol and period.
We then compare the current bar count, stored in the variable "currBars", with the previous bar count, "prevBars". If these two values are equal, it indicates that no new bar has been formed since the last check, so we return "false" to indicate that we are still on the same bar. If the counts differ, it means a new bar has been created, prompting us to update "prevBars" with the value of "currBars". Finally, we return "true" to signal that a new bar has indeed formed. Next, inside the function, we need to process the data when a new bar is formed, particularly focusing on a specific time condition for extracting price data.
      //--- If a new bar has been formed, process the data
      datetime currentBarTime = iTime(_Symbol,_Period,0); //--- Get the time of the current bar

      if (currentBarTime == scanBarTime && !isHaveDailyRange_Prices){
         //--- If it's time to scan and the daily range is not yet extracted
         Print("WE HAVE ENOUGH BARS DATA FOR DOCUMENTATION. MAKE THE EXTRACTION"); //--- Log the extraction process
         int total_bars = int((sixAM - midnight)/PeriodSeconds(_Period)) + 1; //--- Calculate total bars between midnight and 6 AM
         Print("Total Bars for scan = ",total_bars); //--- Log the total number of bars for scanning
         int highest_price_bar_index = -1;   //--- Variable to store the bar index of the highest price
         int lowest_price_bar_index = -1;    //--- Variable to store the bar index of the lowest price

         //---

      }
First, we declare a variable "currentBarTime" using the iTime function, which retrieves the time of the current bar on the chart. This helps us determine if we're at a specific point in time during the day when we want to process certain price data. Next, we check two conditions in the if statement. First, we verify if the current bar's time matches the scan bar time, which is the designated time we plan to analyze (in this case, set for 6 AM). Second, we check if the daily range prices haven't been extracted yet by verifying that the flag "isHaveDailyRange_Prices" is false. If both conditions are true, it means we're at the right time, and the price range data needs to be extracted.
We then log a message using the Print function to indicate that enough bar data is available and that the extraction process will begin. This helps to trace when and why the process is triggered during execution. We proceed to calculate the total number of bars between midnight and 6 AM, which is crucial for determining the price range over that period. The PeriodSeconds function gives the time duration of each bar, and we divide the time difference between "sixAM" and "midnight" by this duration to compute the total number of bars. We add 1 to ensure all bars in this range are included.
Finally, we print the total number of bars for scanning using another Print function, and then declare two variables: "highest_price_bar_index" and "lowest_price_bar_index". We initialize these variables to -1 and we'll use them to store the index of the bars that contain the highest and lowest prices, respectively, within the observed range. This setup prepares us for extracting the price data from these specific bars. When we run the program, we have the following results.
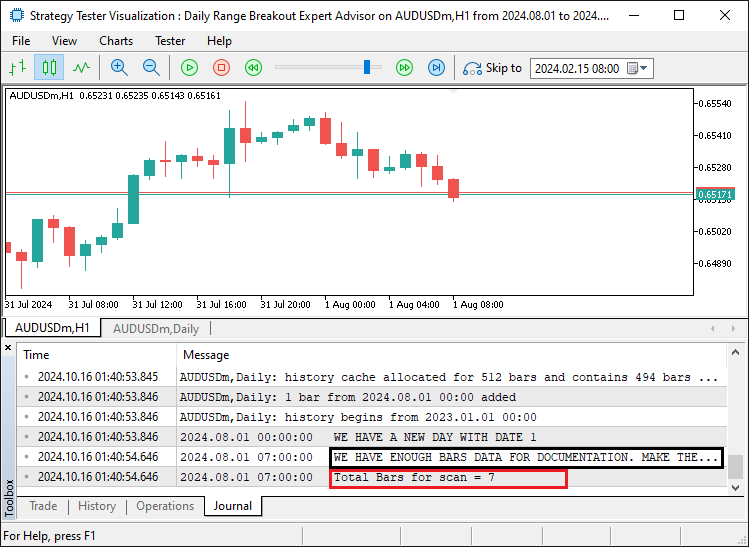
We can see that once the required number of bars for range consideration has been established, we inform of the completion status and the number of bars within the range for consideration. At this point, we can proceed to extract data from the daily range identified and establish the range boundaries.
         for (int i=1; i<=total_bars ; i++){ //--- Loop through all bars within the defined time range
            double open_i = open(i);         //--- Get the opening price of the i-th bar
            double close_i = close(i);       //--- Get the closing price of the i-th bar

            double highest_price_i = (open_i > close_i) ? open_i : close_i; //--- Determine the highest price between open and close
            double lowest_price_i = (open_i < close_i) ? open_i : close_i;  //--- Determine the lowest price between open and close

            if (highest_price_i > maximum_price){
               //--- If the current highest price is greater than the recorded maximum price
               maximum_price = highest_price_i; //--- Update the maximum price
               highest_price_bar_index = i;     //--- Update the index of the highest price bar
               maximum_time = time(i);          //--- Update the time of the highest price
            }
            if (lowest_price_i < minimum_price){
               //--- If the current lowest price is lower than the recorded minimum price
               minimum_price = lowest_price_i;  //--- Update the minimum price
               lowest_price_bar_index = i;      //--- Update the index of the lowest price bar
               minimum_time = time(i);          //--- Update the time of the lowest price
            }
         }
To make the data extraction, we loop through all the bars within the specific time range (from midnight to 6 AM) to determine the highest and lowest prices. The goal is to find the maximum and minimum prices that occurred within this range and record the time when they happened. We start by setting up a for loop with the statement "for (int i=1; i<=total_bars ; i++)". This statement means that the loop runs through each bar, from the first one (index 1) up to "total_bars", which was previously calculated to represent the number of bars between midnight and 6 AM. The variable "i" represents the index of each bar in the loop.
Inside the loop, we retrieve the opening and closing prices for each bar using the custom functions "open" and "close", respectively. These two variables—"open_i" for the opening price and "close_i" for the closing price—help us analyze the price movement of each bar. Before we proceed any further, these custom functions are just utility functions that we define elsewhere in the global scope and use them directly and their code snippet is as below.
//--- Utility functions to retrieve price and time data for a given bar index
double open(int index){return (iOpen(_Symbol,_Period,index));}   //--- Get the opening price
double high(int index){return (iHigh(_Symbol,_Period,index));}   //--- Get the highest price
double low(int index){return (iLow(_Symbol,_Period,index));}     //--- Get the lowest price
double close(int index){return (iClose(_Symbol,_Period,index));} //--- Get the closing price
datetime time(int index){return (iTime(_Symbol,_Period,index));} //--- Get the time of the bar
Next, we use a ternary operation to determine the highest and lowest prices for each bar. The statement "double highest_price_i = (open_i > close_i) ? open_i : close_i;" checks if the opening price is greater than the closing price. If it is, the opening price is set as the highest price for that bar. Otherwise, the closing price becomes the highest. Similarly, "double lowest_price_i = (open_i < close_i) ? open_i : close_i;" compares the opening and closing prices to determine the lowest price for the bar.
After calculating the highest and lowest prices for the current bar, we compare them to the overall maximum and minimum price for the entire period up to this point:
- If the highest price for that selected bar is greater than the recorded maximum price, we update the maximum price to this new value. We also store the index of this bar in "highest_price_bar_index" and record the time of this bar using the "time" function, which retrieves the time associated with the i-th bar. This allows us to track when the highest price occurred.
- If the "lowest_price_i" is lower than the recorded "minimum_price", we update the "minimum_price" to this new value. We also store the index of this bar in "lowest_price_bar_index" and record the time of this bar in "minimum_time" using the "time" function.
This process ensures that by the end of the loop, we have identified the highest and lowest prices within the time range from midnight to 6 AM, as well as the times at which they occurred. We will use these values later to set key price levels for breakout analysis. To ensure that we get the price levels, we can log them for confirmation purposes.
         //--- Log the maximum and minimum prices, along with their respective bar indices and times
         Print("Maximum Price = ",maximum_price,", Bar index = ",highest_price_bar_index,", Time = ",maximum_time);
         Print("Minimum Price = ",minimum_price,", Bar index = ",lowest_price_bar_index,", Time = ",minimum_time);
Here, we just print the maximum and minimum prices identified along with their bar indices and time for confirmation purposes. Once we run the program, we have the following data:
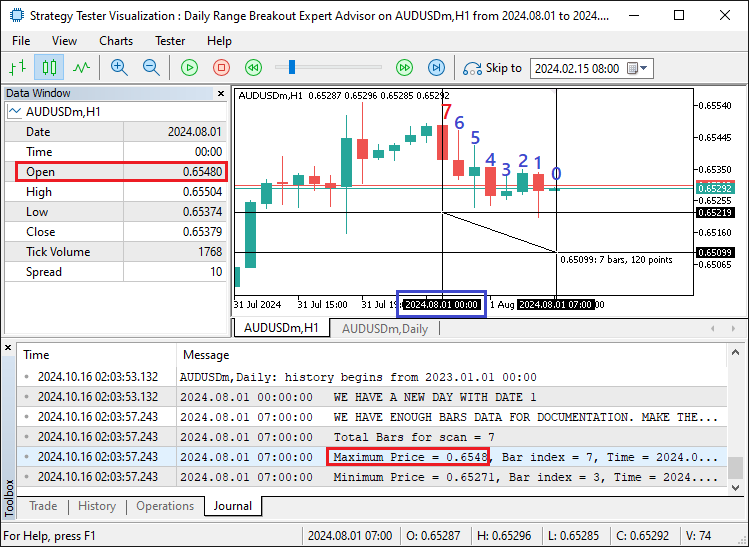
From the image, we can see that our maximum prices are at the 7th bar, whose data from the log is 0.6548 which matches the open price at the data window. Its time is midnight as shown in the cross-hair's time and date scale on the x-axis. Thus, we can be sure that we have the daily prices and we can use them for further analysis. However, we don't need to do the analysis any longer during the day since we already have acquired the necessary data. Thus, we can set our boolean flag for the prices track variable to true and wait for the next day to acquire the prices again.
isHaveDailyRange_Prices = true; //--- Set the flag indicating daily range prices have been extracted
Once we set the flag, we are all set. However, we do not visually see the range setup on the chart. We can thus develop some mechanism that we can use to plot the ranges on the chart. To achieve this, we will need to create functions that we can reuse. The first function is the one that will handle the creation of rectangles.
//+------------------------------------------------------------------+
//|       FUNCTION TO CREATE A RECTANGLE                             |
//+------------------------------------------------------------------+
void create_Rectangle(string objName, datetime time1, double price1, datetime time2, double price2, color clr) {
   //--- Check if the object already exists by finding it on the chart
   if (ObjectFind(0, objName) < 0) {
      //--- Create a rectangle object using the defined parameters: name, type, and coordinates
      ObjectCreate(0, objName, OBJ_RECTANGLE, 0, time1, price1, time2, price2);

      //--- Set the time for the first point of the rectangle (start point)
      ObjectSetInteger(0, objName, OBJPROP_TIME, 0, time1);

      //--- Set the price for the first point of the rectangle (start point)
      ObjectSetDouble(0, objName, OBJPROP_PRICE, 0, price1);

      //--- Set the time for the second point of the rectangle (end point)
      ObjectSetInteger(0, objName, OBJPROP_TIME, 1, time2);

      //--- Set the price for the second point of the rectangle (end point)
      ObjectSetDouble(0, objName, OBJPROP_PRICE, 1, price2);

      //--- Enable the fill property for the rectangle, making it filled
      ObjectSetInteger(0, objName, OBJPROP_FILL, true);

      //--- Set the color for the rectangle
      ObjectSetInteger(0, objName, OBJPROP_COLOR, clr);

      //--- Set the rectangle to not appear behind other objects
      ObjectSetInteger(0, objName, OBJPROP_BACK, false);

      //--- Redraw the chart to reflect the new changes
      ChartRedraw(0);
   }
}
Here, we create a void function "create_Rectangle" that will handle the creation of a rectangle object on a chart in MetaTrader. The function takes six parameters: "objName" (the name of the object), "time1" and "price1" (coordinates of the first corner of the rectangle), "time2" and "price2" (coordinates of the opposite corner), and "clr" (the color of the rectangle). In the function, we first check if an object with the given name already exists on the chart by using the ObjectFind function. If the object is not found (i.e., it returns a value less than 0), we proceed to create the rectangle.
We then call ObjectCreate function to create the rectangle object, providing the necessary parameters: the chart ID (set to 0 for the current chart), the object name, the object type (OBJ_RECTANGLE), and the coordinates (defined by "time1, price1" and "time2, price2").
Next, we use the ObjectSetInteger and ObjectSetDouble functions to set the individual properties of the rectangle:
- "ObjectSetInteger(0, objName, OBJPROP_TIME, 0, time1)" sets the time for the first corner (starting point) of the rectangle.
- "ObjectSetDouble(0, objName, OBJPROP_PRICE, 0, price1)" sets the price for the first corner (starting point) of the rectangle.
- "ObjectSetInteger(0, objName, OBJPROP_TIME, 1, time2)" sets the time for the second corner (ending point) of the rectangle.
- "ObjectSetDouble(0, objName, OBJPROP_PRICE, 1, price2)" sets the price for the second corner (ending point) of the rectangle.
We also enable the fill property for the rectangle using OBJPROP_FILL method, which makes the rectangle visually filled on the chart, instead of being just an outline. After this, we set the rectangle's color using OBJPROP_COLOR method, applying the specified color ("clr") passed into the function. The rectangle is further configured to appear in front of other objects by disabling the OBJPROP_BACK property. Finally, we call ChartRedraw function to refresh the chart, ensuring that the newly created rectangle is displayed immediately on the chart. The next function that we need to define is one for creating lines on the chart so that we use them to show the range of time start and end.
//+------------------------------------------------------------------+
//|      FUNCTION TO CREATE A TREND LINE                             |
//+------------------------------------------------------------------+
void create_Line(string objName, datetime time1, double price1, datetime time2, double price2, int width, color clr, string text) {
   //--- Check if the line object already exists by its name
   if (ObjectFind(0, objName) < 0) {
      //--- Create a trendline object with the specified parameters
      ObjectCreate(0, objName, OBJ_TREND, 0, time1, price1, time2, price2);

      //--- Set the time for the first point of the trendline
      ObjectSetInteger(0, objName, OBJPROP_TIME, 0, time1);

      //--- Set the price for the first point of the trendline
      ObjectSetDouble(0, objName, OBJPROP_PRICE, 0, price1);

      //--- Set the time for the second point of the trendline
      ObjectSetInteger(0, objName, OBJPROP_TIME, 1, time2);

      //--- Set the price for the second point of the trendline
      ObjectSetDouble(0, objName, OBJPROP_PRICE, 1, price2);

      //--- Set the width for the line
      ObjectSetInteger(0, objName, OBJPROP_WIDTH, width);

      //--- Set the color of the trendline
      ObjectSetInteger(0, objName, OBJPROP_COLOR, clr);

      //--- Set the trendline to not be behind other objects
      ObjectSetInteger(0, objName, OBJPROP_BACK, false);

      //--- Retrieve the current chart scale
      long scale = 0;
      if(!ChartGetInteger(0, CHART_SCALE, 0, scale)) {
         //--- Print an error message if unable to retrieve the chart scale
         Print("UNABLE TO GET THE CHART SCALE. DEFAULT OF ", scale, " IS CONSIDERED");
      }
      //--- Set a default font size based on the chart scale
      int fontsize = 11;
      if (scale == 0) { fontsize = 5; }
      else if (scale == 1) { fontsize = 6; }
      else if (scale == 2) { fontsize = 7; }
      else if (scale == 3) { fontsize = 9; }
      else if (scale == 4) { fontsize = 11; }
      else if (scale == 5) { fontsize = 13; }

      //--- Define the description text to appear near the right price
      string txt = " Right Price";
      string objNameDescr = objName + txt;

      //--- Create a text object next to the line to display the description
      ObjectCreate(0, objNameDescr, OBJ_TEXT, 0, time2, price2);

      //--- Set the color for the text
      ObjectSetInteger(0, objNameDescr, OBJPROP_COLOR, clr);

      //--- Set the font size for the text
      ObjectSetInteger(0, objNameDescr, OBJPROP_FONTSIZE, fontsize);

      //--- Anchor the text to the left of the line
      ObjectSetInteger(0, objNameDescr, OBJPROP_ANCHOR, ANCHOR_LEFT);

      //--- Set the text content to display the specified string
      ObjectSetString(0, objNameDescr, OBJPROP_TEXT, " " + text);

      //--- Set the font of the text to "Calibri"
      ObjectSetString(0, objNameDescr, OBJPROP_FONT, "Calibri");

      //--- Redraw the chart to reflect the changes
      ChartRedraw(0);
   }
}
Here, we create another void function "create_Line" and pass the necessary parameters to it as well. The function takes eight parameters: "objName" (name of the line object), "time1" and "price1" (coordinates of the starting point), "time2" and "price2" (coordinates of the end point), "width" (the thickness of the line), "clr" (the color of the line), and "text" (the description to be displayed next to the trendline). We start by checking whether the trendline already exists on the chart by using ObjectFind. If the trendline object with the specified name does not exist (returns less than 0), we proceed with creating the line.
To create the trendline, we use ObjectCreate function, which defines the object type as OBJ_TREND and assigns the starting ("time1, price1") and ending ("time2, price2") coordinates for the trendline.
We then use ObjectSetInteger and ObjectSetDouble to assign properties to both the starting and ending points of the line:
- "ObjectSetInteger(0, objName, OBJPROP_TIME, 0, time1)" sets the time of the first point.
- "ObjectSetDouble(0, objName, OBJPROP_PRICE, 0, price1)" sets the price of the first point.
- "ObjectSetInteger(0, objName, OBJPROP_TIME, 1, time2)" sets the time of the second point.
- "ObjectSetDouble(0, objName, OBJPROP_PRICE, 1, price2)" sets the price of the second point.
We proceed by setting the width of the line using OBJPROP_WIDTH property, which controls how thick the line will be, followed by setting the color of the line. Next, we ensure the line is displayed in front of other objects by setting OBJPROP_BACK property to false, meaning the trendline will not appear behind other chart elements.
To enhance the trendline's display, we retrieve the current chart scale using ChartGetInteger. If we successfully obtain the scale, we use it to set a font size for the descriptive text that will be displayed alongside the line. Based on the chart scale, we adjust the font size accordingly, with a default of 11. Next, we define a descriptive label "Right Price" to be placed next to the trendline, and we generate an object name for this label by appending "txt" to the original object name, forming "objNameDescr".
We then create the text object using ObjectCreate function, placing it at the end of the line ("time2, price2") and setting various properties:
- "ObjectSetInteger(0, objNameDescr, OBJPROP_COLOR, clr)" sets the text color to match the trendline color.
- "ObjectSetInteger(0, objNameDescr, OBJPROP_FONTSIZE, fontsize)" sets the font size based on the previously calculated value.
- "ObjectSetInteger(0, objNameDescr, OBJPROP_ANCHOR, ANCHOR_LEFT)" anchors the text to the left of the line.
- "ObjectSetString(0, objNameDescr, OBJPROP_TEXT, ' ' + text)" sets the actual text content to the "text" parameter passed into the function.
- "ObjectSetString(0, objNameDescr, OBJPROP_FONT, 'Calibri')" sets the font of the text to "Calibri" for clear readability.
Finally, we refresh the chart by calling ChartRedraw to ensure the newly created trendline and accompanying text are displayed properly on the chart. We can then call these functions and use them to map the range details.
         //--- Create visual elements to represent the daily range
         create_Rectangle(RECTANGLE_PREFIX+TimeToString(maximum_time),maximum_time,maximum_price,minimum_time,minimum_price,clrBlue); //--- Create a rectangle for the daily range
         create_Line(UPPER_LINE_PREFIX+TimeToString(midnight),midnight,maximum_price,sixAM,maximum_price,3,clrBlack,DoubleToString(maximum_price,_Digits)); //--- Draw upper range line
         create_Line(LOWER_LINE_PREFIX+TimeToString(midnight),midnight,minimum_price,sixAM,minimum_price,3,clrRed,DoubleToString(minimum_price,_Digits));   //--- Draw lower range line
Once we compile the code and run the program, we get the following details.
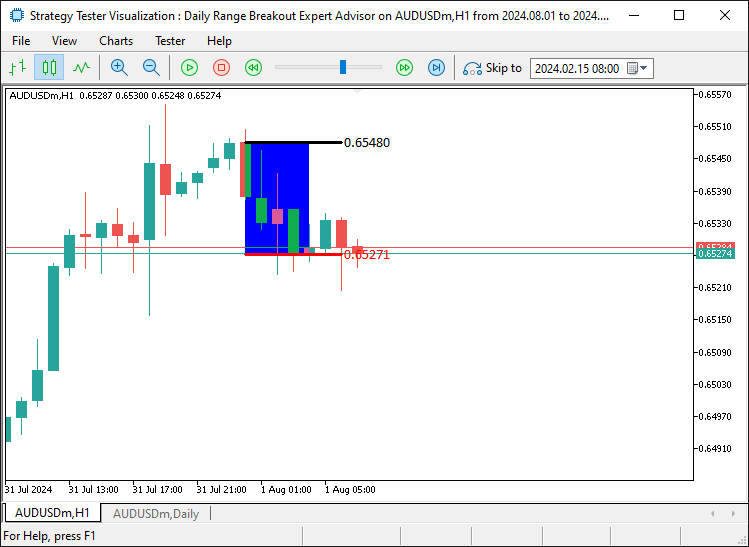
We can now see that we visually map and plot the range details on the chart which is more appealing and easy to reference and confirm the prices. Now, the next thing that we need to do is check for breakouts. This is the point where we need to do checks on every tick to determine level breaks and if conditions are met, initiate the respective trading logic. For the upper-level breakout, we have the following logic.
   //--- Get the close price and time of the previous bar
   double barClose = close(1);
   datetime barTime = time(1);

   //--- Check for upper range breakout condition
   if (barClose > maximum_price && isHaveDailyRange_Prices && !isHaveRangeBreak
       && barTime >= validBreakTime_start && barTime <= validBreakTime_end){
      Print("CLOSE Price broke the HIGH range. ",barClose," > ",maximum_price); //--- Log the breakout event
      isHaveRangeBreak = true; //--- Set the flag indicating a breakout occurred
      drawBreakPoint(TimeToString(barTime),barTime,barClose,234,clrBlack,-1); //--- Draw a point to mark the breakout
   }
Here, we check whether the closing price of the previous bar exceeds the daily maximum price, an indication of an upper-range breakout. First, we retrieve the closing price and time of the previous bar using "close" and "time" custom functions, storing these values in "barClose" and "barTime" respectively. This allows us to reference the close price and time of the bar we are analyzing.
Next, we perform a series of checks to confirm if a breakout has occurred. We check if "barClose" is greater than "maximum_price", ensuring that the close price exceeds the highest price recorded for the day. We also verify that the daily range prices have been extracted using the "isHaveDailyRange_Prices" flag and confirm that no breakout has been detected earlier with the "!isHaveRangeBreak" flag. Additionally, we ensure that the breakout occurs within the valid breakout window by checking if "barTime" falls between "validBreakTime_start" and "validBreakTime_end".
If all conditions are satisfied, we log the breakout event by printing a message that the close price has broken the upper range. We then set "isHaveRangeBreak" to true, marking that a breakout has been detected. Finally, we call the "drawBreakPoint" function to visually mark this breakout on the chart. The function uses the bar's time, close price, marker size, color, and priority to display a visual representation of the breakout. Here is the function's logic, which is similar to the previous functions.
//+------------------------------------------------------------------+
//|       FUNCTION TO CREATE AN ARROW                                |
//+------------------------------------------------------------------+
void drawBreakPoint(string objName, datetime time, double price, int arrCode, color clr, int direction) {
   //--- Check if the arrow object already exists on the chart
   if (ObjectFind(0, objName) < 0) {
      //--- Create an arrow object with the specified time, price, and arrow code
      ObjectCreate(0, objName, OBJ_ARROW, 0, time, price);

      //--- Set the arrow's code (symbol)
      ObjectSetInteger(0, objName, OBJPROP_ARROWCODE, arrCode);

      //--- Set the color for the arrow
      ObjectSetInteger(0, objName, OBJPROP_COLOR, clr);

      //--- Set the font size for the arrow
      ObjectSetInteger(0, objName, OBJPROP_FONTSIZE, 12);

      //--- Set the anchor position for the arrow based on the direction
      if (direction > 0) ObjectSetInteger(0, objName, OBJPROP_ANCHOR, ANCHOR_TOP);
      if (direction < 0) ObjectSetInteger(0, objName, OBJPROP_ANCHOR, ANCHOR_BOTTOM);

      //--- Define a text label for the break point
      string txt = " Break";
      string objNameDescr = objName + txt;

      //--- Create a text object for the break point description
      ObjectCreate(0, objNameDescr, OBJ_TEXT, 0, time, price);

      //--- Set the color for the text description
      ObjectSetInteger(0, objNameDescr, OBJPROP_COLOR, clr);

      //--- Set the font size for the text
      ObjectSetInteger(0, objNameDescr, OBJPROP_FONTSIZE, 12);

      //--- Adjust the text anchor based on the direction of the arrow
      if (direction > 0) {
         ObjectSetInteger(0, objNameDescr, OBJPROP_ANCHOR, ANCHOR_LEFT_UPPER);
         ObjectSetString(0, objNameDescr, OBJPROP_TEXT, " " + txt);
      }
      if (direction < 0) {
         ObjectSetInteger(0, objNameDescr, OBJPROP_ANCHOR, ANCHOR_LEFT_LOWER);
         ObjectSetString(0, objNameDescr, OBJPROP_TEXT, " " + txt);
      }
   }
   //--- Redraw the chart to reflect the new objects
   ChartRedraw(0);
}
To check for lower-range breakouts, we use a similar logic as we did when looking for upper-level breakouts.
   //--- Check for lower range breakout condition
   else if (barClose < minimum_price && isHaveDailyRange_Prices && !isHaveRangeBreak
            && barTime >= validBreakTime_start && barTime <= validBreakTime_end){
      Print("CLOSE Price broke the LOW range. ",barClose," < ",minimum_price); //--- Log the breakout event
      isHaveRangeBreak = true; //--- Set the flag indicating a breakout occurred
      drawBreakPoint(TimeToString(barTime),barTime,barClose,233,clrBlue,1); //--- Draw a point to mark the breakout
   }
Upon compilation, we have the following outcome.
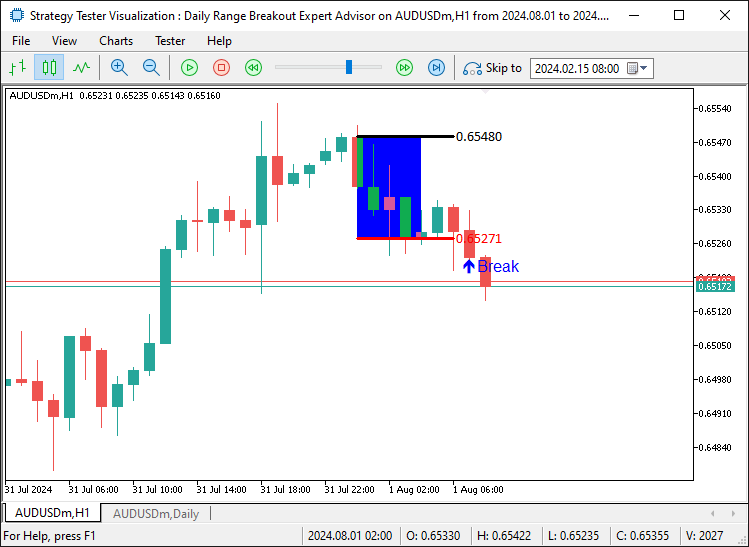
That was a success. We can see that once we have a breakout of the lower level, we have a breakpoint arrow that is shown on the chart, visually pinpointing the candle where the break occurs. Let us let the program and see the opposite breakout as well.
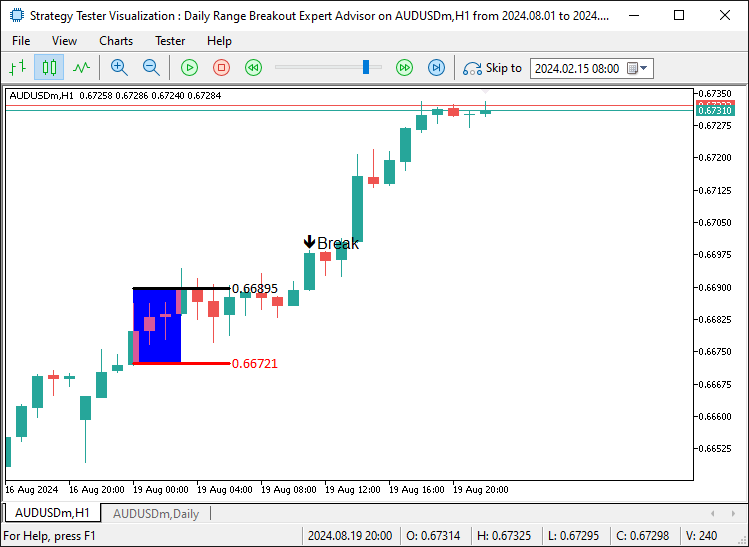
That was a success. We can also see that we do have a breakout on the upper level just as anticipated. The next thing that we need to do is open positions once these breakouts occur and that will be all.
   double Ask = NormalizeDouble(SymbolInfoDouble(_Symbol,SYMBOL_ASK),_Digits);
   double Bid = NormalizeDouble(SymbolInfoDouble(_Symbol,SYMBOL_BID),_Digits);

   //--- Check for upper range breakout condition
   if (barClose > maximum_price && isHaveDailyRange_Prices && !isHaveRangeBreak
       && barTime >= validBreakTime_start && barTime <= validBreakTime_end){
      Print("CLOSE Price broke the HIGH range. ",barClose," > ",maximum_price); //--- Log the breakout event
      isHaveRangeBreak = true; //--- Set the flag indicating a breakout occurred
      drawBreakPoint(TimeToString(barTime),barTime,barClose,234,clrBlack,-1); //--- Draw a point to mark the breakout
      obj_Trade.Buy(0.01,_Symbol,Ask,minimum_price,Bid+(maximum_price-minimum_price)*2);
   }
   //--- Check for lower range breakout condition
   else if (barClose < minimum_price && isHaveDailyRange_Prices && !isHaveRangeBreak
            && barTime >= validBreakTime_start && barTime <= validBreakTime_end){
      Print("CLOSE Price broke the LOW range. ",barClose," < ",minimum_price); //--- Log the breakout event
      isHaveRangeBreak = true; //--- Set the flag indicating a breakout occurred
      drawBreakPoint(TimeToString(barTime),barTime,barClose,233,clrBlue,1); //--- Draw a point to mark the breakout
      obj_Trade.Sell(0.01,_Symbol,Bid,maximum_price,Ask-(maximum_price-minimum_price)*2);
   }
With this logic, we can now open positions. Once we run the program, we get the following output.
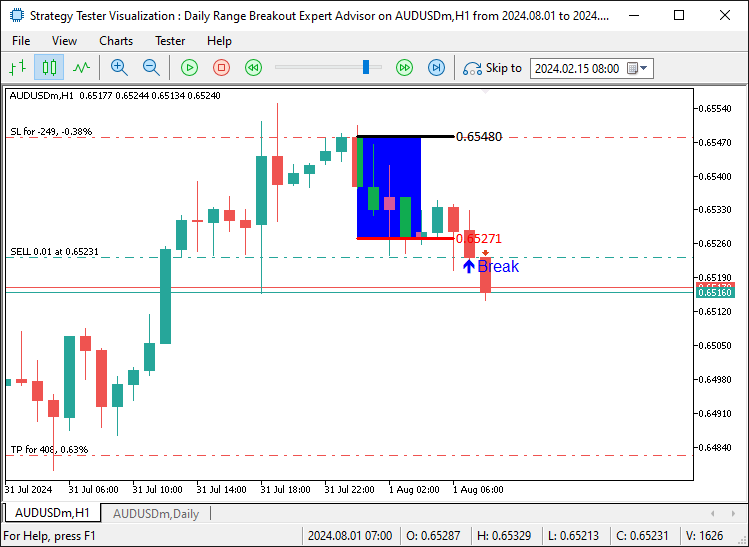
From the image, we can ascertain that we open the positions correctly, by for example placing the stop loss of a sell position at the upper level and the take profit 2 times the range size below the entry point. In the next section, we will focus on testing the program to evaluate its performance and fine-tune the parameters for optimal results.
Backtesting and Optimization
After completing the implementation, the next critical step is to test the Expert Advisor (EA) thoroughly to evaluate its performance and optimize its parameters. Effective testing ensures that the strategy behaves as expected in various market conditions, minimizing the risk of unforeseen issues during trading. Here, we will use the MetaTrader 5 Strategy Tester to perform backtesting and optimization to find the best possible input values for our strategy.
To do the optimization, we will require inputs in the settings section. The optimization that we will adopt will consider the risk to reward ratio, the break validity time in hours and the direction of trade once there is a break. That is, one could consider that when there is lower level break, instead of going short, go long. Simple as that. Here is the logic that we adopt.
enum trade_direction {Default_Trade_Directions,Invert_Trade_Directions};

input int r2r = 2;
input int hoursValidity = 5;
input trade_direction direction_of_trade = Default_Trade_Directions;
Here, we define an enumeration and initialize some input variables that we'll used to control trade behavior and strategy parameters. First, we declare an enum called "trade_direction", which defines two possible values: "Default_Trade_Directions" and "Invert_Trade_Directions". An enum (enumeration) is a user-defined data type in MQL5 that allows us to assign names to integer constants, making the code more readable and easier to manage. In this case, "trade_direction" will help control whether the trade follows the default trading direction or if the direction is inverted based on specific conditions.
Next, we define three input variables that allow the user to modify the values directly from the Expert Advisor settings without editing the code itself, but they will be more useful when we're optimizing the program. The first variable is "r2r", which is set to 2 by default and we'll use it to control a risk-to-reward aspect of the strategy. The input keyword indicates that this variable can be adjusted externally by the user. The second input is "hoursValidity", initialized with a default value of 5. This variable will control how long breakout trading conditions or signals remain valid in terms of hours.
Finally, the third input is "direction_of_trade", which is of type "trade_direction" (the enumeration we defined earlier). By default, we set it to "Default_Trade_Directions", but the user can change it to "Invert_Trade_Directions" if they want the trade to operate in the opposite direction. This input provides flexibility in deciding the trade direction without modifying the core logic of the Expert Advisor. With that in mind, we just have to replace the respective static parameters in the code do add the dynamic aspect.
   static datetime midnight = iTime(_Symbol,PERIOD_D1,0);  //--- Get the time of midnight (start of the day) for daily chart
   static datetime sixAM = midnight + 6 * 3600;            //--- Calculate 6 AM based on midnight time
   static datetime scanBarTime = sixAM + 1 * PeriodSeconds(_Period); //--- Set scan time for the next bar after 6 AM

   static datetime validBreakTime_start = scanBarTime;     //--- Set the start of valid breakout time
   static datetime validBreakTime_end = midnight + (6+hoursValidity) * 3600; //--- Set the end of valid breakout time to 11 AM

   if (isNewDay()){
      //--- Reset values for the new day
      midnight = iTime(_Symbol,PERIOD_D1,0);    //--- Get the new midnight time
      sixAM = midnight + 6 * 3600;              //--- Recalculate 6 AM
      scanBarTime = sixAM + 1 * PeriodSeconds(_Period); //--- Recalculate the scan bar time

      validBreakTime_start = scanBarTime;       //--- Update valid breakout start time
      validBreakTime_end = midnight + (6+hoursValidity) * 3600; //--- Update valid breakout end time to 11 AM

      maximum_price = -DBL_MAX;                 //--- Reset the maximum price for the new day
      minimum_price = DBL_MAX;                  //--- Reset the minimum price for the new day

      isHaveDailyRange_Prices = false;          //--- Reset the daily range flag for the new day
      isHaveRangeBreak = false;                 //--- Reset the breakout flag for the new day
   }

   //---

   //--- Check for upper range breakout condition
   if (barClose > maximum_price && isHaveDailyRange_Prices && !isHaveRangeBreak
       && barTime >= validBreakTime_start && barTime <= validBreakTime_end){
      Print("CLOSE Price broke the HIGH range. ",barClose," > ",maximum_price); //--- Log the breakout event
      isHaveRangeBreak = true; //--- Set the flag indicating a breakout occurred
      drawBreakPoint(TimeToString(barTime),barTime,barClose,234,clrBlack,-1); //--- Draw a point to mark the breakout

      if (direction_of_trade == Default_Trade_Directions){
         obj_Trade.Buy(0.01,_Symbol,Ask,minimum_price,Bid+(maximum_price-minimum_price)*r2r);
      }
      else if (direction_of_trade == Invert_Trade_Directions){
         obj_Trade.Sell(0.01,_Symbol,Bid,Ask+(maximum_price-minimum_price),Ask-(maximum_price-minimum_price)*r2r);
      }
   }
   //--- Check for lower range breakout condition
   else if (barClose < minimum_price && isHaveDailyRange_Prices && !isHaveRangeBreak
            && barTime >= validBreakTime_start && barTime <= validBreakTime_end){
      Print("CLOSE Price broke the LOW range. ",barClose," < ",minimum_price); //--- Log the breakout event
      isHaveRangeBreak = true; //--- Set the flag indicating a breakout occurred
      drawBreakPoint(TimeToString(barTime),barTime,barClose,233,clrBlue,1); //--- Draw a point to mark the breakout

      if (direction_of_trade == Default_Trade_Directions){
         obj_Trade.Sell(0.01,_Symbol,Bid,maximum_price,Ask-(maximum_price-minimum_price)*r2r);
      }
      else if (direction_of_trade == Invert_Trade_Directions){
         obj_Trade.Buy(0.01,_Symbol,Ask,Bid-(maximum_price-minimum_price),Bid+(maximum_price-minimum_price)*r2r);
      }
   }
We now have added the changes and we have highlighted the specific sections for clarity. If we compile that, we can now find the inputs in the inputs section as below, and we can choose from them to do the optimization to find the best trading parameters for the program.
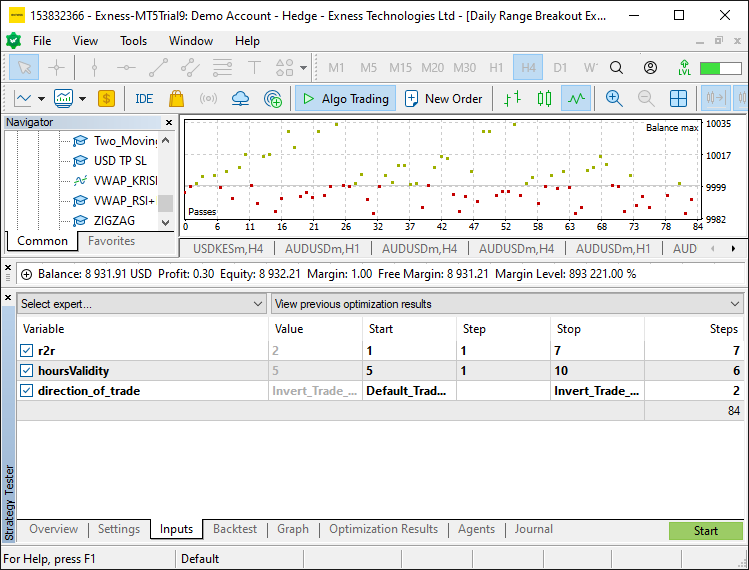
From the image, we can see that we have the optimization inputs and we can just click on the start button to begin the optimization. In this case, we chose just a month so as not to over optimize the program. Once it is completed, we establish the correct settings for the program and use them for the backtest purposes. Here are the results obtained.
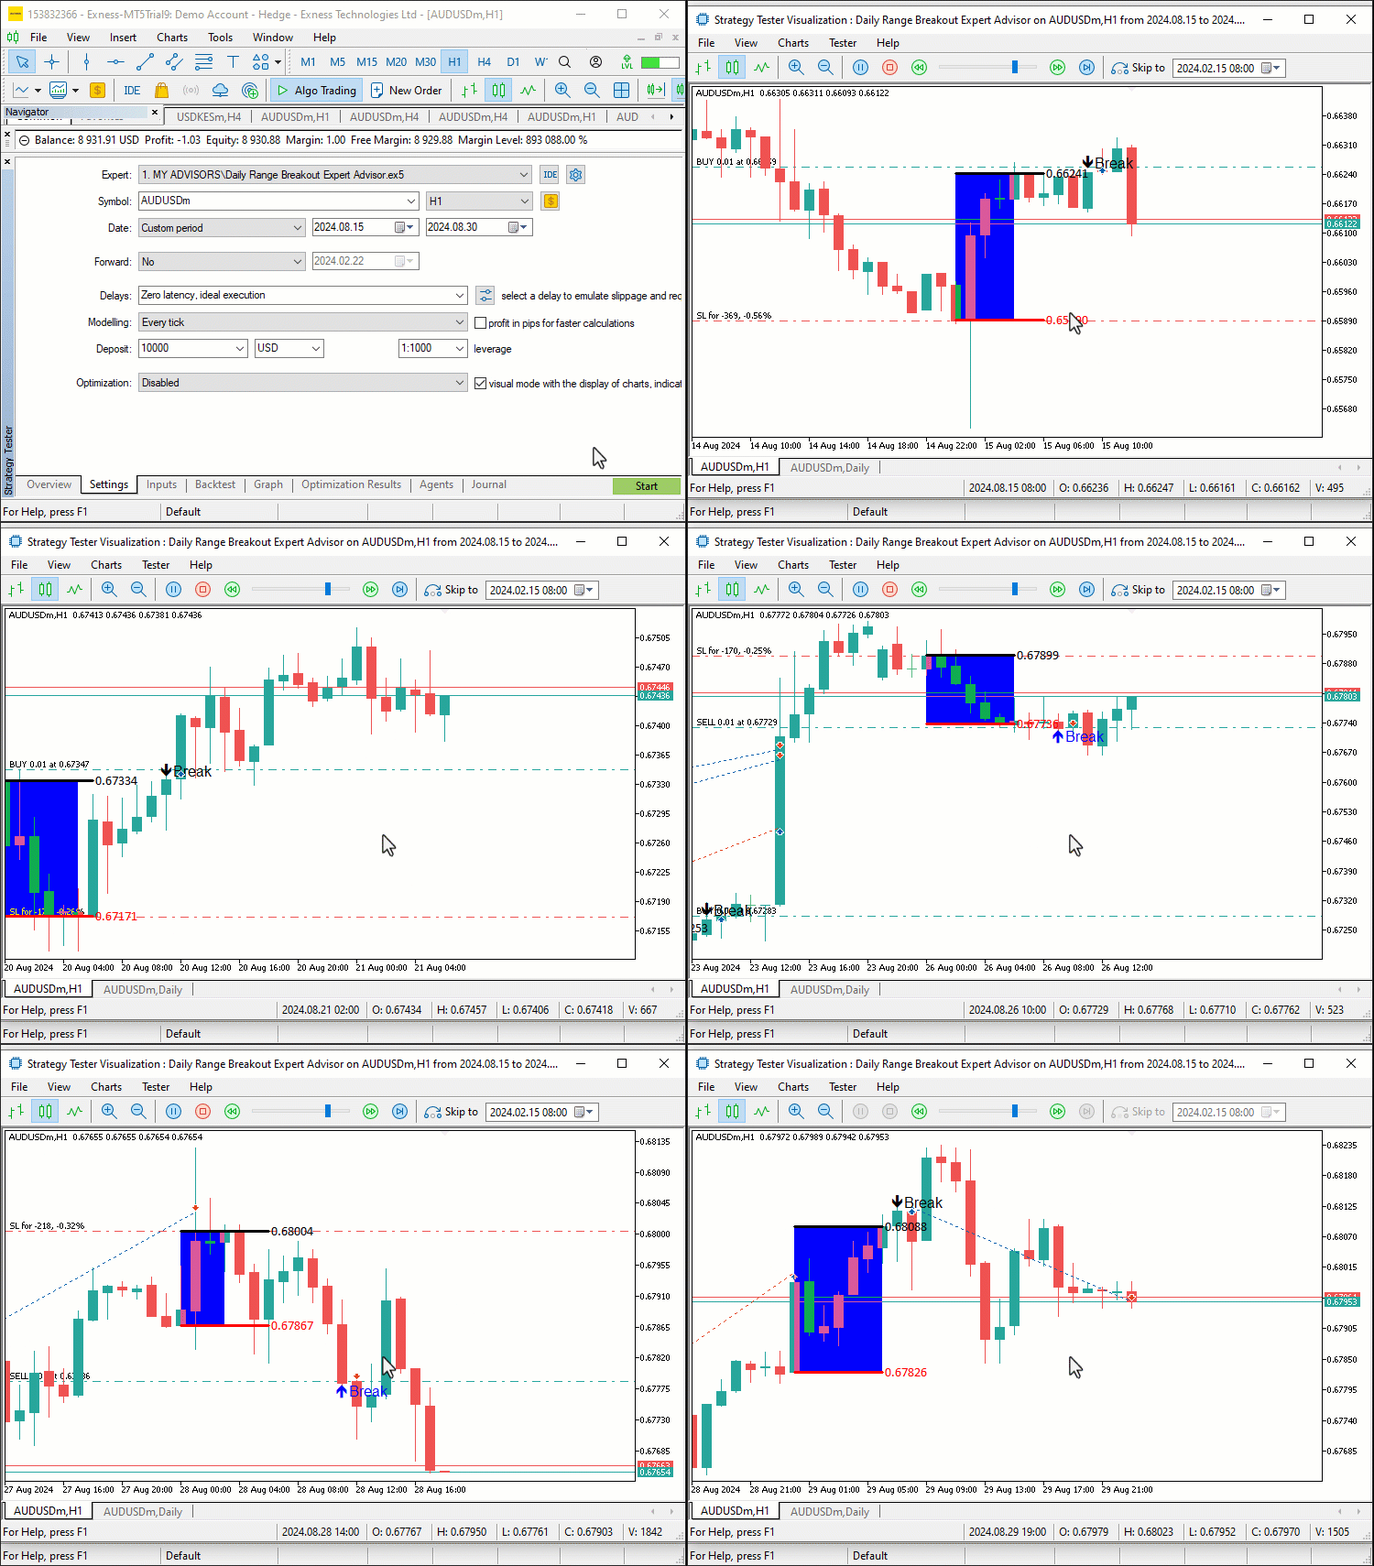
//+------------------------------------------------------------------+
//|                          Daily Range Breakout Expert Advisor.mq5 |
//|      Copyright 2024, ALLAN MUNENE MUTIIRIA. #@Forex Algo-Trader. |
//|                                     https://forexalg0-trader.com |
//+------------------------------------------------------------------+
#property copyright "Copyright 2024, ALLAN MUNENE MUTIIRIA. #@Forex Algo-Trader"
#property link      "https://forexalg0-trader.com"
#property description "Daily Range Breakout Expert Advisor"
#property version   "1.00"

#include <Trade/Trade.mqh>
CTrade obj_Trade;

enum trade_direction {Default_Trade_Directions,Invert_Trade_Directions};

input int r2r = 2;
input int hoursValidity = 5;
input trade_direction direction_of_trade = Default_Trade_Directions;

double maximum_price = -DBL_MAX;  //--- Initialize the maximum price with the smallest possible value
double minimum_price = DBL_MAX;   //--- Initialize the minimum price with the largest possible value
datetime maximum_time, minimum_time; //--- Declare variables to store the time of the highest and lowest prices
bool isHaveDailyRange_Prices = false; //--- Boolean flag to check if daily range prices are extracted
bool isHaveRangeBreak = false;        //--- Boolean flag to check if a range breakout has occurred

#define RECTANGLE_PREFIX "RANGE RECTANGLE " //--- Prefix for naming range rectangles
#define UPPER_LINE_PREFIX "UPPER LINE "     //--- Prefix for naming upper range line
#define LOWER_LINE_PREFIX "LOWER LINE "     //--- Prefix for naming lower range line

//+------------------------------------------------------------------+
//| Expert initialization function                                   |
//+------------------------------------------------------------------+
int OnInit(){
   //--- Initialization code can be placed here if needed

   //---
   return(INIT_SUCCEEDED); //--- Return successful initialization
}
//+------------------------------------------------------------------+
//| Expert deinitialization function                                 |
//+------------------------------------------------------------------+
void OnDeinit(const int reason){
   //--- Deinitialization code can be placed here if needed
}
//+------------------------------------------------------------------+
//| Expert tick function                                             |
//+------------------------------------------------------------------+
void OnTick(){
   //---
   static datetime midnight = iTime(_Symbol,PERIOD_D1,0);  //--- Get the time of midnight (start of the day) for daily chart
   static datetime sixAM = midnight + 6 * 3600;            //--- Calculate 6 AM based on midnight time
   static datetime scanBarTime = sixAM + 1 * PeriodSeconds(_Period); //--- Set scan time for the next bar after 6 AM

   static datetime validBreakTime_start = scanBarTime;     //--- Set the start of valid breakout time
   static datetime validBreakTime_end = midnight + (6+hoursValidity) * 3600; //--- Set the end of valid breakout time to 11 AM

   if (isNewDay()){
      //--- Reset values for the new day
      midnight = iTime(_Symbol,PERIOD_D1,0);    //--- Get the new midnight time
      sixAM = midnight + 6 * 3600;              //--- Recalculate 6 AM
      scanBarTime = sixAM + 1 * PeriodSeconds(_Period); //--- Recalculate the scan bar time

      validBreakTime_start = scanBarTime;       //--- Update valid breakout start time
      validBreakTime_end = midnight + (6+hoursValidity) * 3600; //--- Update valid breakout end time to 11 AM

      maximum_price = -DBL_MAX;                 //--- Reset the maximum price for the new day
      minimum_price = DBL_MAX;                  //--- Reset the minimum price for the new day

      isHaveDailyRange_Prices = false;          //--- Reset the daily range flag for the new day
      isHaveRangeBreak = false;                 //--- Reset the breakout flag for the new day
   }

   if (isNewBar()){
      //--- If a new bar has been formed, process the data
      datetime currentBarTime = iTime(_Symbol,_Period,0); //--- Get the time of the current bar

      if (currentBarTime == scanBarTime && !isHaveDailyRange_Prices){
         //--- If it's time to scan and the daily range is not yet extracted
         Print("WE HAVE ENOUGH BARS DATA FOR DOCUMENTATION. MAKE THE EXTRACTION"); //--- Log the extraction process
         int total_bars = int((sixAM - midnight)/PeriodSeconds(_Period)) + 1; //--- Calculate total bars between midnight and 6 AM
         Print("Total Bars for scan = ",total_bars); //--- Log the total number of bars for scanning
         int highest_price_bar_index = -1;   //--- Variable to store the bar index of the highest price
         int lowest_price_bar_index = -1;    //--- Variable to store the bar index of the lowest price

         for (int i=1; i<=total_bars ; i++){ //--- Loop through all bars within the defined time range
            double open_i = open(i);         //--- Get the opening price of the i-th bar
            double close_i = close(i);       //--- Get the closing price of the i-th bar

            double highest_price_i = (open_i > close_i) ? open_i : close_i; //--- Determine the highest price between open and close
            double lowest_price_i = (open_i < close_i) ? open_i : close_i;  //--- Determine the lowest price between open and close

            if (highest_price_i > maximum_price){
               //--- If the current highest price is greater than the recorded maximum price
               maximum_price = highest_price_i; //--- Update the maximum price
               highest_price_bar_index = i;     //--- Update the index of the highest price bar
               maximum_time = time(i);          //--- Update the time of the highest price
            }
            if (lowest_price_i < minimum_price){
               //--- If the current lowest price is lower than the recorded minimum price
               minimum_price = lowest_price_i;  //--- Update the minimum price
               lowest_price_bar_index = i;      //--- Update the index of the lowest price bar
               minimum_time = time(i);          //--- Update the time of the lowest price
            }
         }
         //--- Log the maximum and minimum prices, along with their respective bar indices and times
         Print("Maximum Price = ",maximum_price,", Bar index = ",highest_price_bar_index,", Time = ",maximum_time);
         Print("Minimum Price = ",minimum_price,", Bar index = ",lowest_price_bar_index,", Time = ",minimum_time);

         //--- Create visual elements to represent the daily range
         create_Rectangle(RECTANGLE_PREFIX+TimeToString(maximum_time),maximum_time,maximum_price,minimum_time,minimum_price,clrBlue); //--- Create a rectangle for the daily range
         create_Line(UPPER_LINE_PREFIX+TimeToString(midnight),midnight,maximum_price,sixAM,maximum_price,3,clrBlack,DoubleToString(maximum_price,_Digits)); //--- Draw upper range line
         create_Line(LOWER_LINE_PREFIX+TimeToString(midnight),midnight,minimum_price,sixAM,minimum_price,3,clrRed,DoubleToString(minimum_price,_Digits));   //--- Draw lower range line

         isHaveDailyRange_Prices = true; //--- Set the flag indicating daily range prices have been extracted
      }
   }

   //--- Get the close price and time of the previous bar
   double barClose = close(1);
   datetime barTime = time(1);

   double Ask = NormalizeDouble(SymbolInfoDouble(_Symbol,SYMBOL_ASK),_Digits);
   double Bid = NormalizeDouble(SymbolInfoDouble(_Symbol,SYMBOL_BID),_Digits);

   //--- Check for upper range breakout condition
   if (barClose > maximum_price && isHaveDailyRange_Prices && !isHaveRangeBreak
       && barTime >= validBreakTime_start && barTime <= validBreakTime_end){
      Print("CLOSE Price broke the HIGH range. ",barClose," > ",maximum_price); //--- Log the breakout event
      isHaveRangeBreak = true; //--- Set the flag indicating a breakout occurred
      drawBreakPoint(TimeToString(barTime),barTime,barClose,234,clrBlack,-1); //--- Draw a point to mark the breakout

      if (direction_of_trade == Default_Trade_Directions){
         obj_Trade.Buy(0.01,_Symbol,Ask,minimum_price,Bid+(maximum_price-minimum_price)*r2r);
      }
      else if (direction_of_trade == Invert_Trade_Directions){
         obj_Trade.Sell(0.01,_Symbol,Bid,Ask+(maximum_price-minimum_price),Ask-(maximum_price-minimum_price)*r2r);
      }
   }
   //--- Check for lower range breakout condition
   else if (barClose < minimum_price && isHaveDailyRange_Prices && !isHaveRangeBreak
            && barTime >= validBreakTime_start && barTime <= validBreakTime_end){
      Print("CLOSE Price broke the LOW range. ",barClose," < ",minimum_price); //--- Log the breakout event
      isHaveRangeBreak = true; //--- Set the flag indicating a breakout occurred
      drawBreakPoint(TimeToString(barTime),barTime,barClose,233,clrBlue,1); //--- Draw a point to mark the breakout

      if (direction_of_trade == Default_Trade_Directions){
         obj_Trade.Sell(0.01,_Symbol,Bid,maximum_price,Ask-(maximum_price-minimum_price)*r2r);
      }
      else if (direction_of_trade == Invert_Trade_Directions){
         obj_Trade.Buy(0.01,_Symbol,Ask,Bid-(maximum_price-minimum_price),Bid+(maximum_price-minimum_price)*r2r);
      }
   }
}

//--- Utility functions to retrieve price and time data for a given bar index
double open(int index){return (iOpen(_Symbol,_Period,index));}   //--- Get the opening price
double high(int index){return (iHigh(_Symbol,_Period,index));}   //--- Get the highest price
double low(int index){return (iLow(_Symbol,_Period,index));}     //--- Get the lowest price
double close(int index){return (iClose(_Symbol,_Period,index));} //--- Get the closing price
datetime time(int index){return (iTime(_Symbol,_Period,index));} //--- Get the time of the bar

//+------------------------------------------------------------------+
//|       FUNCTION TO CREATE A RECTANGLE                             |
//+------------------------------------------------------------------+
void create_Rectangle(string objName, datetime time1, double price1, datetime time2, double price2, color clr) {
   //--- Check if the object already exists by finding it on the chart
   if (ObjectFind(0, objName) < 0) {
      //--- Create a rectangle object using the defined parameters: name, type, and coordinates
      ObjectCreate(0, objName, OBJ_RECTANGLE, 0, time1, price1, time2, price2);

      //--- Set the time for the first point of the rectangle (start point)
      ObjectSetInteger(0, objName, OBJPROP_TIME, 0, time1);

      //--- Set the price for the first point of the rectangle (start point)
      ObjectSetDouble(0, objName, OBJPROP_PRICE, 0, price1);

      //--- Set the time for the second point of the rectangle (end point)
      ObjectSetInteger(0, objName, OBJPROP_TIME, 1, time2);

      //--- Set the price for the second point of the rectangle (end point)
      ObjectSetDouble(0, objName, OBJPROP_PRICE, 1, price2);

      //--- Enable the fill property for the rectangle, making it filled
      ObjectSetInteger(0, objName, OBJPROP_FILL, true);

      //--- Set the color for the rectangle
      ObjectSetInteger(0, objName, OBJPROP_COLOR, clr);

      //--- Set the rectangle to not appear behind other objects
      ObjectSetInteger(0, objName, OBJPROP_BACK, false);

      //--- Redraw the chart to reflect the new changes
      ChartRedraw(0);
   }
}
//+------------------------------------------------------------------+
//|      FUNCTION TO CREATE A TREND LINE                             |
//+------------------------------------------------------------------+
void create_Line(string objName, datetime time1, double price1, datetime time2, double price2, int width, color clr, string text) {
   //--- Check if the line object already exists by its name
   if (ObjectFind(0, objName) < 0) {
      //--- Create a trendline object with the specified parameters
      ObjectCreate(0, objName, OBJ_TREND, 0, time1, price1, time2, price2);

      //--- Set the time for the first point of the trendline
      ObjectSetInteger(0, objName, OBJPROP_TIME, 0, time1);

      //--- Set the price for the first point of the trendline
      ObjectSetDouble(0, objName, OBJPROP_PRICE, 0, price1);

      //--- Set the time for the second point of the trendline
      ObjectSetInteger(0, objName, OBJPROP_TIME, 1, time2);

      //--- Set the price for the second point of the trendline
      ObjectSetDouble(0, objName, OBJPROP_PRICE, 1, price2);

      //--- Set the width for the line
      ObjectSetInteger(0, objName, OBJPROP_WIDTH, width);

      //--- Set the color of the trendline
      ObjectSetInteger(0, objName, OBJPROP_COLOR, clr);

      //--- Set the trendline to not be behind other objects
      ObjectSetInteger(0, objName, OBJPROP_BACK, false);

      //--- Retrieve the current chart scale
      long scale = 0;
      if(!ChartGetInteger(0, CHART_SCALE, 0, scale)) {
         //--- Print an error message if unable to retrieve the chart scale
         Print("UNABLE TO GET THE CHART SCALE. DEFAULT OF ", scale, " IS CONSIDERED");
      }
      //--- Set a default font size based on the chart scale
      int fontsize = 11;
      if (scale == 0) { fontsize = 5; }
      else if (scale == 1) { fontsize = 6; }
      else if (scale == 2) { fontsize = 7; }
      else if (scale == 3) { fontsize = 9; }
      else if (scale == 4) { fontsize = 11; }
      else if (scale == 5) { fontsize = 13; }

      //--- Define the description text to appear near the right price
      string txt = " Right Price";
      string objNameDescr = objName + txt;

      //--- Create a text object next to the line to display the description
      ObjectCreate(0, objNameDescr, OBJ_TEXT, 0, time2, price2);

      //--- Set the color for the text
      ObjectSetInteger(0, objNameDescr, OBJPROP_COLOR, clr);

      //--- Set the font size for the text
      ObjectSetInteger(0, objNameDescr, OBJPROP_FONTSIZE, fontsize);

      //--- Anchor the text to the left of the line
      ObjectSetInteger(0, objNameDescr, OBJPROP_ANCHOR, ANCHOR_LEFT);

      //--- Set the text content to display the specified string
      ObjectSetString(0, objNameDescr, OBJPROP_TEXT, " " + text);

      //--- Set the font of the text to "Calibri"
      ObjectSetString(0, objNameDescr, OBJPROP_FONT, "Calibri");

      //--- Redraw the chart to reflect the changes
      ChartRedraw(0);
   }
}

bool isNewBar() {
   //--- Static variable to hold the previous number of bars
   static int prevBars = 0;

   //--- Get the current number of bars on the chart
   int currBars = iBars(_Symbol, _Period);

   //--- If the number of bars hasn't changed, return false
   if (prevBars == currBars) return (false);

   //--- Update the previous bar count with the current one
   prevBars = currBars;

   //--- Return true if a new bar has been formed
   return (true);
}

bool isNewDay() {
   //--- Flag to indicate if a new day has started
   bool newDay = false;

   //--- Structure to hold the current date and time
   MqlDateTime Str_DateTime;

   //--- Convert the current time to a structured format
   TimeToStruct(TimeCurrent(), Str_DateTime);

   //--- Static variable to store the previous day
   static int prevDay = 0;

   //--- Get the current day from the structured time
   int currDay = Str_DateTime.day;

   //--- If the previous day is the same as the current day, we're still on the same day
   if (prevDay == currDay) {
      newDay = false;
   }
   //--- If the current day differs from the previous one, we have a new day
   else if (prevDay != currDay) {
      //--- Print a message indicating the new day
      Print("WE HAVE A NEW DAY WITH DATE ", currDay);

      //--- Update the previous day to the current day
      prevDay = currDay;

      //--- Set the flag to true, indicating a new day has started
      newDay = true;
   }

   //--- Return whether a new day has started
   return (newDay);
}
//+------------------------------------------------------------------+
//|       FUNCTION TO CREATE AN ARROW                                |
//+------------------------------------------------------------------+
void drawBreakPoint(string objName, datetime time, double price, int arrCode, color clr, int direction) {
   //--- Check if the arrow object already exists on the chart
   if (ObjectFind(0, objName) < 0) {
      //--- Create an arrow object with the specified time, price, and arrow code
      ObjectCreate(0, objName, OBJ_ARROW, 0, time, price);

      //--- Set the arrow's code (symbol)
      ObjectSetInteger(0, objName, OBJPROP_ARROWCODE, arrCode);

      //--- Set the color for the arrow
      ObjectSetInteger(0, objName, OBJPROP_COLOR, clr);

      //--- Set the font size for the arrow
      ObjectSetInteger(0, objName, OBJPROP_FONTSIZE, 12);

      //--- Set the anchor position for the arrow based on the direction
      if (direction > 0) ObjectSetInteger(0, objName, OBJPROP_ANCHOR, ANCHOR_TOP);
      if (direction < 0) ObjectSetInteger(0, objName, OBJPROP_ANCHOR, ANCHOR_BOTTOM);

      //--- Define a text label for the break point
      string txt = " Break";
      string objNameDescr = objName + txt;

      //--- Create a text object for the break point description
      ObjectCreate(0, objNameDescr, OBJ_TEXT, 0, time, price);

      //--- Set the color for the text description
      ObjectSetInteger(0, objNameDescr, OBJPROP_COLOR, clr);

      //--- Set the font size for the text
      ObjectSetInteger(0, objNameDescr, OBJPROP_FONTSIZE, 12);

      //--- Adjust the text anchor based on the direction of the arrow
      if (direction > 0) {
         ObjectSetInteger(0, objNameDescr, OBJPROP_ANCHOR, ANCHOR_LEFT_UPPER);
         ObjectSetString(0, objNameDescr, OBJPROP_TEXT, " " + txt);
      }
      if (direction < 0) {
         ObjectSetInteger(0, objNameDescr, OBJPROP_ANCHOR, ANCHOR_LEFT_LOWER);
         ObjectSetString(0, objNameDescr, OBJPROP_TEXT, " " + txt);
      }
   }
   //--- Redraw the chart to reflect the new objects
   ChartRedraw(0);
}
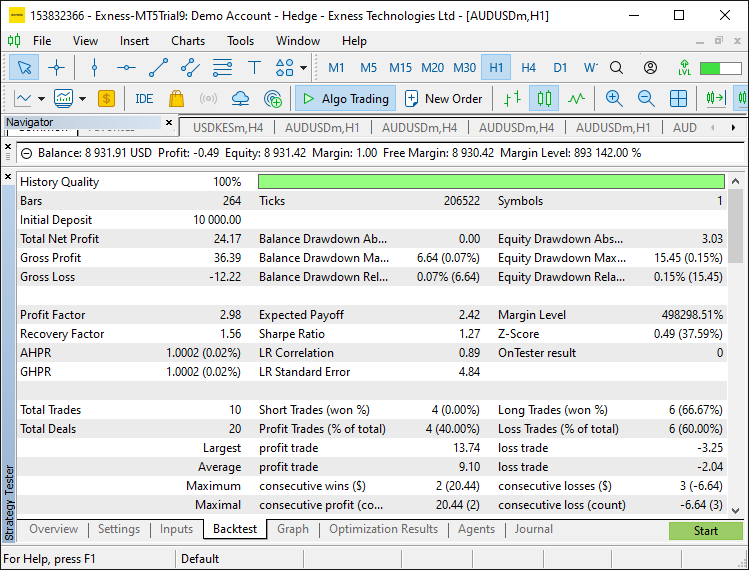
Backtest Results:
Backtest Graph:
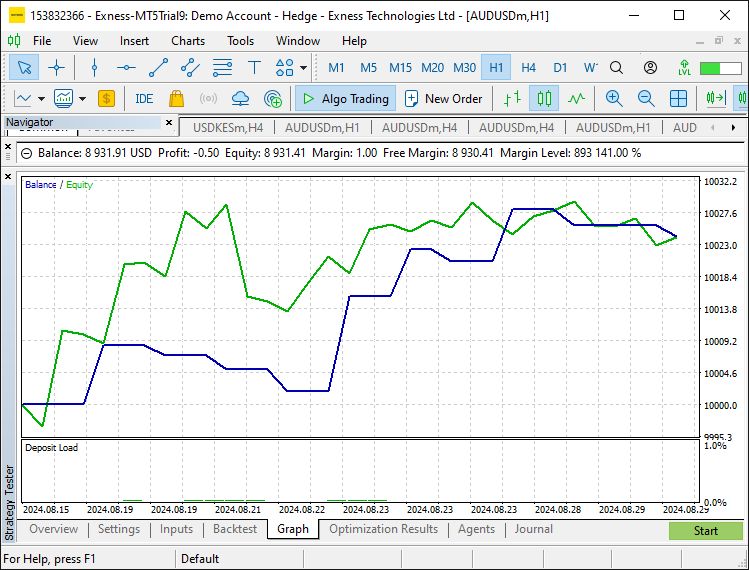
We optimized the input parameters and verified the strategy's performance with the strategy tester during this testing phase. The adjustments that we made to the input parameters gave the trading strategy more flexibility. We've confirmed that the strategy works as intended and achieves favorable results when we backtest and optimize it.
Conclusion
To sum up, this article laid out a step-by-step, in-depth approach to creating an Expert Advisor in MQL5 that trades the daily range breakout. We started with the essential parts that give the EA the ability to compute daily price ranges and set the breakout levels. These are key to determining the times just before and just after when the price might be expected to break out of its range for the day.
We additionally examined how to implement various MQL5 functions that keep an eye on market conditions, do the necessary price comparisons, and then take the required actions to execute a trade right at the moment when a breakout happens. To assist traders in quickly seeing the key levels necessary for this strategy, we added some visual tools—rectangles and trendlines—to the chart. We made sure that when we programmed the tools, they were reasonably flexible, as the strategy requires a fair amount of input parameter adjustability.
The strategy was tested using MetaTrader 5's Strategy Tester, which allowed us to assess its performance and make adjustments so that it would run even better in our trading conditions. Happy coding and successful trading!
 How to integrate Smart Money Concepts (OB) coupled with Fibonacci indicator for Optimal Trade Entry
 Integrating MQL5 with data processing packages (Part 3): Enhanced Data Visualization
 How to Create an Interactive MQL5 Dashboard/Panel Using the Controls Class (Part 2): Adding Button Responsiveness
 MQL5 Wizard Techniques you should know (Part 43): Reinforcement Learning with SARSA
- Free trading apps
- Over 8,000 signals for copying
- Economic news for exploring financial markets
You agree to website policy and terms of use
It looks like a well-known "Morning Flat Breakout", not a "Daily Range Breakout" (which is different), so the title is misleading.
Also I did not see a code for time-zone handling, because depending from your server GMT offset, the "morning flat" which defines the range for breakout, should be tracked starting not from a midnight 00:00 necessarily, but with the offset.
Thanks for the reply. That depends on the strategy one uses. In our case, it is the Daily Range Breakout, essentially running from midnight to 6 AM, which can ofcourse be adjusted. Thanks.