适用于MetaTrader 5的新技术指标

购买该指标的每位用户将额外免费获得以下内容:
原创工具“Bomber Utility”,该工具会自动跟踪每一笔交易,设置止损和止盈点,并根据策略规则自动平仓; 适用于不同交易品种的指标设置文件(Set 文件); 三种不同风险模式下的 Bomber Utility 设置文件:“最低风险”、“平衡风险” 和 “观望策略”; 一套详细的 视频操作手册,帮助您快速完成安装、配置并开始使用本交易系统。 注意: 要获取以上所有赠品,请通过 MQL5 的私人消息系统联系卖家。 我为您介绍原创的自定义指标 “Divergence Bomber”(背离轰炸机),它是一套基于 MACD 背离交易策略 的“全功能”交易系统。
该技术指标的主要任务是识别 价格与 MACD 指标之间的背离,并发出交易信号(包括推送通知),指示未来价格可能的运动方向。平均而言,这些信号的准确率超过 98%。有关该指标如何工作的详细说明,请观看本页面上的视频演示。 该系统使用 止损订单 和 动态回撤平仓机制 来管理交易。 Divergence Bomber 指标的主要特点: 支持交易的品种: AUDCAD、AUDCHF、AUDSG

RSI ABCD形态查找器:技术策略 1. 指标工作原理 结合 经典RSI 与自动检测 ABCD谐波形态 。 主要组件 标准RSI (可调周期) 高低点标记 (箭头) ABCD形态 (绿/红线) 超买(70)和超卖(30)过滤器 2. MT5设置 period = 14 ; // RSI周期 size = 4 ; // 最大形态尺寸 OverBought = 70 ; // 超买水平 OverSold = 30 ; // 超卖水平 Filter = USE_FILTER_ YES ; // 确认过滤器 3. 交易策略 3.1. 买入信号(看涨ABCD) 条件: RSI形成: 低点( A ) → 高点( B ) → 更高低点( C ) D 高于超卖区(30)但低于 C 确认:绿色连线A-B-C-D 目标: TP1: B-C的61.8% TP2: B-C的100% 止损: 低于 D 3.2. 卖出信号(看跌ABCD) 条件: RSI形成: 高点( A ) → 低点( B ) → 更低高点( C ) D 低于超买区(70)但高于 C 确认:红色连线A-B-C-D 目标: TP1: B-C的6
FREE

# Wave Trend Oscillator (WTO) User Guide
## Overview Wave Trend Oscillator is a powerful technical analysis tool used to analyze price momentum and trend direction. It visualizes market conditions using two main lines (WT1 and WT2) and a histogram.
## Components 1. **WT1 (Green Line)**: Main trend indicator 2. **WT2 (Red Line)**: Signal line 3. **Histogram (Blue)**: Shows the difference between WT1 and WT2 4. **Arrows**: Mark crossover points - Green Arrow: WT1 crosses above WT2 (Buy signa
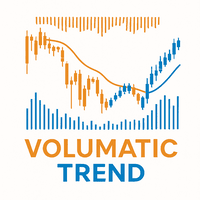
Volumatic Trend is a powerful, trend-following indicator that merges directional analysis with real-time volume behavior. By combining adaptive trend logic and volume overlays, it gives traders a detailed snapshot of market conviction and potential turning points. From instant trend shift detection to volume-weighted candle visuals, this tool brings deeper context to price movement. MT4 Version - https://www.mql5.com/en/market/product/136210/ Join To Learn Market Depth - https://www.mql5.co
FREE

Speed Scalp Indicator – NON-Repaint
The Ultimate Tool for Fast and Precise Scalping
Perfect for Gold (XAUUSD) & Lower Timeframes The Speed Scalp Indicator is a powerful, non-repainting trading tool specifically engineered for scalpers who thrive on speed, precision, and high-frequency entries. Tailored for timeframes 30 minutes and below , this indicator is especially optimized for Gold (XAUUSD) , making it an essential companion for traders focusing on volatile instruments and rapid

I am a trader specializing in the development of rare , exclusive , high-performance trading bots designed for serious traders who are committed to achieving consistent profitability and success. This free indicator is more than just a visual tool—it powers the Midnight Throttle EA , an automated trading system that executes trades based on the precise market conditions this indicator observes. Midnight Watch : A Pro-Level Tool for Precision Market Analysis. An advanced , multi-functional MetaTr
FREE
“这个被道具公司禁止使用的秘密交易工具(他们不想让你知道!)”
发现终极交易优势--无需 EA!(由交易者为交易者打造,不是机器人,而是纯粹的交易力量!)
在假突破、突然反转或市场操纵中挣扎?这款功能强大的交易工具即使在市场快速波动时也能为您提供激光般精确的信号--帮助您像专业人士一样发现高概率入口! ---------------------------------------------------------------------------------------------------
我的推荐:- 最佳信号强度设置(特别针对黄金版)
选择您想要的 TF 并在返回测试前从输入选项卡中更改信号值
(5) 仅适用于 1 分钟时间框架
(3) 15m / 30m / 1H / 4H
(2) 用于日线/周线/月线 ---------------------------------------------------------------------------------------------------
UZFX-Alpha Strike Signals

多时间框架 K 线 指标是一款强大的可视化工具,旨在帮助交易者将较低时间框架的分析与较高时间框架的结构相结合。该指标可直接在当前图表上绘制所选较高时间框架(1 小时、4 小时、1 天等)的 K 线图,让您无需切换图表即可更清晰地了解整体市场走势。
谁需要这个指标? 此工具非常适合: 智能货币概念 (SMC) / ICT 交易者依赖较高的时间框架偏差,同时在较低的时间框架上执行交易。 黄牛和日内交易者希望与每日或时段的动量保持同步。 想要快速浏览 HTF 结构同时在较小图表上细化条目的波段交易者。
无论您交易的是价格行为、供需还是趋势跟踪系统,该指标都能确保您的入场得到更高时间范围的强度支持。
策略改进 多时间框架蜡烛图有助于改善: 方向偏差确认——与主导趋势或市场结构保持一致。 精炼入场点——确定最佳入场区域(例如,5M 图上的看涨日线图内)。 假突破过滤——仅按照 HTF 蜡烛的方向进行交易,以避免陷阱。 HTF 流动性意识——从更高的时间范围内发现潜在的灯芯和反应区。
主要特点: 选择任意更高的时间范围进行覆盖。 自定义蜡烛颜色、边框和填充设置。 将 MTF 蜡烛显示在常
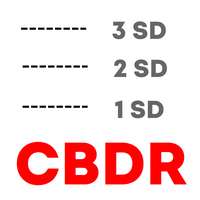
Haven CBDR 是一个易于使用的指标,可在图表上显示 ICT “中央银行交易商区间”(CBDR)。该程序绘制矩形,标示 CBDR 价格区间,并显示额外的标准差线,以评估可能的支撑和阻力水平。产品允许自定义 CBDR 的时间区间、显示的日历天数、图形元素的颜色和样式,并根据图表主题自动调整配色方案。此外,指标还会绘制垂直线,标示每日蜡烛图的开盘,有助于掌握市场动态。 其他产品 -> 点击这里 交易者如何使用: 参数设置:
如有需要,可调整会话的开始和结束时间,并自定义显示参数(颜色、矩形边框样式、标准差线和标记)。 区间分析:
使用显示的矩形快速评估所选期间内的 CBDR 价格区间。标准差线有助于确定潜在的反转或延续水平。 寻找交易信号:
每日蜡烛开盘的垂直线和区间信息,为交易者提供更多参考,帮助确定进出场位置,从而更好地与机构资金动向同步。 这款工具适合希望在交易会话内清晰掌握价格区间,并基于客观图表分析优化策略的交易者。
FREE
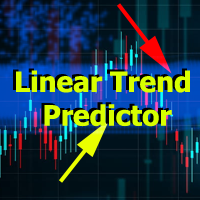
Linear Trend Predictor — 结合切入点和方向支撑线的趋势指标。按照突破高/低价通道的原理运作。该指标算法过滤市场噪音,考虑波动性和市场动态。
指示器功能
使用平滑方法,显示市场趋势和开立买入或卖出订单的切入点。 适合通过分析任何时间范围内的图表来确定短期和长期的市场走势。 输入参数可适应任何市场和时间范围,允许交易者独立定制指标。 设定的指示信号不会消失,也不会重新绘制——它是在蜡烛收盘时确定的。 几种类型的通知以箭头组合。 该指标既可以作为独立的交易系统使用,也可以作为其他交易系统的补充。 可供任何经验水平的交易者使用。
主要参数
Volatility Smoothing Level - 指标的主要参数,允许您配置指标以实现舒适的操作。
它的数字范围是 1 到 100,从而增加了您可以获得更长趋势运动的平滑度。
通过少量的数字,您可以获得短期走势并快速退出交易。
使用指标进行交易的时刻:
红线和箭头表示下降趋势和卖出开盘信号。止损应根据前一个上分形来设置。 黄线和箭头表示上升趋势和买入开盘信号。止损应根据前一个下分形来设置。

蜡烛成交量强度是一种先进的成交量分析指标,可洞察买卖双方之间的持续竞争。它计算并可视化实时成交量变化,帮助交易者更准确地确认突破、趋势、回撤和反转。
主要特点: 基于成交量的确认—— 该指标监控成交量变化,并在市场力量在买家和卖家之间转移时发出警报。 趋势和突破验证—— 通过分析交易量分布,交易者可以确认市场趋势和突破信号的强度。 反转和回撤检测—— 成交量模式有助于识别价格走势中的潜在转折点。 支撑和阻力洞察—— 关键水平附近的成交量增加增强了对其可靠性的信心。 简单有效的可视化—— 以直方图形式显示买卖强度,以便于解释。 蜡烛图成交量强度可帮助交易者利用成交量分析确认市场走势,从而做出明智的决策。在突破期间,高交易量表明市场参与度高,从而增强了突破信号的有效性并降低了错误动作的可能性。理解趋势强度变得更容易,因为上升趋势中成交量的增加证实了持续的购买压力,而下降趋势中成交量的增加表明强劲的卖出活动,为交易者提供了对趋势延续的更大信心。此外,该指标通过识别价格变动和成交量活动之间的差异来帮助发现潜在的趋势逆转。例如,如果价格继续上涨而成交量下降,则可能表明趋势减弱并可能出现逆转。
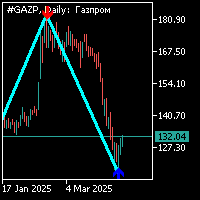
之字形指示器是标准的,周期为34,带有额外的箭头信号。 附加信号与之字形指示器分开计算。该指标的工作如下:1。 当形成之字形指示器的一段并且附加信号以箭头的形式出现时,您需要在箭头的方向上打开一个位置;2。 当zig-zag指示器的另一个臂在与前一个臂的顶部的附加信号(箭头)相反的方向上形成时,就可以建立一个挂单的位置。 在形成与附加信号(箭头)相反的锯齿形肩之后,您可以添加到之前的打开位置或将止损移动到这个水平;4. 如果您以保守的交易模式进行交易,则无法在价格走势的第一次回调之前开设额外的头寸;5。 为了准确地进入市场,您可以等待zig-zag指标段的形成和高级时间框架上的额外信号的出现,同时在距离未平仓头寸不超过40点的位置放置止损。 6. 在您为交易添加了额外的头寸后,未平仓头寸的止损应保持在相同的价格水平,如果头寸在止损处关闭,那么您将以平均值获利;7。 止损,建议在下一个价格回调形成后重新排列(指标的一段将形成之字形朝向附加信号(箭头))。 8. 如果在之字形段形成后,一个额外的信号以箭头的形式出现在你交易的时间框架上,所有的开放头寸都被关闭 9. 在高度波动的金融市场中,

FREE
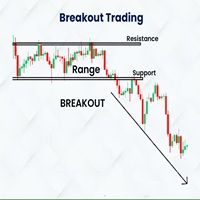
Indicador Basado en la estrategia de ruptura del rango de londres de Amaury Benedetti.
Este indicador dibuja automaticamente el rango, el maximo y minimo y sus correspondientes lineas de stoploss, entrada y takeprofit.
SE RECOMIENDA USAR EN M1 EN EL US30 (DE ACUERDO A LA ESTRATEGIA)
Los valores se pueden modificar de acuerdo a la necesidad del usuario, tambien se tienen mas configuraciones para dibujar cualquier rango en diversos horarios y con diferentes configuraciones de sl, tp, etc
Detal
FREE

What is Linear Regression? Linear regression is a statistical method used to model the relationship between price and time. In forex trading, it helps traders identify trends, potential reversals, and areas of support and resistance. Uses of Linear Regression in Forex Trading Trend Identification The regression line acts as a dynamic trendline, showing whether the market is trending upward or downward. Traders can use the slope of the regression line to measure trend strength. Support and Resist

Zero Lag EMA Indicator (AI-Optimized) – Professional Trading Tool Enhance your trading accuracy with the Zero Lag EMA Indicator — a next-generation solution designed to eliminate the delay of traditional moving averages. Powered by AI-optimized algorithms, this tool delivers lightning-fast market insights, helping you stay ahead of price action. Key Features: AI-Enhanced Speed : Virtually no lag. Detects trend shifts and momentum changes with exceptional speed. Market Versatility : Ideal for For
FREE

Introduction! to the Indicator that Connects Trend , Pattern , and Candlestick Trigger 3 Steps in Under 30 Seconds ️ Trade effortlessly — no analysis required, Your smart assistant is ready to simplify your workflow No more chart overload Trade with confidence using smart bias detection Compatible with all currencies, crypto, stocks, metals, indices, and any timeframe Just click and execute — it’s that simple Ideal for busy traders who want speed and clarity. TPTSyncX is a powerfu

Overview The TTM Squeeze indicator helps identify low volatility periods (squeeze) that often precede price breakouts. It uses Bollinger Bands (BB) and Keltner Channels (KC) to determine when the market is "coiling" and ready to move. Configuration Guide Volatility Settings The indicator uses Bollinger Bands to measure market volatility. When BBs are inside Keltner Channels, a squeeze is detected. The squeeze suggests the market is consolidating and may soon break out. True Range Option Optional
FREE

MACD Scalper Zero Lag is a fast, accurate, and reliable indicator designed to give traders the real-time edge they need. By eliminating the lag found in traditional MACD indicators, it delivers instantaneous divergence alerts on both forex and cryptocurrency markets. With its robust algorithm and user-friendly interface, this tool not only detects early trend reversals but also provides clear and actionable signals. The indicator offers customizable settings so that you can adjust sensitivity a

MT4 version Overview The Lowess Channel indicator is a smoothed trend-following tool designed to help traders identify the direction of the trend , detect flat or ranging markets , and spot breakouts from consolidation zones. It creates a central smoothed line with upper and lower channel boundaries, adapting to market noise while maintaining clarity. How It Works The indicator builds a channel around a smoothed price line. The central line reflects the current trend. The upper and lower bounda
FREE
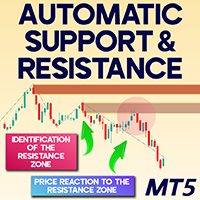
Automatic Support & Resistance Indicator for MT5
The Automatic Support & Resistance Indicator for MT5 is a sophisticated tool tailored for MetaTrader 5 users, engineered to systematically highlight significant support and resistance price zones. It marks support levels using green shades (dark green for newly formed zones, light green once retested) and resistance areas in brown tones (starting with dark brown and lightening after confirmation), offering traders visual clarity in identifying cri
FREE
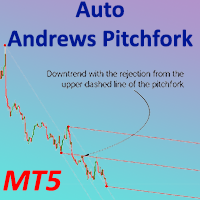
Auto Andrews Pitchfork indicator MT5
The Auto Andrews Pitchfork indicator MT5 is a specialized technical tool on the MetaTrader 5 platform that automatically plots three equidistant, parallel trendlines by using three selected pivot points (significant highs and lows). These lines serve as evolving zones of support and resistance, providing actionable trade signals when price interacts with them. This tool simultaneously generates two pitchfork patterns—one outlined in dotted lines and the othe
FREE
SyntheticaFX Boom and Crash is a powerful tool designed to highlight potential spike opportunities in the market, exclusively for traders focusing on Crash and Boom indices. This indicator is strictly optimized to operate on the 3-minute (M3) timeframe and supports only the following pairs: Crash 1000 Index , Crash 900 Index , Crash 600 Index , Crash 500 Index , Crash 300 Index , Boom 1000 Index , Boom 900 Index , Boom 600 Index , Boom 500 Index , and Boom 300 Index . It will not display signa
FREE
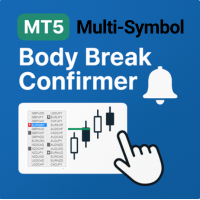
The Body Break Confirmer tracks price breakouts based on previous candle body breaks on H1 and higher timeframes. It is activated instantly by the user for each symbol with a button click. This tool works perfectly for confirming market reversals in any reversal strategy. Unlike standard reversal indicators, it lets the user cherry-pick the symbols they want to track, ensuring only high-quality alerts that match their strategy are issued. Like this tool? Want more flexibility than the aggressiv
FREE
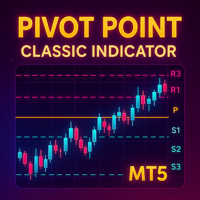
Detailed Description: The Pivot Point Classic Indicator is designed for traders who rely on classic pivot points and midpoints levels for their trading strategies. By automatically calculating and plotting these levels, the indicator provides a clear, visual representation of critical price areas where the market may reverse or break out. Key Features: Automatic Pivot Point Calculations : Automatically calculates pivot points, three support (S1, S2, S3) and resistance (R1, R2, R3) levels bas
FREE

Overview Inspired by Tradingview’s falconCoin, The Market Cipher indicator is a momentum oscillator used to detect overbought/oversold conditions and potential trend reversals. Traders can also use it to spot divergences between price action and momentum for early entry or exit signals. Configuration Guide Core Indicator Settings The indicator calculates momentum using a short-term and a longer-term average. Momentum is plotted as a wave oscillating between overbought and oversold thresholds. Ov
FREE
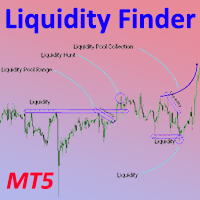
Liquidity Finder Indicator MT5
The Liquidity Finder Indicator MT5 is a specialized tool developed for the MetaTrader 5 platform, created to detect zones of market liquidity. This indicator functions by plotting both fixed and dynamic liquidity levels on the price chart. Blue-colored lines indicate zones of liquidity near recent highs, while red lines mark zones near significant lows. Static lines often align with common chart structures such as Double Bottoms and Double Tops, giving visual clar
FREE

NOTE: CYCLEMAESTRO is distributed only on this website, there are no other distributors. Demo version is for reference only and is not supported. Full versione is perfectly functional and it is supported. CYCLEMAESTRO , the first and only indicator of Cyclic Analysis, useful for giving signals of TRADING, BUY, SELL, STOP LOSS, ADDING. Created on the logic of Serghei Istrati and programmed by Stefano Frisetti ; CYCLEMAESTRO is not an indicator like the others, the challenge was to inter
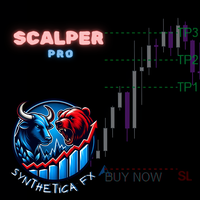
SyntheticaFX Scalper Pro 指标
SyntheticaFX Scalper Pro 指标是一款多功能且用户友好的工具,旨在帮助交易者在多种时间框架和所有货币对中识别高精度的入场点。该指标在图表上提供清晰的视觉信号,并附带推荐的止损(SL)和止盈(TP)水平,使交易者能够更自信地规划交易。其内置仪表板提供实时交易统计数据,帮助交易者监控表现并做出明智决策。 主要功能 多时间框架兼容性 :无缝适用于多种时间框架,包括 M5、M10、M15、M30、H1、H4 和 D1,为不同交易风格提供灵活性。 通用应用 :适用于所有货币对,确保交易者可在广泛市场中使用。 高精度信号 :提供可靠的入场信号,注重精度,帮助交易者捕捉潜在市场机会。 推荐的止损和止盈水平 :每个信号都附带根据市场波动性计算的止损和止盈水平,简化交易管理。 视觉提示 :在图表上直接显示清晰的买入和卖出信号,以及止损和止盈线,便于解读。 性能仪表板 :内置仪表板跟踪交易统计数据,如最近指定交易的胜率、亏损次数和胜率百分比。 可定制设置 :提供多种可调整输入选项,允许交易者根据个人偏好定制指标。 用户友好设
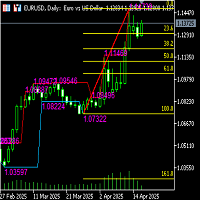
自动斐波那契线指标(含高低通道线)功能说明 功能简介 本指标结合自动识别的波段高低点,自动绘制斐波那契回撤/扩展线,并配合绘制当前分析区间的最高价与最低价通道线,为交易者提供更清晰的支撑/阻力参考与趋势分析依据。 主要功能 自动波段识别 程序根据预设算法Fractal 高低点)识别关键波段; 选取最近一个明显高点与低点作为绘制基础; 无需手动干预,自动更新。 斐波那契回撤/扩展线绘制 自动计算以下常用比例:0%、23.6%、38.2%、50%、61.8%、100%、161.8% 等; 对每一水平绘制水平参考线,标注数值; 高低通道线绘制 在选定的计算区间内自动绘制“最高价线”和“最低价线”价格标签; 显示当前区间内的价格通道宽度,便于判断价格是否处于突破/震荡阶段。 自动更新与多周期适配 指标随行情自动刷新; 可用于任何时间周期(如1分钟至周线); 保持图表整洁,适应短线与波段策略。 图表友好设置 支持自定义线条颜色、透明度、样式; 技术参数 区间长度: 指定显示价格标签K线数量 应用场景 趋势行情中预测回调/反弹区; 判断价格是否突破关键比例位; 配合价格通道识别震荡
FREE
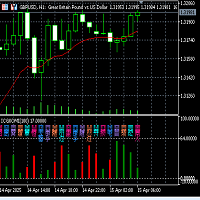
伏羲卦象双色震荡指示器功能及使用说明(V2.1) 伏羲卦象双色震荡指示器指标说明: (1)本卦象变化指标是根据中国古代文化中"易经"哲学的阴阳转化思想,融合金融交易K线图每一蜡烛图K线周期多空相互博弈的结果,用中国最古老的预测编码方法,以易经伏羲64卦象的形式,将卦象的每一爻的阴阳和蜡烛K线图的阴阳结合在一起,实时绘制在交易图表子窗口的每一根K线图的下方, 以表示未来的K线的走向趋势。 (2)指标在子窗口的左上侧只显示当前蜡烛K线所对应的卦数,非当前K线的卦象指标是在K线的每个蜡烛下方标注了对应的卦名。 (3)本指标同时又将主图中卦象的变化,再以卦数双色柱状图在子窗口绘制,更直观地标示每根蜡烛K线对应的卦象的形态变化,预示未来的可能走向. (3)本指标的重大创新意义: a:突破传统的三根或者两根K线的组合预测,而是用六根K线的组合装成卦象进行多空的预示。通过卦象的变化,交易者一定会有全新的交易灵感. B:与单纯的主图卦象指标不同,本指标的特点,直观且易于交易者实现报警提醒或者以此指标的信号进行EA交易系统的开发. (4)本指标适合所有时间框架.卦名卦象随K线的变化自动更新。 (5
FREE
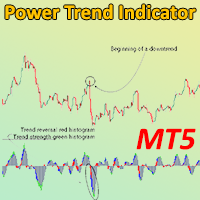
Power Trend Indicator for MetaTrader 5 The Power Trend Indicator for MetaTrader 5 is a dynamic trading utility designed to help traders pinpoint both the direction and momentum of ongoing market trends. This oscillator uses a color-coded histogram to visually represent trend strength. A red bar signifies a trend shift, blue indicates mild trend activity, green denotes strong momentum, and black reflects a flat or indecisive market. It's particularly useful for spotting trend reversals and rapid
FREE
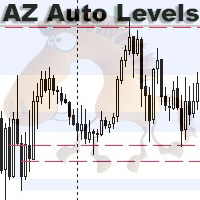
AZ Auto Levels builder ATR edition Indicator of automatic level drawing. For different instruments you need to play with the parameters to find the right ones. So, what is its idea - the indicator searches for levels of interest on the timeframe selected in the settings (by default H1). The search occurs only on candles that are 30% greater than the standard daily ATR of similar candles (you can change this in the settings). ATR is calculated for 20 days ago (also can be changed in the settings)
FREE
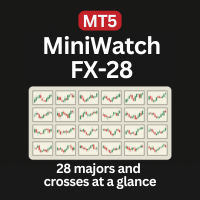
Monitor all 28 Forex pairs at once — clean mini charts, real-time price action, perfect for consistent price pattern traders. Designed for consistent, mechanical, and hybrid traders who repeatedly trade the same price action patterns — such as triangles, flags, trends, and supply/demand zones — across multiple symbols, without relying on indicators.
Core Features: Displays all 28 major Forex pairs in mini chart format , organized in a clean 4-row by 7-column layout. Powered by live price action
FREE
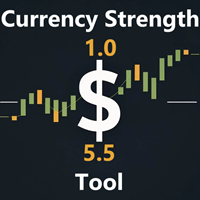
" Currency Strength Tool " is a straightforward and user-friendly indicator designed for analyzing the strength of eight major currencies based on daily price changes of currency pairs. It displays information compactly on the chart in three rows, providing traders with insights into current market dynamics. The indicator serves as an analytical tool, aiding in making informed trading decisions.
It appears as follows: -7.3% 0.5% 0.2% 6.4% 1.2% 3.2% 4.1% 0.4% (daily change) USD E
FREE
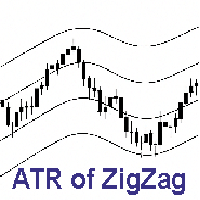
ZigZag Channel Indicator – A Simple Way to Read Market Structure! This indicator automatically calculates the average distance of ZigZag waves and draws a visual channel:
The upper line reflects the average distance of upward waves.
The lower line reflects the average distance of downward waves. Instantly understand market rhythm and price swings.
Use it to identify targets, exits, reversals, and false breakouts.
Perfect for trend analysis, pattern recognition, and measuring move str
FREE
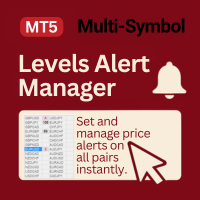
Levels Alert Manager (Beta) is a fast, user-friendly tool for placing and managing price alerts across multiple symbols — ideal for consistent, mechanical, and hybrid trading.
It provides a user-friendly, time-saving alternative to MetaTrader’s default alert system, which can be inefficient and clunky. The process is simple: click the + button, and drag the alert line to the desired level. All alerts are tracked in the panel, displaying live distance to price, with instant notifications trigg
FREE
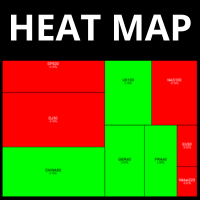
Dynamic Heatmap for MetaTrader 5 — Instantly Spot Market Opportunities Revolutionize the way you see the markets with the most complete and intelligent Heatmap for MetaTrader 5. Designed for traders who demand speed and clarity in decision-making, our Heatmap creates a powerful visual representation of market performance in real time. Key Benefits Instant Read of Market Strength Instantly see which assets are leading or lagging. Dynamic color coding for quick identification: green for ri
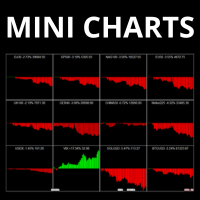
Your market overview, now crystal clear. With our Mini Charts Indicator for MetaTrader 5 , you’ll have the power of multiple charts inside a single, ultra-clean workspace. No more switching between assets or opening dozens of charts. Our Mini Charts give you instant visual snapshots of multiple markets — all in real time. Each mini chart displays the price action of the selected asset, showing whether it’s trending up or down, giving you immediate market sentiment at a glance. Whether you’re mon

# Weekly & Daily Stochastic Signal Indicator User Guide
## Overview This indicator combines the Stochastic oscillator on weekly and daily timeframes to generate strong trading signals. It aims to create more reliable signals by tracking momentum changes across different timeframes.
## Parameters - **ShortPeriod (14)**: Daily Stochastic period - **ShortPeriodSMA (3)**: Daily Stochastic SMA period - **LongPeriod (70)**: Weekly Stochastic period - **LongPeriodSMA (3)**: Weekly Stochastic SMA per

This scanner is based on the Bill Williams Awesome Oscillator (AO) indicator and is designed for faster analysis of financial instruments. The chart shows five vertical columns, which includes a financial instrument that meets certain criteria. The first column shows financial instruments with a strong trend, namely when the AO indicator is above the zero line on three time frames. If there is a strong downward trend in the market, then such instruments will fall into the fifth column. The seco
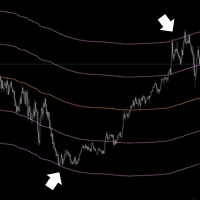
Elevate Your Trading with Advanced Anchored Volume Weighted Average Price Technology Unlock the true power of price action with our premium Anchored VWAP Indicator for MetaTrader 5 - the essential tool for precision entries, strategic exits, and high-probability trend continuation setups. Write me a DM for a 7 day free trial. Anchored VWAP Plus gives traders unprecedented control by allowing custom anchor points for Volume Weighted Average Price calculations on any chart. With support for 4 sim
Этот элегантный индикатор превращает ваш график в многослойную аналитическую панель, визуализируя ключевые уровни старшего таймфрейма прямо на текущем периоде. Идеальное решение для трейдеров, ценящих контекст и четкие структурные уровни. Ключевые особенности: Автоматическая синхронизация с выбранным старшим таймфреймом (M1-MN1) Двойные динамические линии открытия/закрытия каждого бара старшего ТФ Интеллектуальная цветовая схема: Ярко-зеленый для бычьих баров Алый красный для медв
FREE

VolumeView – Индикатор тиковых объёмов Описание: VolumeView — это визуальный индикатор, отображающий тиковые объёмы непосредственно на графике в виде горизонтальных линий разной длины. Цвет линии указывает направление свечи: Зелёный — объём на бычьей свече (цена закрытия выше открытия) Красный — объём на медвежьей свече (цена закрытия ниже открытия) Особенности: Отображает объёмы за определённое количество последних дней Поддерживает настройку минимального порога отображаемого объёма Рабо
FREE
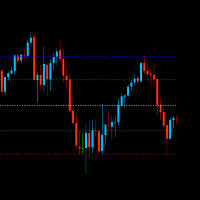
Top and bottom indicator, with the freedom to choose the initial bar and graphic time to be used for calculation regardless of the time frame of the current chart. It also plots mid-range and 23% retracement lines. Good indicator of market strength and current direction of price movement. Also with total freedom of configuration of line types and colors for each line of the indicator. It also has an indicator of the time to bar and open balance in the asset.
FREE
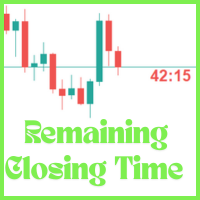
The Candle Remaining Closing Time indicator displays the amount of time left before the current candlestick closes on your chart. This tool is essential for traders who rely on precise timing to enter or exit trades, especially in fast-moving markets. By showing a real-time countdown, it helps you stay aware of upcoming candle completions across any timeframe—from 1-minute to daily charts. Whether you're a scalper watching minute-by-minute action or a swing trader timing key setups on higher tim
FREE
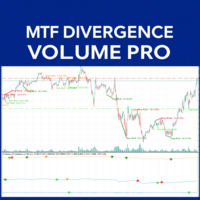
Divergence MTF Volume Pro: Your Ultimate Edge in the Market
Have you ever felt that the market takes you by surprise? Would you like a tool that anticipates possible turns and provides clearer signals for entering or exiting trades? Introducing Divergence MTF Volume Pro! Imagine seeing when price and volume (the force behind movements) start to contradict each other. This, known as divergence, is one of the most powerful signals indicating a potential trend reversal or strong continuation. Our

Dynamic Levels Marker is a smart MT5 indicator that automatically detects and plots three support and three resistance levels using a tiered historical analysis. Levels are visually distinct, labeled, and adapt as price evolves.
Key Features:
Dynamic multi-level support/resistance zones
Tiered logic based on recent price action
Customizable alerts (popup, sound, push notifications)
Clean visual lines with auto-positioned labels
Lightweight and easy to use on any timeframe
Whether you’re

Simple Candle Timer
Overview: The Simple Candle Timer is a simple, yet powerful, tool for traders who want to stay informed about the time remaining until the next candle appears on their chart. Whether you are trading on minute charts or higher timeframes, this indicator ensures you never miss a new candle formation.
Features: Real-Time Countdown Timer: Displays the time left until the current candle closes and a new one starts. The timer updates smoothly every 100 milliseconds for precision

Volume Flow Analyzer The Indicator helps you decode market activity by visualizing real-time volume strength. Whether you're a fast-paced scalper or a patient swing trader , this tool gives you a clearer view of when volume truly supports the price action.
Instructions: Indicator alerts when there is expected increase in volatility by analyzing volumes to allow a trader to prepare. It indicates "High Expected Volatility in such cases", It should be used along with your buy and sell parameters

GoldX PRO is a good trend indicator. The indicator's unique algorithm analyzes the asset price movement, taking into account technical and mathematical analysis factors, determines the most profitable entry points and issues a signal to open a BUY or SELL order. Special offer - https://www.mql5.com/en/users/bossik2810/news
Advantages of the indicator: The indicator produces signals with high accuracy. The confirmed indicator signal does not disappear and is not redrawn - after the signal is co

The Swing High Low and Fibonacci Retracement Indicator is a powerful technical analysis tool designed to identify key price levels and potential reversal zones in the market. It automatically detects recent swing highs and swing lows on the chart and overlays Fibonacci retracement levels based on these points. This indicator helps traders: Visualize market structure by highlighting recent swing points. Identify support and resistance zones using Fibonacci ratios (e.g., 38.2%, 50%, 61.8%). Adapt

The Quasimodo Pattern Indicator is no more difficult than the Head and Shoulders. Still, only a few traders know about it, and some even confuse one with the other. However, this is not a reason to avoid this tool in your forex trading strategy. Features: Automatic Detection: The indicator automatically scans for valid QM patterns across any timeframe, reducing the need for manual chart analysis. Visual Highlights: Clear and customizable on-chart drawing of shoulders, heads, and breakout zones
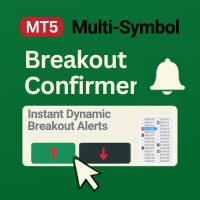
The Breakout Confirmer tracks price breakouts based on a user-selected break methodology and is activated instantly for each symbol separately with a button click. The tool works perfectly for confirming reversal alerts. Unlike standard reversal indicators, it lets the user cherry-pick the symbols they want to track, ensuring only high-quality alerts that match their strategy are issued. No more staring at charts all day. Get alerted only when it truly matters — precisely and consistently. Just

This indicator is converted from Pinescript to MQL5 and consisting of buffers for the range lines as well, its not only object.
The Range Detector indicator aims to detect and highlight intervals where prices are ranging. The extremities of the ranges are highlighted in real-time, with breakouts being indicated by the color changes of the extremities.
USAGE Ranging prices are defined by a period of stationarity, that is where prices move within a specific range.
Detecting ranging marke
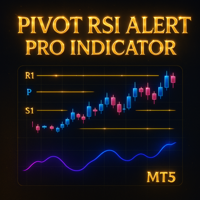
Detailed Description: The Pivot RSI Alert Pro Indicator is a powerful all-in-one indicator that combines five pivot point methods (Classic, Fibonacci, Woodie, Camarilla, DeMark) with a customizable RSI filter. It automatically plots daily pivot levels and midpoints, highlights key reversal zones and sends alerts when price approaches these levels, especially under RSI overbought/oversold conditions. Ideal for intraday and swing traders who rely on dynamic support/resistance and momentum confirm
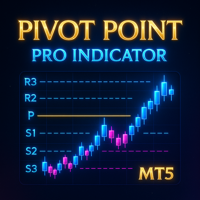
Detailed Description: The Pivot Point Pro Indicator is a powerful all-in-one fully customizable indicator that takes care of five pivot point methods (Classic, Fibonacci, Woodie, Camarilla, DeMark). It automatically plots pivot levels and midpoints, highlights key reversal zones and sends alerts when price approaches these levels. Unlike the free Pivot Point Classic version, this Pro indicator allows users to customize more settings, analyze current and historical pivot points and use al

Unlock the potential of automated trading on Gold (XAUUSD) and Euro/USD (EURUSD) with the Gold Euro Edge indicator . This indicator is expertly designed to capitalize on market movements in these key pairs, aiming for consistent performance by displaying buy or sell arrows on chart, audible alerts on laptop and notifications to phone. Experience efficiency and potentially enhance your trading strategy with this specialized solution.
Market Flow Analysis is a structure-based indicator that goes beyond traditional tools to help you spot real entry opportunities with ease. It highlights the Gold Zone — a gold-filled rectangle showing you the best possible area for entries , based on market structure, not lagging signals. Whether you're scalping or swing trading, this indicator gives you the true market trend , valid order blocks , and clear reaction zones , all in one smart visual layout. Why Market Flow Analysis? Go

مؤشر Smart Trend Candles هو أداة فعّالة في منصة MetaTrader 4، تجمع بين عناصر تحليل فني متعددة لتحديد اتجاهات السوق وقياس قوة المشترين والبائعين. يوفر هذا المؤشر متعدد الاستخدامات إشارات مرئية واضحة تُحسّن قرارات التداول الخاصة بك. الميزات الرئيسية 1. تحديد الاتجاه يستخدم شموع Heikin-Ashi المعدلة (اختياري) لتصفية ضوضاء السوق يتضمن متوسطًا متحركًا (فترة قابلة للتكوين) لتأكيد الاتجاه تنفيذ مؤشر القوة النسبية لقياس الزخم 2. قياس القوة تشير الشموع المرمزة بالألوان إلى شدة ضغط الشراء/البيع تحليل الحج

IQ Gold Gann Levels a non-repainting, precision tool designed exclusively for XAUUSD/Gold intraday trading. It uses W.D. Gann’s square root method to plot real-time support and resistance levels, helping traders spot high-probability entries with confidence and clarity. William Delbert Gann (W.D. Gann) was an exceptional market analyst, whose trading technique was based on a complex blend of mathematics, geometry, astrology, and ancient mathematics which proved to be extremely accurate. Download
Haven 平均日波动范围 —— 一个用于计算并显示外汇及其他市场中金融工具的平均每日价格波动范围的指标。 其他产品 -> 点击这里 主要特点: 基于多个周期(5、10 和 20 天)计算 ADR 当价格达到波动范围时自动更改样式的 ADR 水平显示 清晰显示交易日的开始和结束 可自定义显示参数(颜色、线条粗细) 显示价格标签以增强可视化 该指标有助于交易者评估市场的波动性、识别潜在的反转区域,并制定当日的交易目标。 适用于所有时间周期(最高到 D1)以及任何交易工具。 交易应用: ADR 可通过多种方式有效地辅助交易决策。当价格接近 ADR 的上边界时,可能是一个潜在的卖出区域,尤其是在结合其他超买信号的情况下。类似地,达到 ADR 的下边界可能意味着买入机会。 该指标还可用于评估当日价格继续波动的可能性。如果 ADR 范围尚未被触及,则趋势可能继续。当价格达到 ADR 范围(通过线条颜色变化提示)后,反转或盘整的可能性增加。 交易者可利用 ADR 设定实际的盈利目标,并根据当前市场波动性设置合适的止损水平,从而使交易策略更好地适应当前的市场环境。
FREE
高低点追踪器 是任何重视精确度和清晰度来识别关键价格水平的交易者必不可少的指标。此工具专为使用机构策略(如 ICT(内部交易者) 、 BTMM(银行交易做市商) 和 SMC(智能货币概念)) 的交易者而设计,通过将重要的 高点和低点 直接绘制到当前图表上,简化了多时间框架分析。无论您是剥头皮交易、日内交易还是波段交易,此指标都可让您即时访问主要支撑位和阻力位,而无需不断切换图表。
谁需要这个指标? 此工具非常适合以下交易者: 对于低时间范围条目使用更高的时间范围偏差(例如 ICT 和 SMC)。 需要确定止损追踪和陷阱设置的流动性区域。 依靠关键支撑/阻力位来下订单。 当价格触及机构水平时需要实时警报。 在 1m/5m 图表上交易时,优先考虑多时间框架精度。
它为什么重要?
主要时间范围内的高点和低点通常充当磁性价格区,吸引大量市场活动。这些水平通常是机构订单堆积的地方,形成推动价格大幅波动的流动性池。做市商经常瞄准这些区域来寻找止损点或启动趋势逆转,为精明的资金交易者创造了理想的设置。此外,突破和重新测试通常发生在这些价格点附近,提供高概率的进入机会。通过在从 M5
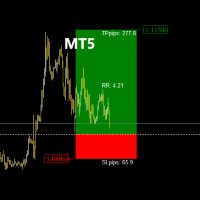
TradeManagerRR Visualizer MT5 是一个交易管理工具,旨在帮助交易者轻松地在图表上可视化他们的止损(SL)和获利(TP)水平。此初始版本提供了一个简单的图形表示,显示SL和TP区域以及入场价格。请注意,目前的版本仅专注于图形显示SL和TP区域的图形标记。 当前版本的特点: SL和TP区域显示: 清晰地显示止损和获利水平,支持自定义颜色。 可移动入场价格: 允许在图表上移动入场价格,以查看SL和TP水平的变化。 风险/回报比率计算: 动态显示基于设定水平的风险/回报比率。 使用方法: 设置入场价格: 点击图表以设置您的入场价格。 调整SL和TP水平: 移动SL和TP区域,以调整风险和回报水平。 查看区域: SL和TP区域将以不同的颜色显示,以方便可视化。 即将推出: 更新版本将在几天内发布,提供更多功能和改进,以实现更有效的交易管理。 请求: 如果您觉得 TradeManagerRR Visualizer MT5 有用,请在产品页面上进行评分。您的反馈对我们非常重要,有助于改进我们的工具。
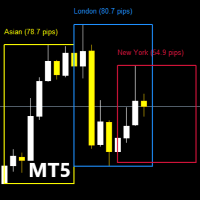
在深入了解此指标的功能之前,请记得对该产品进行评分,留下评论以分享您的经验,并订阅我的页面以获取最新更新和新工具的通知。您的支持是无价的,帮助我不断改进我的创作! 描述: TradingSessionPipsVisualizer - 专业的交易时段掌控工具 一目了然地可视化外汇交易时段,优化您的交易时机! TradingSessionPipsVisualizer 是一个为 MetaTrader 4 开发的高级指标,能够直接在您的图表上突出显示主要的交易时段(伦敦、纽约、亚洲、悉尼、法兰克福)。为高要求的交易者设计,它可以帮助您: 即时识别高交易活跃期 (时段重叠) 实时分析波动性 (显示点差范围) 根据最佳交易时段调整您的策略 ( scalping,日间交易,波段交易) 根据您的交易风格自定义显示方式 关键功能 直观可视化 为每个交易时段着色的区域 (可自定义颜色) 高点/低点 和点差范围清晰显示 清晰的图例 (可选)以便快速理解 ️ 高级自定义 选择显示的交易时段 (伦敦、纽约、亚洲等) 边框样式 (厚度、图案、填充) 时区管理 (精确调整 HH:MM)
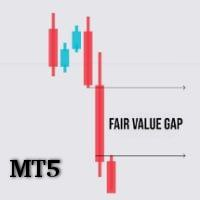
FVG 分析器 — 精准识别公平价值缺口(FVG)的强大工具 FVG 分析器 是专为使用 公平价值缺口(FVG) 交易策略的专业交易者设计的高级指标。通过智能检测和清晰可视化,它帮助你轻松发现市场低效区域 —— 价格很可能在继续趋势前回调至此的关键区域。 主要功能: 自动识别 FVG (看涨和看跌)基于蜡烛图结构。
可选择显示类型 : 仅看涨缺口 仅看跌缺口 同时显示两者 灵活的视觉显示选项 : 彩色矩形 中心线 矩形 + 中心线 矩形 + 中心线 + 标签 FVG 动态延伸直至被填补 ,实时追踪价格反应。 高度可定制化 : 颜色、样式、透明度设置 显示最大区域数量 可选显示区域名称 专为 MT5 优化 :即使在复杂图表中也流畅运行。 适用于所有交易风格 无论你是 剥头皮交易者(Scalper) 、 日内交易者(Day Trader) ,还是 波段交易者(Swing Trader) ,FVG 分析器都能满足你的需求。支持所有时间周期,从 M1 到月线都能完美运行。 为什么选择 FVG 分析器? FVG 分析器 帮助你提升每一次进场的 精准
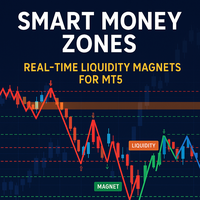
Developed according to the principles of smart money management strategies, the SM Zones indicator is a very convenient tool for traders on the MetaTrader 5 (MT5) platform. It graphically displays on the chart all the significant zones used in the SM strategy: market structure, price levels of increased liquidity, "price magnet" zones - imbalances, order blocks, fvg, breaker blocks and mitigation blocks - towards which the instrument's price moves. The zones influencing the bull market are high
FREE
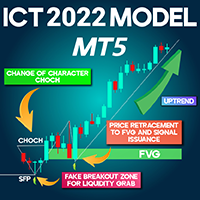
ICT 2022 Model Indicator for MetaTrader 5 The ICT 2022 Indicator is developed based on essential trading principles such as liquidity grabs (Sweep), Change of Character (CHoCH), fake breakouts (SFP), and Fair Value Gaps (FVG) .
By integrating these concepts, the indicator visually represents them on the price chart, making it an invaluable resource for traders and analysts following the ICT trading methodology . «Indicator Installation & User Guide» MT5 Indicator Installation | ICT two thousan
FREE
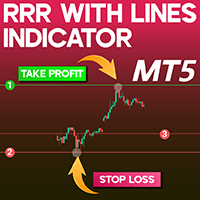
RRR with lines Indicator Download MT5 Effective risk management is a fundamental aspect of sustainable trading in financial markets. The RRR Indicator in MetaTrader 5 provides traders with a structured approach to calculating the Risk-to-Reward Ratio (RRR) . By drawing three adjustable horizontal lines, it assists traders in setting Stop Loss and Take Profit levels with precision. «Indicator Installation & User Guide» MT5 Indicator Installation | RRR with lines Indicator MT5 | ALL Products By
FREE

Overview:
"TrendLine Alerts" is a dynamic, multi-functional trading tool designed to monitor and alert traders in real-time when price action touches or breaks critical technical levels. Built for precision, it seamlessly tracks trendlines, horizontal support/resistance, vertical time-based lines, and equidistant channels , ensuring you never miss a key market movement. Whether you’re scalping, swing trading, or managing long-term positions, this indicator acts as your 24/7 market sentinel. K
MetaTrader 市场 - 在您的交易程序端可以直接使用为交易者提供的自动交易和技术指标。
MQL5.community 支付系统 提供给MQL5.com 网站所有已注册用户用于MetaTrade服务方面的事务。您可以使用WebMoney,PayPal 或银行卡进行存取款。
您错过了交易机会:
- 免费交易应用程序
- 8,000+信号可供复制
- 探索金融市场的经济新闻
注册
登录