Watch the Market tutorial videos on YouTube
How to buy а trading robot or an indicator
Run your EA on
virtual hosting
virtual hosting
Test аn indicator/trading robot before buying
Want to earn in the Market?
How to present a product for a sell-through
New Technical Indicators for MetaTrader 5

MonetTrend — Премиум-индикатор для торговли по тренду (M30, H1, H4)
MonetTrend — это мощный и визуально понятный трендовый индикатор, созданный для торговли на таймфреймах M30, H1 и H4. Он идеально подходит для работы с волатильными инструментами, такими как: • Золото (XAUUSD) • Криптовалюты (BTCUSD) • Валютные пары (EURUSD, USDJPY и др.)
Ключевые особенности MonetTrend: • Автоматическое отображение Take Profit 1 (TP1) и Stop Loss (SL): После появления сигнала индикатор сразу показывает: • TP

Crystal Volume Indicator – Smart Volume Analysis Tool for MT5 Crystal Volume is an advanced yet user-friendly volume analysis indicator designed to help traders visually interpret the market's hidden strength behind price movements. By combining price action with volume dynamics, this tool highlights critical volume events such as Buying Climax , Selling Climax , and Weak Candles , making it easier to spot potential reversal or continuation zones. Key Features: Real Volume Insights – Wor
FREE
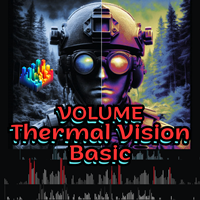
Volume Thermal Vision Basic is the simplified version of the renowned Volume Thermal Vision indicator, designed for traders looking to analyze volume intensity with practicality and efficiency. With 6 levels of vibrant colors, choose from StealthMode, NightVision, and FrostVision modes to view volume data clearly and strategically. Perfect for beginners or as a complement to your analysis, this indicator is lightweight, intuitive, and ideal for optimizing your trading decisions. Upgrade to the f
FREE

The SMC Sessions Indicator is a precision tool crafted for Smart Money traders who rely on ICT concepts, liquidity hunts, and session based strategies . It seamlessly maps out critical session based trading zones using the most proven and popular concepts used by institutional level traders. This all in one session indicator overlays your chart with the most effective and high probability range strategies, including: ICT Asian Range, London Breakout, New York Range, ICT London Open Killzone, ICT

Easily Spot Real Market Strength — Even If You're New. The Momentum Shadow Indicator (MSI) is perfect for beginners and pros.
It shows you when the market really has strength — so you know when to buy and when to sell with confidence. No confusion. No guessing.
Just simple lines that tell you what’s real and what’s not. Super easy to use — made for all levels
Clear buy & sell signals
Best on 20-minute charts and higher, but works for quick trades too If you’re new to trading, MSI makes it

Chart Spotter – The Ultimate Highlighting and Alerting Tool Unlock the full potential of your trading strategy with Chart Spotter—your all-in-one tool for real-time highlights and actionable alerts across sessions, RSI levels, ATR levels, and trends. Key Features 1. Session Highlights Automatically mark key trading sessions on your chart for improved timing and market analysis. Visual aids help you focus on high-activity periods. 2. RSI Alerts Real-time alerts when RSI enters overbought or over

Discover the Power of Volume with Volume Thermal Vision Ready to take your trading to the next level? Introducing Volume Thermal Vision, the ultimate MetaTrader 5 indicator that transforms volume analysis into a strategic advantage. Designed for traders seeking to identify high-probability opportunities, this indicator is perfect for methodologies like VSA (Volume Spread Analysis), ICT (Inner Circle Trader), SMC (Smart Money Concepts), and Wyckoff, helping to decipher market behavior in pairs li

KT Fair Value Gap (FVG) identifies and highlights zones of temporary price imbalance in the market. These gaps often act as potential areas for price continuation—or in some cases, reversals (also known as inverse FVGs). Bullish FVG: Displayed as green boxes, these gaps act as support zones where price may resume its upward movement. Once filled, they can also become potential turning points for a reversal. Bearish FVG: Shown as red boxes, these gaps serve as resistance zones where price may con

What It Does ICT Order Flow Matrix automatically identifies and plots the precise zones where banks, hedge funds and prop‑trading desks concentrate their orders. These Order Blocks serve as true support & resistance levels—no manual drawing required. Core Features Order Block Detection
Scans price action to locate institutional supply/demand imbalances and renders them as shaded S/R zones. Dynamic Zone Pruning
Zones that have been tapped or breached fade away, keeping your chart focused

The London Session Breakout Strategy Indicator is designed for traders who follow ICT (Inner Circle Trader) and Smart Money Concepts (SMC) , focusing on session based liquidity hunts, killzones, and market maker behavior during the London session. This tool captures the highest and lowest price levels between 00:00 and 07:00 GMT , which is commonly identified as the London Killzone or market maker range . It helps traders identify potential breakout zones where institutional activity and volati
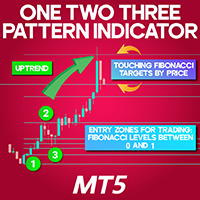
1-2-3 Pattern Indicator for MetaTrader 5
The 1-2-3 Pattern Indicator for MetaTrader 5 is a strategic analytical tool designed to pinpoint potential reversal zones in the financial markets. This indicator automatically identifies three significant swing points, forming a ZigZag structure that outlines the price path and calculates Fibonacci levels based on those decisive pivots. «Indicator Installation & User Guide» MT5 Indicator Installation | One Two Three 123 Pattern Indicator MT4 | ALL
FREE

Welcome. This tool is designed to help traders monitor the critical price level at which the account's margin level reaches 100%, providing valuable insights for risk management in trading. Advisor Description The "Margin Level 100%" indicator is a custom technical indicator for MetaTrader, designed to calculate and display the critical price level for a specific symbol where the account's equity equals its margin, resulting in a margin level of 100%. This level is crucial as it indicates the
FREE
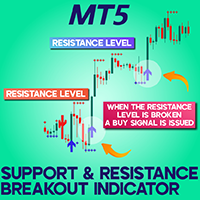
Support Resistance Breakout Indicator (SRBAI) download for MetaTrader 5 The Support Resistance Breakout Arrows (SRBA) indicator serves as a precision tool for mapping key price areas based on pivot structures. Specifically designed for MetaTrader 5 (MT5), the SRBAI indicator marks support zones with blue and resistance zones with red lines. Upon a confirmed breakout beyond these zones, it signals buying opportunities with blue arrows or selling opportunities with red arrows, accompanied by on-sc
FREE
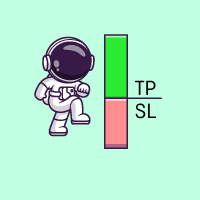
A simple plotting box for your TP and SL markers. The best use case is showcasing signals to your community. I also have MT2DC, which can be used to submit signals to Discord via webhook. By utilizing this indicator, your followers can quickly see the open position along with its TP and SL levels. The indicator also displays the average open price, allowing you to set SL above the average for a safer trade Kindly leave 5-star rating and share with your friends if you like this indicator.
FREE
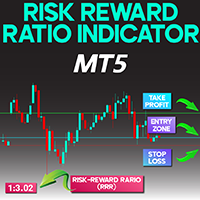
Risk Reward Indicator for MetaTrader 5
The Risk Reward Indicator for MetaTrader 5 is crafted to evaluate and display the Risk-to-Reward Ratio (RRR) with precision, placing the calculated value directly onto the trading chart.
This advanced risk assessment tool showcases the RRR in the upper-left corner of the screen and marks essential trade levels using three clearly defined horizontal lines:
• Green Line: Target Profit (TP)
• Red Line: Protection Stop (SL)
• Blue Line: Entry Point (EP) «Indic
FREE

Welcome to the "Breakeven Line" indicator, version 1.1, developed by Sergei Ivanov in 2025. Visualize breakeven price levels for your trades with precision and ease. Advisor Description The "Breakeven Line" is a MetaTrader (MQL5) indicator that displays breakeven price levels for open buy and sell positions on the current symbol, factoring in commissions and swaps for accurate risk management. Key Features: Dual Lines: Plots Buy Breakeven (Dark Violet) and Sell Breakeven (Deep Pink) lines, show
FREE
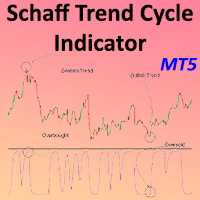
Schaff Trend Cycle Indicator for MetaTrader5
The Schaff Trend Cycle Indicator for MetaTrader5 is a momentum-based oscillator that helps detect potential reversal zones on the price chart. It is built using a hybrid model of the MACD (Moving Average Convergence Divergence) and the Stochastic Oscillator. This indicator marks readings below the 25 level as potential buying zones (oversold), while values above 75 suggest overbought conditions. The visual movement is depicted by a curved purple line
FREE
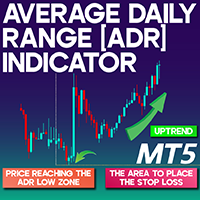
Average Daily Range (ADR) Indicator for MetaTrader 5 The Average Daily Range (ADR) Indicator for MetaTrader 5 is a powerful analytical tool developed for monitoring average price fluctuations within a trading day. It serves as an essential asset for evaluating market dynamics and intraday volatility. A price movement reaching the ADR High can indicate a potential exhaustion among buyers, often hinting at an upcoming pullback. Conversely, when the price moves toward the ADR Low, it might represen
FREE
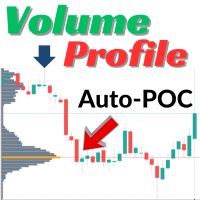
Crystal Volume Profile Auto POC Indicator by Muhammad Jawad Shabir
Version: 1.74 Crystal Volume Profile — Smart Volume Visualization for Precise Trading Decisions Crystal Volume Profile is a lightweight yet powerful indicator developed for MetaTrader 5, designed to provide traders with a clear and insightful view of market volume activity. Whether you're a day trader or swing trader, this tool enables you to identify high-impact price levels by highlighting where trading volume is most conc
FREE
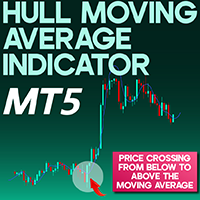
Hull Moving Average Indicator MetaTrader 5
The Hull Moving Average (HMA), developed by Alan Hull, offers a refined alternative to conventional moving averages by delivering faster responsiveness and improved trend accuracy. Integrated into the MetaTrader 5 (MT5) platform, this indicator is tailored to help traders better recognize short-to-medium-term market directions. By using the Hull MA, traders can fine-tune their trade entries and exits with enhanced timing. «Indicator Installation & User
FREE

Discover the power of harmony in the markets with this advanced harmonic pattern indicator. Designed for demanding technical traders, this indicator automatically detects 11 of the most popular harmonic patterns, including the Gartley, Bat, Crab, Butterfly, Shark, Cypher, and many more.
Thanks to its dynamic dashboard, you can easily manage the visibility of patterns on the chart, activating or deactivating the ones you want in real time without overloading your platform. This flexibility allo
FREE
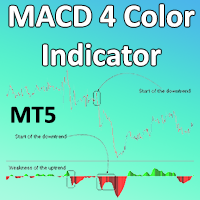
MACD 4 Color Indicator for MetaTrader 5
The MACD 4 Color Indicator for MetaTrader 5 (MACD 4C) is designed to provide a clearer visualization of market momentum and trend dynamics. As an enhanced variant of the traditional MACD, this tool incorporates four distinct color signals in the histogram, reflecting not only the direction of the trend but also its intensity. It helps traders interpret price behavior more accurately by analyzing the slope variations of the moving averages. «Indicator Inst
FREE
Eight indicator for 3 day/session/week setups. Indicator daily features: Daily close/high/low Weekly open/high/low/close Tokyo/London/New York sessions Alerts Signals and alerts for First Green days First Red days Inside days Outside days 3x days of breakout up 3x days of breakouts down Do not be stupid and take every signal. Learn 3day setups first.
FREE

RSI Heatmap Indicator for MetaTrader5
The RSI Heatmap Indicator for MetaTrader5 is a powerful visual tool designed to measure the momentum of multiple currency pairs based on the Relative Strength Index (RSI). It detects and highlights overbought and oversold conditions across several timeframes and displays them in a heatmap located at the bottom left section of the chart. This visual representation helps traders quickly assess the overall market sentiment. Green tones signal potential buying
FREE
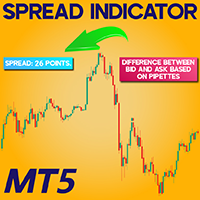
Spread Indicator download For Meta Trader 5
The Spread Indicator is a practical utility designed for MetaTrader 5 (MT5) that highlights the gap between the Bid and Ask prices directly on the chart. Positioned in the upper-left corner of the screen, it presents the current spread in real-time using pipettes (points), providing traders with a clear view of market costs. «Indicator Installation & User Guide» MT5 Indicator Installation | Spread Indicator Download for MT4 | ALL Products By Trad
FREE

Let us introduce the Heikin Ashi RSI Oscillator! This indicator combines the concepts of Heikin Ashi candles with the RSI (Relative Strength Index) to produce an oscillator-like format that can be used to filter out some of the noise associated with standard RSI readings. This provides traders with a smoother representation of market conditions. Here are some articles to read more about the RSI and Heikin Ashi candles: https://www.investopedia.com/terms/r/rsi.asp https://www.investopedia.com/ter

The Bayesian Trend Indicator colors each candle according to a Bayesian‐inference of trend direction. It computes “prior” trend strength from four standard moving averages (EMA, SMA, DEMA, VWMA) of your chosen length, then computes a “likelihood” from faster versions of those same MAs (shortened by a “gap”). It combines them to produce a posterior probability of an uptrend. Candles are colored: Green when posterior indicates a strong uptrend. Red when posterior indicates a strong downtrend. Blue
As the suggested, with this indicator you are able to switch from one symbol or timeframe to another in the same single chart. So forget about opening tons of chart on your screen! It's not designed for ICT or SMC trader, but if you are that kind of trader you still can use it. Imagine you have a strategy containing various indicators and settings, on a single chart you can screen the entry opportunity then move to the next symbol or timeframe.
FREE
HedgingMonitor: Visual Control for Hedging Operations HedgingMonitor: Professional Order Visualization for MT5 HedgingMonitor is a professional indicator for MetaTrader 5 that displays detailed information about all your open and pending orders in an organized and customizable visual panel. Ideal for traders who use hedging strategies or manage multiple orders simultaneously. Key Features: Intuitive Visual Interface: View all your orders in a single panel, with color coding to quickly identify b

This MT5 indicator provides real-time updates of classic Renko charts. Renko charts focus on price movement, filtering out noise and highlighting trends. What are Renko candles? Renko charts display price movement using "bricks" of equal size, ignoring time. A new brick is drawn only when the price moves by a specified amount. They help visualize trends by removing time-based noise.
Parameters - BrickSizePoints (20): Renko brick size in points - HistoryDepthSec (3600): Historical data to ini
FREE
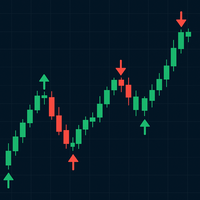
Trend Mark is a versatile trading indicator designed to highlight high-probability entry points using visually intuitive arrows directly on the chart. It analyzes price action and market momentum to identify potential trend reversals or continuations, displaying upward or downward arrows when specific trade conditions are met. Suitable for both beginners and experienced traders, Trend Mark can be used across multiple timeframes and instruments, making it a powerful tool for scalping, day trading

AstroBias Indicator: Precision in the Angle of Your Trend The AstroBias Indicator is more than just a trend direction tool. It also tracks the change in the angle of the price slope , allowing traders to filter signals using angular filters . This makes it especially useful for building automated trading bots based on its signal logic. Key Benefits of AstroBias Indicator Highly Sensitive to Price Action AstroBias responds quickly to real-time price movements, providing clear and timely sign

Sonic Edge Meter: Precision for Reversals and Price Surges Sonic Edge Meter is a powerful indicator built on original algorithms for extremum detection . It’s specifically designed to identify market reversals and sharp directional moves , giving you a clear signal before they happen. How Does Sonic Edge Meter Work? The indicator notifies you of potential turning points or price spikes by displaying visual markers directly on the chart:
Blue dot — signal to buy
Red dot — signal to sell
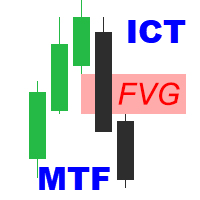
ICT Fair Value Gaps MTF Unlock the power of Fair Value Gaps (FVGs) across multiple timeframes using the ICT Fair Value Gaps Multi - Timeframe Indicator —a precision tool built for traders who follow the Smart Money Concept (SMC) . Key Features : Multi-Timeframe FVG Detection : Automatically identifies Fair Value Gaps from higher timeframes (M15, H1, H4, etc.) and plots them on your active chart for immediate insight. Break of Structure (BOS) & Change of Character (CHoCH): Clearly marked BOS

Fibonacci Trend Indicator for MT5 Unlock the power of Fibonacci analysis on your MetaTrader 5 charts!
Our Fibonacci Trend Indicator automatically plots dynamic support and resistance levels so you can spot trends, reversals, and breakout opportunities at a glance. Features & Advantages Automatic Fibonacci Levels
Instantly displays seven key Fibonacci retracement levels based on the highest and lowest prices from your chosen lookback period — no manual work required. Dynamic Trend Adaptatio
FREE

Candle Confirm Color
What Is It?
The Candle Pattern Confirmations is an advanced indicator for MetaTrader 5 (MT5) designed to identify and confirm candlestick patterns with high probability of trend reversal or continuation. It visually highlights candles that form Engulfing (Bullish/Bearish) and Inside Bars patterns, assisting traders in making more assertive decisions with real-time confirmation.
Main Features
Automatic Pattern Detection
- Detects Bullish Engulfing and Bearish Engulfin
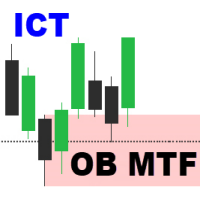
Order Block Multi Timeframe The Order Block Multi Timeframe is a powerful tool for Smart Money Concept (SMC) traders, combining high-accuracy Order Block detection with real-time Break of Structure (BOS) and Change of Character (CHoCH) analysis across multiple timeframes. Smart Money Insight, Multi-Timeframe Precision This indicator automatically identifies institutional Order Blocks —key price zones where large players have entered the market—and plots them directly on your chart. It also track

CHoCH & EQH/EQL: Market Structure and Liquidity Zones Indicator Overview: This versatile indicator is designed to help traders identify potential shifts in market structure and pinpoint key liquidity zones directly on their MetaTrader 5 charts. It automatically detects and visualizes two crucial price action concepts: Change of Character (CHoCH) for potential reversals, and Equal Highs/Lows (EQH/EQL) for significant support/resistance levels. Key Features: Change of Character (CHoCH) Detection:

This is a Free Display Dashboard for The ArbitrageATR Recovery MT5 EA. This indicator is used to track existing Total hedge positions (Account Summary) , Balance, Equity, P/L and Symbols, Correlation Status. Please adjust size and colours according to your desired preference. Feel free to message me if there are any queries required. Please note that this an indicator and not a Utility or Expert Advisor.
LINK TO THE EA: https://www.mql5.com/en/market/product/131269?source=Site+Market+Product+
FREE

# TickVolumeLines — visualize tick volumes as horizontal trend lines
## Overview **TickVolumeLines** displays tick volumes as horizontal trend lines on the chart. - **Green line** appears at the **Low** of a bullish candle. - **Red line** appears at the **High** of a bearish candle. The thickness of each line corresponds to the tick volume on that bar.
This helps identify high-volume bars visually and locate potential market interest zones.
## Features - Tick volume visualization
FREE

Multi-MA Ribbon Overlay (6 EMAs + 250 SMA)
This indicator displays six exponential moving averages (15, 25, 35, 45, 60, 70)(YOU CAN CHANGE THE VALUES) and a slow 250-period simple moving average to help visualize market momentum and trend structure. It’s designed as a clean trend-ribbon for scalpers, intraday, and swing traders. ️ Disclaimer:
Trading forex and CFDs on margin carries a high level of risk and may not be suitable for all investors. Leverage can work for or against you. Always u
FREE

Pivot Points Indicator – Your Technical Compass in the Market Unlock powerful levels of market structure with our Pivot Points Indicator – a classic tool enhanced for modern trading! Designed for MetaTrader5, this indicator automatically calculates and displays daily, weekly, or monthly pivot levels along with key support and resistance zones. Whether you're a scalper, day trader, or swing trader, pivot levels help you identify potential reversal points , entry zones , and take-profit targ
FREE

# TickVolumeLines — визуализация тиковых объёмов через линии на графике ## Описание Индикатор **TickVolumeLines** отображает тиковые объёмы в виде горизонтальных линий на графике. - **Зелёная линия** — на уровне **Low** бычьей свечи. - **Красная линия** — на уровне **High** медвежьей свечи. Толщина линии зависит от величины тикового объёма на баре. Индикатор помогает быстро визуально определить всплески объёма и потенциальные уровни интереса участников рынка. ## Особенности - В
FREE
NewFractalLines — Fractal Level Indicator with Trend Lines NewFractalLines is an advanced indicator for MetaTrader 5 that automatically detects local price extremes (fractals) and displays them as horizontal trend lines on the chart. The lines are drawn precisely at the high and low of candles that qualify as a fractal based on N bars before and after. Purpose: Identify key support and resistance levels, visualize price turning points. Use case: Level trading, scalping, price action p
FREE
NewFractalLines — индикатор фрактальных уровней с трендовыми линиями NewFractalLines — это инновационный индикатор для терминала MetaTrader 5, который автоматически определяет локальные экстремумы (фракталы) и отображает их в виде горизонтальных линий на графике. Линии строятся строго по high и low свечей, соответствующих условиям фрактала (экстремум относительно N баров до и после). Назначение: помогает определить ключевые уровни поддержки и сопротивления, а также визуализировать рыночн
FREE
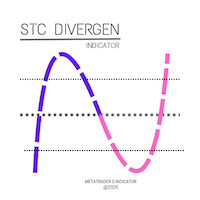
Overview The Stochastic Divergence Indicator is a powerful tool designed to detect potential market reversals by combining the popular Stochastic Oscillator with divergence analysis. Divergence occurs when the price moves in the opposite direction of the indicator, signaling a possible trend exhaustion or reversal. This indicator visually marks bullish and bearish divergences on the chart, helping traders make informed decisions with greater confidence. Key Features • High Accuracy (No Repaint)

Simple. Informative. Instantly Visible on Your Chart. Alwinson Active Trades Info is a lightweight custom indicator that displays a real-time summary of your currently open trades —right on your chart. No more switching tabs just to see what pairs are active and how much lot size is in play.
Alwinson Active Trades Info is also available for the MetaTrader 4 (MT4) version .
Key Features: Displays a list of all symbols with open positions in your trading account. Shows the dominant position ty

To get access to MT4 version please contact via private message. This is the exact conversion from TradingView: "3rd Wave" by " LonesomeTheBlue ". The screenshot shows similar results from tradingview and Metatrader when tested on ICMarkets on both platforms. This is medium-load processing indicator and updates are available per bar close. This is a non-repaint indicator. All input options are available. Buffers are available for processing in EAs. You can message in private chat for further cha

TrendWave Bands Indicator This is a trend-tracking tool, originally by BigBeluga on TradingView, designed to adjust automatically to current market movements using upper and lower dynamic bands. It uses color gradients to visualize the strength and persistence of a trend, and includes secondary wave bands to assist with deeper analysis. Main Features Smart Adaptive Bands In uptrends, a dynamic lower band is displayed, while in downtrends, an upper band appears. These serve as moving zones of

Eabotpro Signal Is indicator can scan all time frame and guide you where is the trend going with take profit and stop loss , Tp1 , Tp2 , Tp3 , he give 90% which is very good , preffer to work for scalping tf1 and for swings T15 till 4H , Nice indicator no more loss on your pocket , Eabotpro Signal scan Tf1 minutes till 1Day , Trading is not game , trading is ART, patient ,vision , in the end its your money and if you lose it no one will give it to you back , be responsible , accept the low minim

When there is no position, when changing the color, you can consider opening an order. With the fluctuation of the market, when the current color changes again, you need to close the position and leave. Suitable for different cycles, the trading rules are simple and require friends to explore on their own.
I hope friends who use this indicator can make a lot of money, rolling bigger and bigger like a snowball. thank you!
The TrendKiller Oscillator is a custom MetaTrader 5 (MT5) indicator designed to help traders analyze price deviations from a moving average, displayed in a separate window. It calculates the difference between a chosen price (e.g., close) and a moving average (default: 14-period SMA), producing a detrended value that oscillates around a zero line. Dynamic maximum and minimum levels, computed over a user-defined period (default: 50 bars), provide context for identifying overbought/oversold condi

SpectralEdge Periodogram - Cycle Analysis Indicator
Overview
The SpectralEdge Periodogram is a powerful technical analysis indicator for MetaTrader 5, designed to uncover hidden price cycles in financial markets using Fast Fourier Transform (FFT). By transforming price data into the frequency domain, this indicator reveals the dominant cycles driving market movements, enabling traders to identify repeating patterns and make informed trading decisions. Whether you're a day trader, swing trader

Este indicador calcula e exibe no gráfico o preço justo do mini índice (WIN) com base em dados fundamentais do mercado. Além disso, ele traça automaticamente linhas de suporte e resistência percentuais , ajudando você a visualizar zonas importantes de preço. É como ter uma régua financeira no gráfico, mostrando onde o preço "deveria estar", de forma objetiva, considerando o cenário macroeconômico!
O indicador usa uma fórmula de precificação de contratos futuros baseada em: O preço à vista do Ib
Percentage Range Consolidation O Percentage Range Consolidation é um indicador poderoso projetado para identificar zonas de consolidação de preço com base em variações percentuais ao longo do tempo. Ideal para traders que buscam detectar áreas de compressão de volatilidade e possíveis pontos de ruptura (breakout). Principais características: Identifica até 3 zonas de consolidação simultâneas, cada uma configurável de forma independente. Cálculo baseado na variação percentual entre a máxima e mín

The Ultimate RSI indicator is a new oscillator based on the calculation of the Relative Strength Index that aims to put more emphasis on the trend, thus having a less noisy output. Opposite to the regular RSI, this oscillator is designed for a trend trading approach instead of a contrarian one. While returning the same information as a regular RSI, the Ultimate RSI puts more emphasis on trends, and as such can reach overbought/oversold levels faster as well as staying longer within these areas.

Trend Rider combines indicators such as Super Trend, RSI, and MACD. Its purpose is to assist in spotting and riding trends by displaying direction through color-coded candles and trailing stop levels. It can be employed independently or alongside other filters for enhanced decision-making.
The integration of these indicators aims to provide a clearer picture of market trends and facilitate better trading strategies. Super Trend helps identify the prevailing trend, RSI measures the market condi

Descubra o Pulse Flow, um indicador exclusivo desenvolvido para traders que buscam clareza visual e agilidade na leitura do mercado. Com uma abordagem inteligente e dinâmica, ele destaca zonas de transição de força e equilíbrio entre compradores e vendedores, revelando oportunidades com precisão.
Ideal para quem opera fluxo, price action ou deseja uma leitura limpa, objetiva e poderosa, o Pulse Flow se adapta a qualquer ativo ou tempo gráfico. Simples de usar, difícil de ignorar

Descubra o Wave Flow, um indicador exclusivo desenvolvido para traders que buscam clareza visual e agilidade na leitura do mercado. Com uma abordagem inteligente e dinâmica, ele destaca zonas de transição de força entre compradores e vendedores, revelando oportunidades com precisão.
Ideal para quem opera fluxo, price action ou deseja uma leitura limpa, objetiva e poderosa, o Wave Flow se adapta a qualquer ativo ou tempo gráfico. Simples de usar, difícil de ignorar

Each buyer of this indicator also receives the following for free:
The custom utility "Bomber Utility", which automatically manages every trade, sets Stop Loss and Take Profit levels, and closes trades according to the rules of this strategy Set files for configuring the indicator for various assets Set files for configuring Bomber Utility in the following modes: "Minimum Risk", "Balanced Risk", and "Wait-and-See Strategy" A step-by-step video manual to help you quickly install, configure, and s

NOTE: CYCLEMAESTRO is distributed only on this website, there are no other distributors. Demo version is for reference only and is not supported. Full versione is perfectly functional and it is supported. CYCLEMAESTRO , the first and only indicator of Cyclic Analysis, useful for giving signals of TRADING, BUY, SELL, STOP LOSS, ADDING. Created on the logic of Serghei Istrati and programmed by Stefano Frisetti ; CYCLEMAESTRO is not an indicator like the others, the challenge was to inter

Zero Lag EMA Indicator (AI-Optimized) – Professional Trading Tool Enhance your trading accuracy with the Zero Lag EMA Indicator — a next-generation solution designed to eliminate the delay of traditional moving averages. Powered by AI-optimized algorithms, this tool delivers lightning-fast market insights, helping you stay ahead of price action. Key Features: AI-Enhanced Speed : Virtually no lag. Detects trend shifts and momentum changes with exceptional speed. Market Versatility : Ideal for For
FREE
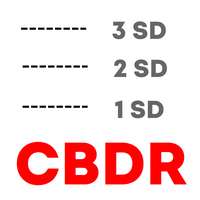
Haven CBDR is a simple-to-use indicator that displays the ICT "Central Bank Dealers Range" (CBDR) on the chart. The program draws rectangles highlighting the CBDR price range and also shows additional standard deviation lines to assess possible support and resistance levels. The product allows you to configure the CBDR time range, the number of displayed calendar days, the colors and styles of graphic elements, and it automatically adjusts the color scheme depending on the chart theme. Additiona
FREE

I am a trader specializing in the development of rare , exclusive , high-performance trading bots designed for serious traders who are committed to achieving consistent profitability and success. This free indicator is more than just a visual tool—it powers the Midnight Throttle EA , an automated trading system that executes trades based on the precise market conditions this indicator observes. Midnight Watch : A Pro-Level Tool for Precision Market Analysis. An advanced , multi-functional MetaTr
FREE

Simple, straightforward and efficient — that's what Bars Trend and Pivot Support is all about.
With this system, you have at your disposal an intuitive tool that makes your analysis on the chart easier. It automatically marks important supports and resistances based on the chosen period, in addition to highlighting the Pivot line, all with activation and deactivation options according to your preference.
The panel also clearly displays the direction of the candles on the D1, H4, H1 and M30 ch
FREE
"This Secret Trading Tool BANNED By Prop Firms (They Don’t Want You To Know!)" Discover the Ultimate Trading Edge – Without EAs! (Made for traders, by A trader. Not a Robot – just pure Trading Power!) Struggling with fake breakouts, sudden reversals, or market manipulation? This powerful trading tool gives you laser-accurate signals even when markets move fast – helping you spot high-probability entries like a pro!
------------------------------------------------------------------------------
The Multi Timeframe Candles indicator is a powerful visualization tool designed to help traders align their lower timeframe analysis with higher timeframe structure. By plotting candles from a selected higher timeframe (H1, H4, D1, etc.) directly on your current chart, this indicator gives you a clearer perspective of the overall market narrative without switching charts.
Who Needs This Indicator? This tool is ideal for: Smart Money Concept (SMC) / ICT Traders who rely on higher timeframe bias
Fractal Model Indicator for Metatrader , meticulously crafted around the renowned Fractal Model by TTrades. This powerful tool empowers traders to navigate price action with precision, leveraging multi-timeframe analysis to anticipate momentum shifts, swing formations, and trend continuations. Designed for MetaTrader , the Fractal Model Indicator combines advanced algorithmic insights with customizable features, making it an essential addition for traders seeking to capitalize on expansive mar
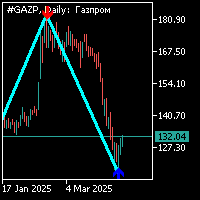
The zig-zag indicator is standard with a period of 34 with an additional arrow signal. The additional signal is calculated separately from the zig-zag indicator.The work on this indicator is as follows: 1. when forming a segment of the zig-zag indicator and an additional arrow signal appears, you need to open a position in the direction of the arrow; 2. when forming another arm of the zig-zag indicator in the opposite direction of the additional signal (arrow) at the top of the previous arm, it
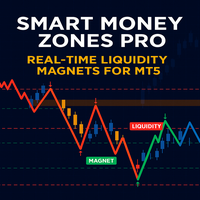
If you want to try and get to know the functioning of the SM Zones Pro indicator better, download and try the free SM zones indicator, which is adapted to work with a single EURUSD instrument only in various timeframes. You can download SM Zones from this market. SMZones Pro, unlike SM Zones, can analyze up to 10 different instruments at the same time. Developed according to the principles of smart money management strategies, the SM Zones Pro indicator is a very convenient tool for traders on
MetaTrader Market - trading robots and technical indicators for traders are available right in your trading terminal.
The MQL5.community payment system is available to all registered users of the MQL5.com site for transactions on MetaTrader Services. You can deposit and withdraw money using WebMoney, PayPal or a bank card.
You are missing trading opportunities:
- Free trading apps
- Over 8,000 signals for copying
- Economic news for exploring financial markets
Registration
Log in
If you do not have an account, please register
Allow the use of cookies to log in to the MQL5.com website.
Please enable the necessary setting in your browser, otherwise you will not be able to log in.