适用于MetaTrader 5的新技术指标 - 14

The UT Bot Alert MT5 Indicator is an advanced technical analysis tool designed to help traders optimize their trading performance. This indicator is MT5 conversion of the UT Bot alerts indicator by “QuantNomad “ in Trading View website and some alert methods are added to provide real-time alerts when a trading signal is generated, in order to allow traders to act quickly and efficiently. Key Features: Alert Types: in addition to the terminal pop-up alerts, the mobile notification sends the alert

This indicator displays MTF (Multi-Time Frame) Candles on your Chart. It helps to see the overall Trend of Market. You can specify 2ndLast, Last or Current Candle of any timeframe to show to get a better picture of Trend.. You get 4TF Bars/Candles on your current chart ..
Customizable Settings are : 1. Where to place MTF Candles.. 2. Show or Hide for each Candle 2. Time-Frame for each Candle 3. Current/ Last / 2nd Last of Each Candle
FREE

Description Helps you detect the structure of the market, using different types of Smart Money concepts. This should help you to upgrade your trading strategy in every way. Smart Money Features: Color candle to signal the type of structure Shows CHOCH and BOS Equal Lows and Highs Order Blocks Internal and Swings Weak and strongs high and lows Fair Value Gaps High and Lows in daily weekly and monthly timeframes Premium and discount Zones KEY LINKS: How to Install – Frequent Questions - All

En esta versión, las alertas están funcionando y en la versión que publicó, la zona muerta de atr era solo una zona muerta sin atr, por lo que también la convirtió en una zona muerta de atr.
Indicator input parameters input int Fast_MA = 20; // Period of the fast MACD moving average input int Slow_MA = 40; // Period of the slow MACD moving average input int BBPeriod=20; // Bollinger period input double BBDeviation=2.0; // Number of Bollinger deviations input int Sensetiv
FREE

Developed by Charles Le Beau and featured in Alexander Elder's books, the Chandelier Exit sets a trailing stop-loss based on the Average True Range (ATR). The indicator is designed to keep traders in a trend and prevent an early exit as long as the trend extends. Typically, the Chandelier Exit will be above prices during a downtrend and below prices during an uptrend.
Calculation
The original Chandelier Exit formula consists of three parts: a period high or period low, the Average True
FREE

Unlock the Power of Scalping with this Essential Indicator for Any Currency Pair! Experience Crystal-Clear Buy/Sell Signals and Activate Instant Alerts for Maximum Precision.
Introducing the Ultimate Scalping Companion: Your Key to Precision Profits! Transform Your Trading Strategy with an Indicator that Stands the Test of Time! In the ever-evolving world of trading, consistent success hinges on smart risk management . While no tool can be the holy grail, our non-repainting indicator
FREE

Trend Envelopes indicator is calculated based on a % of price change. That % is then used to determine if there is a new trend or trend remains the same.
This version is using Standard Deviation for the price change calculation instead and is adding prices smoothing prior to be used in calculations. The smoothing can be done using one of the 4 average types:
* Simple Moving Average
* Exponential Moving Average
* Smoothed Moving Average
* Linear Weighted Moving Average
Als
FREE

================ // Average period ma_Sma, // Simple moving average ma_Ema, // Exponential moving average ma_Smma, // Smoothed MA ma_Lwma // Linear weighted MA =============== // Average method // Turn alerts on? // Alert on current bar? // Display messageas on alerts? // Play sound on alerts?
FREE

This indicator idea comes from Tushar Chande called Qstick.
Technical indicators quantify trend direction and strength in different ways.
One way is to use the difference between close and open for each bar and to sum it up over a period of time.
The formual is:
Qstick (period ) = Average ((close-open ), period )
In this indicator, we can choose how to calculate body by two famous chart types. The first and default indicator settings are based on Heiken Ashi chart, and the second i
FREE

Es un indicador que no se repinta y que muestra la tendencia a corto plazo. contiene lo siguiente: Visual Mode MA Period MA Method MA Price
ATR Period Volatility Factor Offset Factor Use Break Use Envelopes Use Alert
cualquier sugerencia hagamelo saber en los comentarios y también colocar estrellas para postear más contenido, indicadores y advisor actualizadas
FREE
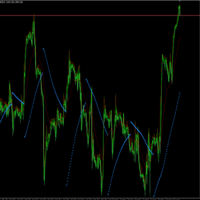
La idea de este indicador es la siguiente: reemplazar los precios High, Low del indicador SAR por los valores del indicador Moving Average. Al final tendremos la siguiente imagen:
Es decir, el indicador SAR cambia su dirección después de tocar el indicador Moving Average.
Parámetros de entrada SAR: Step - parámetro "Step" del indicador SAR; SAR: Maximum - parámetro "Maximum" del indicador SAR; MA: Period - parámetro "período de promediación" del indicador MA; MA: Shift - parámetro "d
FREE

This is not a conventional Moving Average Indicator. With this indicator, you can fully costumize your moving average. You can select the "Source" Price (not only the standard prices that come with Metatrader), "Period" of it, and the "Smooth" Calculation that you want to apply. There are many of them, such as SMA (Simple Moving Average), SMMA (Smoothed Moving Average), EMA (Exponential Moving Average), DEMA (Double Exponential Moving Average), TEMA (Triple Exponential Moving Average) and LWMA (

GG TrendBar Indicator - Your Multitimeframe ADX Trading Solution Experience the power of multi-timeframe trading with the "GG TrendBar MT5 Indicator." This versatile tool, built upon the ADX indicator, offers precise insights by considering multiple timeframes, ensuring you make well-informed trading decisions. Basic Details : Indicator Type : GG TrendBar Indicator (Multi-Timeframe ADX) Key Metrics : Real-time ADX analysis across multiple timeframes. Customization : Enable or disable specific ti

Unlock the Power of Scalping with this Essential Indicator for Any Currency Pair! Experience Crystal-Clear Buy/Sell Signals and Activate Instant Alerts for Maximum Precision.
Introducing the Ultimate Scalping Companion: Your Key to Precision Profits! Transform Your Trading Strategy with an Indicator that Stands the Test of Time! In the ever-evolving world of trading, consistent success hinges on smart risk management . While no tool can be the holy grail, our non-repainting indicator is a

Scalper Dynamic Pivot detects respectable narrow reversal areas that can be used to mark repeatable opportunity windows. Originally made for M1 timeframe and targeting M30 using EMA200.
Setup/inputs:
First, set one pip on price, e.g. EURUSD to 0.0001, USDJPY to 0.01, or XAUUSD to 0.1. Set minimum and maximum range on pips, if you want scalp between 10 to 20 pips then set it to 10 and 20 respectively. Set moving average length to be used as pivot baseline. To use M30 with EMA200 please use M

黄金趋势 - 这是一个很好的股票技术指标。该指标算法分析资产的价格走势,并反映波动性和潜在进入区。
最佳指标信号:
- 卖出 = 红色柱状图 + 红色短指针 + 同方向黄色信号箭头。 - 买入 = 蓝色柱状图 + 蓝色多头指针 + 同方向水蓝色信号箭头。
该指标的优点
1. 该指标生成的信号准确度高。 2. 只有当趋势发生变化时,才能重新绘制已确认的箭头信号。 3. 您可以在任何经纪商的 MetaTrader 5 交易平台上进行交易。 4. 您可以交易任何资产(货币、金属、加密货币、股票、指数等)。 5. 最好在 H1 时间框架(中期交易)上进行交易。 6. 在指标设置中可更改个别参数(TF、颜色等),以便每位交易者都能轻松定制适合自己的指标。 7. 该指标既可作为交易系统的主要补充,也可作为独立的交易系统使用。
注意:交易的入市准确性和盈利能力仅取决于交易者的技能。任何指标都只是交易者的助手,而非行动指南。
MetaTrader 4 黄金趋势指标版本
祝大家交易好运,稳定盈利!

Gold Venamax - 這是最好的股票技術指標。 此指標演算法分析資產的價格變動並反映波動性和潛在的進入區域。
指標特點:
這是一個帶有 Magic 和兩個趨勢箭頭塊的超級指標,可實現舒適且有利可圖的交易。 圖表上顯示用於切換方塊的紅色按鈕。 Magic 在指標設定中進行設置,以便您可以將指標安裝在顯示不同區塊的兩個圖表上。 Gold Venamax 可以放置在具有不同箭頭緩衝區(GV 和 SF)的兩個圖表上。 為此,您需要在設定中選擇不同的 Magic,例如,一個具有 Magic = 999,另一個具有 Magic = 666。接下來,您可以使用圖表上的紅色按鈕選擇箭頭緩衝區。 進入的最佳訊號 = 遵循兩個緩衝區的訊號箭頭(GV 和 SF)+ 所有三個 MA 線(紅色或藍色)的方向。
此指標的優點:
1. 此指示器產生高精度訊號。 2. 確認的箭頭訊號不會重新繪製。 3. 您可以在任何經紀商的 MetaTrader 5 交易平台上進行交易。 4. 您可以交易任何資產(貨幣、金屬、加密貨幣、股票、指數等)。 5. 在 M30 和 H1 時間範圍內

该指标允许您以大字体显示斐波那契水平标签
。 它支持多达 25 个斐波那契水平
- 一旦您绘制斐波那契,它就会显示您作为输入参数添加的水平,并以大字体大小以及您选择的颜色和字体。
可定制选项:
1.Fibo文本字体
2. 斐波那契文本大小
3. 斐波那契文本颜色
3.为每个级别添加描述
4. 其他选项,例如锚点和度数
该指标允许您以大字体显示斐波那契水平标签
。 它支持多达 20 个斐波那契水平
- 一旦您绘制斐波那契,它就会显示您作为输入参数添加的水平,并以大字体大小以及您选择的颜色和字体。
可定制选项:
1.Fibo文本字体
2. 斐波那契文本大小
3. 斐波那契文本颜色
3.为每个级别添加描述
4. 其他选项,例如锚点和度数
该指标允许您以大字体显示斐波那契水平标签
。 它支持多达 20 个斐波那契水平
- 一旦您绘制斐波那契,它就会显示您作为输入参数添加的水平,并以大字体大小以及您选择的颜色和字体。
可定制选项:
1.Fibo文本字体
2. 斐波

介绍《波动医生罗盘》 - 您在任何市场中赢利的可靠指南!
揭示永恒数学定律的秘密:借助我们独家技术,深入探讨交易精髓,其根基稳固,扎根于超越所有市场的数学原则。虽然我们不会透露具体秘密,但请放心,这一创新是您在任何市场条件下取得卓越可靠性的通行证。
革命性的双重功能:想象一下拥有识别趋势方向和趋势力量的能力,而这一切都在一个图表中!我们的指标巧妙地结合了趋势方向和力量,为您节省宝贵时间,并保护您的利润免受错误进入的风险。告别困扰,迎接自信的交易决策。
为每个市场量身定制:我们明白每个市场都是独特的。因此,我们的《波动医生罗盘》灵活适应每个市场,确保它了解市场的微妙差异并做出相应调整。借助其依赖ATR(平均真实范围)的特性,它为每个市场建立了一个特定的阈值,证明其作为真正趋势指标的实力。
解码市场动态:白色柱状图述说着交易者渴望理解的故事。当价格行动未能突破ATR阈值时,这些白色柱状图发出警告信号。它们揭示了支撑这一动态的强大力量的缺失,表明可能出现反转或区间波动模式。由于ATR阈值参数默认设置为1,您可以轻松识别缺乏信心的动态,避免错误突破,保

Delta Book指标是一种强大的市场分析工具,结合了成交量差异(Volume Delta)和订单簿(order book)信息,以侦测股票、期货和加密货币等金融市场的价格波动。需要注意的是,要充分发挥Delta Book的潜力,需要获得实时成交量数据和订单簿信息。 Delta Book的主要特点是其先进的市场分析策略,使交易员和投资者能够根据有关市场参与者行为的详细信息来识别趋势和交易机会。以下是一些有关描述Delta Book指标的提示和重要方面: 成交量差异:成交量差异是特定时间段内购买(需求)和出售(供应)的成交量之间的差异。这一指标定量衡量了买家和卖家之间的不平衡,有助于识别市场买卖压力的变化。 订单簿:订单簿是市场上所有买卖订单的实时记录。它显示了交易员愿意购买和出售资产的价格,以及他们愿意以这些价格交易的资产数量。Delta Book使用订单簿信息来分析市场参与者的行为。 价格流动:Delta Book有助于识别价格流动,即资产价格如何受成交量差异和订单簿的变化影响。这对于理解买入和卖出订单如何影响价格波动至关重要。 趋势和逆转:基于成交量差异和订单簿信息,Delta

多货币和多时间框架指标 MACD。 仪表板可以显示传统(真实)MACD 和 MetaTrader 中内置的 MACD。
在面板上,您可以看到指标的当前状态 - MACD 线的移动方向、它们的交点以及带有指标图表的弹出窗口。 在参数中,您可以指定任何所需的交易品种和时间范围。 扫描仪还可以发送有关线相互交叉以及线穿过零电平的通知。 通过单击单元格,将打开给定的符号和句点。
因此,您可以轻松扫描所有时间范围的所有货币对和交易品种,以找到 MACD 主线和信号线或零水平的交叉点。
显示/隐藏仪表板的热键默认为“D”。 默认情况下,启用/禁用弹出图表的热键为“C”。 用于切换图表“1”和“2”上的箭头的热键。 MACD(移动平均收敛/发散)指标(或“振荡指标”)是根据历史价格数据(最常见的是收盘价)计算得出的三个时间序列的集合。 这三个系列是:MACD 系列本身、“信号”或“平均”系列以及“背离”系列(两者之间的区别)。 MACD 系列是价格系列的“快速”(短期)指数移动平均线 (EMA) 和“慢速”(较长周期)EMA 之间的差异。 平均数系列是 MACD 系列本身的 EMA。

Smart Liquidity Levels is a valuable tool for identifying optimal liquidity levels, enabling retail traders like us to strategically set our stop-loss orders. T he essential tool for traders seeking to maximize their trading success. The liquidity level is a critical component of inner circle trading (ICT). It assists us in determining when and how we should enter the market. Watch the video for detailed instructions. Here's why understanding liquidity levels is crucial in trading and how our


Understanding the levels of the previous day or week is very important information for your trading.
This indicateur allow to draw Previous day High/Low Previous week High/Low
Congifuration High & Low for: Previous day, week Line Style, color Label position, size, color Any questions or comments, send me a direct message here https://www.mql5.com/en/users/mvonline
FREE

I've combined two trading strategies, the Order Block Strategy and the FVG Trading Strategy, by utilizing a combination of the FVG indicators and Order Blocks. The results have been surprisingly effective.
This is a two-in-one solution that makes it easy for traders to identify critical trading zones. I've optimized the settings so that all you need to do is install and trade; it's not overly complex to explain further. No need for any usage instructions regarding the trading method. You shou

Fair Value Gap Sweep is a unique and powerful indicator that draws fair value gaps on your chart and alerts you when a gap has been swept by the price. A fair value gap is a price gap that occurs when the market opens at a different level than the previous close, creating an imbalance between buyers and sellers. A gap sweep is when the price moves back to fill the gap, indicating a change in market sentiment and a potential trading opportunity.
Fair Value Gap Sweep indicator has the following
FREE

Engulfing Candle Detector
Detectable pattern Double Candlestick Patterns Bullish Engulfing
The first candle is black candle. The second candle opens with a gap below the real body of the black candle but rallies upwards to close above the real body of the black candle. In other words, the second candle's real body completely engulfs the first candle's real body Bearish Engulfing
The first candle is white candle. The second candle opens with a gap above the real body of the white candle but
FREE

The Market Structures Pro indicator finds and displays 5 (five) patterns of the Smart Money Concepts (SMC) system on the chart, namely:
Break Of Structures (BoS) Change of character (CHoCH) Equal Highs & Lows Premium, Equilibrium and Discount zones with Fibo grid High-high, Low-low, High-low and Low-high extremes
Patterns are displayed for two modes - Swing and Internal and are easily distinguished by color on the chart. Internal mode features higher contrast colors, finer lines, and sm

Chart Walker Smart Lines (CWSL) by Chart Walker Smart Lines is a MetaTrader 5 (MT5) indicator that revolutionizes technical analysis by offering a suite of powerful features to enhance your trading experience. This intelligent tool is designed to automate various aspects of chart analysis, providing traders with valuable insights and saving time on manual tasks. Key Features Automatic Channel Drawing: Smart Lines takes the hassle out of drawing trend channels by automatically identifying and
FREE

Switch Tray 是提供给交易员的常用交易对快捷托盘工具,可置于图表的底部,可自行设置常用交易对。
1、可设置您的常用交易对的快捷切换按钮,默认【EURUSD/GBPUSD/XAUUSD/USDJPY/USDCHF/USDCNH】,/ 斜杠为分隔符,当前所在图表的交易对为蓝色按钮显示。其他为默认颜色,可设置多个交易对需看您的屏幕长度来决定。 2、每个交易对的按钮上还配有 某交易对的已开仓手数。 3、多周期快捷切换按钮,全周期【1M/2M/3M/4M/5M/6M/10M/12M/15M/20M/30M/1H/2H/3H/4H/6H/8H/12H/1D/1W/1MN】。1分钟、5分钟、1小时、4小时分别标有特殊颜色进行呈现。
FREE

This MT5 chart trend checker cuts through the noise of market volatility to provide a clearer picture of trends and price movements. It includes the following features that can provide more clarity during market assessments: 1 customizable multi-period moving average Optional Heikin-Ashi candles 3 switchable focus modes Distinct colors for easy analysis
Link to MT4 version: https://www.mql5.com/en/market/product/106708/
This indicator shows your preferred moving average from multiple time fr
FREE

This indicator is great for trading many different pairs. The indicator itself uses mathematical models of augmented accuracy, but for now they are optimized for some currency pairs. Many settings can be configured in the initial settings. There are many icons for visualization. He displays his solution on a graph using various icons. There are several types of icons. In the tester it works fine by default in the settings. It is already configured by default. Happy bidding.

The Session Volume Profile indicator displays the distribution of trade volume across price levels for a specific trading session. It visualizes areas of high and low trading activity, helping traders identify support and resistance zones. The profile's peak, known as the Point of Control (POC), represents the price with the highest traded volume.
The inputs of the indicator:
volumeBars(Row Size) : Determines the number of price bins or rows for the volume profile. A larger number results in

Introducing Candle Feeling Indicator for MetaTrader 5 - Your Ultimate Solution for Accurate and Timely Analysis! Built with more than two decades of programming experience, this indicator allows you to follow the complexities of financial markets with confidence and accuracy.
Key Features: High Precision: Identifies trend reversals with unparalleled accuracy, ensuring you stay ahead of market shifts. Analysis: All the information you need from the structure of a candle Beautiful appearance

This indicator displays MTF (Multi-Time Frame) Candles on your Chart. It helps to see the overall Trend of Market.. It also help to MTF Analysis in fast way because you dont need look in many Time-Frames.. You get 4TF Bars/Candles on your current chart.. It can help you to identify trend or Reversal early as you get overall picture at one place...
Customizable Settings are : 1. Where to place MTF Candles.. 2. Show or Hide for each Candle 2. Time-Frame for each Candle
FREE

This Indicator works as a momentum oscillator however it is most used to surf the trends. Despite of being an oscillator, MACD (Moving Average Convergence/Divergence) doesn't work with over limit conditions (such as OverBought or OverSold). Graphically it's shown as two lines and an histogram with the diference of them. Standard metatrader has this indicator, however with only the two lines and without the histogram. This way it is much easier to read and uderstand it.
FREE

Property of Vertical Capital Edition: Gugol_Quants About USA INDEXES QUANT_INDICATOR: This is a indicator created by math modulation to be used as a trading tool, which was developed in MQL. (MT5) This indicator is for use only with US500(S&P500), NAS100(Nasdaq Composite) and US30(Dow Jones). Signals are activated on "Open" Candle. It’s based on Intraday/Swing Trades whose main timeframe is H1, H2, H3 and H4. However you can use it with other assets by testing with the appropriate settings. *
FREE

This is a trend follwing indicator, where you can find signals, when there's a crossover between the lines. When current price is above the lines, you are on a long term situation and when price is below the lines, you are on a short one. Period of calculations can be edited. So, with this, if you add other indicators to filter bad signals, you can have a good profitable strategy.

The bullet indicator gives accurate direction of the market structure, it will indicate to you the exact direction whether it be the market is in a downtrend or if it's in an uptrend it will give you that information which will inturn benefits you by saving you the time it takes to analyse that structure, this indicator works on a timeframes and it's most favourable on higher timeframes.
How it works: -The green arrow will be at the support of the structure indicating buys -The red arrow will
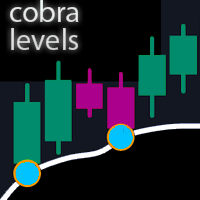
眼镜蛇等级
这是 6 组级别,具有两种频率模式,适用于通用市场,包括外汇、加密货币、商品、nifty 和banknifty。 它们是在对金融工具进行最佳研究后出版的。
上层称为U1至U5,下层称为D1至D5
在正常情况下,市场可能会在内部通道中驱动至 U3 或 D3,在波动情况下,市场可能会在外部通道 U4 至 U5 或 D4 至 D5 中驱动。 当价格达到 U3 U4 U5 或 D3 D4 D5 时,反转的可能性非常高,交易者应等待蜡烛图收盘以确认入场,并可以在有效的风险管理下进行交易。
该指标允许您通过指标设置中的自定义选项来改变级别。 用户可以通过添加 + 或 - 点来自定义级别
1. 他们正在处理时间范围:仅 M1、M3、M5、M15、H1 和 H4。
2.适合日内、波段、仓位交易方式
3. 与任何其他指标相比,根据研究帮助找到最佳超买和超卖转折点
4. 动态水平:水平值每分钟都会变化,但当价格在任何情况下超过标准达到这些水平时,就会出现一个循环,并且可以看到反转。
5. 包含提醒广告推送通知
有关交易策略的更多信息,您可以通过

基于William Gann理论构建的指标,它在与360度周期的主要角度相对应的价格上绘制水平线。 此指标基于William Gann的著名理论,重点关注被认为是强烈价格反转水平的主要角度。内嵌的主要角度有:30、45、60、90、120、180、220、270、310和360。 特性: 角度自定义:用户可以按需从输入列表中添加或删除角度。 外观自定义:选择颜色并决定是否显示或隐藏特定线条。 高精度:该指标旨在提供准确的指针和使用方便。 建议:建议与其他技术分析技巧结合使用该指标,以确保更好的结果。
.
.
.
.
.
.....................................................

"Timechannel"似乎是一款强大而多功能的技术分析工具,专为希望深入了解多个时间段内价格波动并做出更准确决策的交易员而设计。您提到的主要功能和好处都非常引人注目,对于渴望在金融市场上最大化潜力的严肃交易员可能非常有价值。以下是一些关键要点:
1. **高级多时间段分析**:同时分析不同时间段内的价格波动的能力对于获取全面的市场洞察至关重要。这有助于识别长期趋势、短期机会和理想的入场/出场点。
2. **可定制的价格通道**:用户可以调整指标的参数,根据其偏好和交易策略自定义价格通道。这包括设置通道宽度、颜色和样式。
3. **自动趋势检测**:Timechannel配备了先进的算法,可以自动检测不同时间段内的趋势。这使交易员能够轻松识别上升趋势、下降趋势和盘整。
工作原理:
1. **资产选择**:交易员选择他们想要使用Timechannel进行分析的资产。
2. **时间框架配置**:配置多时间段分析的所需时间框架。这可以包括每日、每小时和分钟图表等。
3. **参数定制**:交易员可以根据自己的偏好自定义指标参数,如通道宽度、颜色和

Channel Universal knows how to correctly build a forex channel and forms a classic trading strategy, it is easy to execute, therefore it is accessible even to beginners. Price channels work equally well on any trading assets and timeframes, they can be used both independently and with additional confirmation from oscillators and market volumes.
If you look at the price and try to identify the simplest visual patterns, you will immediately see that the price almost never moves in a straight

The Target Go indicator tracks the market trend, ignoring sharp market fluctuations and noise around the average price. Catches the trend and shows favorable moments for entering the market with arrows. The indicator can be used both for pips on small periods and for long-term trading. The indicator implements a type of technical analysis based on the idea that the market is cyclical in nature.

The Trend Sikorsky indicator contains an entire trading system, processes information from several technical instruments and the appearance of its signals is the final result of the calculation. The indicator itself evaluates how strong a signal appears in the market and when to change direction, signals this, and the trader can only make a trading decision. This indicator works on all timeframes. You need to understand that any indicator is only a visual form of a signal. Currency pairs never

The Risk Trend indicator simplifies the decision-making process by recognizing reversals using a built-in algorithm and then confirming signals at support/resistance levels. Implements a type of technical analysis based on the idea that the market is cyclical in nature.
Thus, the indicator tracks the market trend with great reliability, ignoring sharp market fluctuations and noise around the average price. The indicator can be used both for pips on small periods and for long-term trading.

The Hrum indicator was created to neutralize temporary pauses and rollbacks. It analyzes price behavior and, if there is a temporary weakness in the trend, you can notice this from the indicator readings, as in the case of a pronounced change in trend direction. Entering the market is not difficult, but staying in it is much more difficult. With the Giordano Bruno indicator and its unique trend line, staying on trend will become much easier!
Every rise and every fall is reflected in your emot

Unlock the Power of Market Analysis with Precision Are you ready to take your trading to the next level? The "Institutional Volume Profile" indicator is here to empower your trading decisions like never before. Key Features: Custom Volume Profiles : Plot volume profiles effortlessly by simply adding horizontal lines or Fibonacci tools on your MetaTrader 5 chart. There's no limit to how many profiles you can create. Insightful Visualization : The indicator beautifully displays crucial information

The Sinas indicator for Forex can be used both for pips on short periods and for long-term trading. It tracks the market trend, ignoring sharp market fluctuations and noise around the average price. Catches the trend and shows favorable moments for entering the market with arrows. The indicator implements a type of technical analysis based on the idea that the market is cyclical in nature.
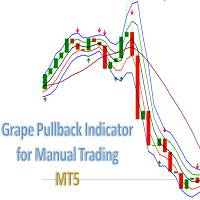
Indicador Grape Pullback for Manual Trading. Indicator (arrow) Type Strategy (Pullback) for all Symbols and Periodicity, Preferably from 30M periodicity. Can be used for manual trading. The indicator i s determined by strategies that is based on criteria for the location of candlesticks in the channel and for the Rsi and Market facilitation index indicators. Its workspace corresponds to channel of 3 bars of Bill Willians with a channel extension . BUY when there is a Green Arrow. StopLoss below

我们正在开发一种最适合分析交易性能的技术指标。它可以在同一图表上显示所有货币对和不同幻数分类的交易统计数据。您可以指定时间范围、幻数、特定货币对或所有货币对的利润统计曲线进行分析。您还可以点击跳转至订单位置并查看订单详情,这大大提高了使用体验。 主要参数: 在图表上注释:在图表上显示开/平仓位,悬停可查看订单详情 允许通过双击移动:点击您想观察的柱形位置一次,将在主窗口的左下角显示订单的时间信息。再次点击相同位置可以移动到相应的订单位置。这个指标功能,提升了交易体验。目前不同货币对需要手动更改窗口中显示的货币对,下一个版本将能够改为完全自动适配。双击可以直接移动,但需要半秒或更长的间隔。双击间隔过快可能会弹出设置窗口。跳转后,图表中间会显示一条红色垂直虚线,这是您选择的订单的平仓位置。 跳转同步:跳转位置时统计图表同步 双向佣金:支持开仓或双向的佣金计算 统计幻数:指定统计用的幻数,0表示不指定 统计所有货币对:选择统计所有货币对,结合幻数过滤 统计所有货币对:自定义统计特定货币对,0表示当前图表的货币对,不区分大小写 指定时间范围或统计整个交易历史 指定统计的开始时间:可以指定统

Point and Plot: The Anchored VWAP with Channel Bands tool is designed for traders of all levels, from beginners to seasoned professionals. Point to the price level you want to anchor to, plot the horizontal line, and watch as this versatile tool transforms your trading approach. User-Friendly Interface : Navigate the tool effortlessly with a user-friendly interface that ensures you never miss a crucial detail. Real-Time Analysis : Make informed decisions in real time with dynamic data that upda

Visual guide which divides the 24 hours into three trading sessions. The default setting is to show Asian , London and New York sessions. But, the session start and end hours can be adjusted as required.
The indicator is useful to develop trading strategies by making it easy to see the market behavior during the three sessions.
Inputs Time Zone Start and End hours (Please provide values in HH:MM format, like 02:00, not like 2:00. Both the hours and minutes should have 2 digits) Time zone
Camarilla Pivot Points is a math-based price action analysis tool that generates potential intraday support and resistance levels. Pivot price values are stored in output buffers within this indicator, enabling any Expert Advisor to utilize this indicator's data for trading purposes. This indicator offers the potential for developing numerous strategies. To explore some of these strategies, please visit the following websites: https://www.babypips.com/forexpedia/camarilla-pivot-points https:
Equalizer MT5 is a trend indicator that can be used as: trend filter tigger entry trailing stop Trend filter : with blue histogram we have bull market; with red histogram we have bear market and; with gray histogram we have consolidated market. The tigger : with the increase in the size of the histogram bars we can have possible entry points into a trend. The trailing stop : in a trend, when the size of the histogram bars increases we can move the stop loss to the price bar corresponding to the
FREE

Hi All ! I want to share with you my favorite indicator to identify strong trend bias. It helps me a lot with my entries and exits. You can use it on any market and any instrument. It works best on daily tiimeframe 1D but you can also use it on 1H and be carefull with lower timeframes This indicator uses MACD, RSI and Stoch. The idea is simple, when MACD crosses above a Signal line and RSI > 50 and Stoch > 50 we consider the trend is going UP on the opposite we consider its DOWN Feel free to us
FREE
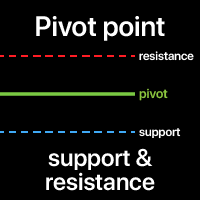
A Pivot point is used to determine the overall market trend. The pivot level itself is the average of the high and low, and the closing price from the previous bar.
On the next bar trading above the pivot point is thought to indicate ongoing bullish sentiment, while trading below the pivot point indicates bearish sentiment.
The pivot point is the basis for the indicator, but it also includes other support and resistance levels that are projected based on the pivot point. All these levels h
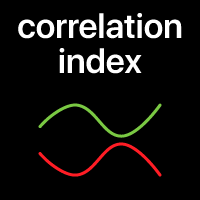
Correlation value between two Symbols. A value of +1 means a complete positive correlation; A value of -1 means a complete inverse correlation; A value of 0 means there is no explicit correlation (prices do not depend on each other, or the correlation is random); My #1 Utility : includes 65+ functions | Contact me if you have any questions In the settings of the indicator, you can configure: Symbols (currency pairs) to be used in calculations.
Leave one value empty if you want one of the
Simple alert system which will alert you on your mobile terminal, email and on the chart whenever RSI crosses below the overbought level or above the oversold level. Use this alert system, so you don’t have to watch the chart all day for the RSI levels to break.
INPUTS: 1. RSI Period- (Default is 14). Number of candles the RSI indicator will look back for the calculations. 2. OB Level- (Default is 70). This is the Overbought level or Upper level for the RSI indicator. 3.

The "Alligator" indicator is a powerful technical analysis tool designed to assist traders on the MetaTrader 5 (MT5) platform in identifying market trends and potential price reversal points. This indicator is based on a concept developed by Bill Williams, a renowned technical analyst in the world of trading. How the Indicator Works: The Alligator indicator operates by using three Moving Average (MA) lines with different periods. These three lines are: Jaws: This is a Moving Average line with a

The Trendline Automatic indicator is an advanced technical analysis tool specifically designed to assist traders in identifying critical levels in the financial markets through the automatic drawing of support and resistance trendlines on price charts. With its automatic capabilities, this indicator saves traders time and effort in analyzing price movements, allowing them to focus on making better trading decisions. Key Features : Automatic Drawing of Trendlines : This indicator allows traders t

This indicator is designed based on the Moving Origin indicator
When the moving origin indicator breaks the price, this indicator gives a signal
It is useful for better viewing of signals and analysis on them
Attributes: Can be used in all symbols Can be used in all time frames Too many signals Simple and quick settings Easy way to work
Settings: period: like moving average settings alarmShow: If you want to receive an alert in Metatrader after receiving the signal, enable this setting
a
FREE

首先,值得强调的是,这个交易工具是非重绘、非重画和非滞后的指标,非常适合专业交易。
在线课程,用户手册和演示。 智能价格行动概念指标是一个非常强大的工具,既适用于新手,也适用于经验丰富的交易者。它将超过20个有用的指标合并到一个指标中,结合了高级交易思想,如内圈交易员分析和智能资金概念交易策略。该指标侧重于智能资金概念,提供有关大型机构交易方式的见解,帮助预测它们的动向。
它在流动性分析方面尤其擅长,有助于理解机构的交易方式。它擅长预测市场趋势,并仔细分析价格波动。通过将您的交易与机构策略对齐,您可以更准确地预测市场走向。该指标多才多艺,擅长分析市场结构,识别重要的订单区块,并识别各种模式。
它擅长识别BOS和CHoCH等模式,理解动量的转变,并突出显示供需强劲的关键区域。它还擅长发现强大的不平衡,并分析价格创造更高高点或更低低点的模式。如果您使用斐波那契回撤工具,该指标可以满足您的需求。它还可以识别相等的高点和低点,分析不同的时间框架,并通过仪表板显示数据。
对于使用更高级策略的交易者,该指标提供了工具,如公平价值差指标和优惠和折扣区域的识别。它特别关注高时间框架订单

//--- input parameters input int InpFastEMA = 12; // Fast EMA period input int InpSlowEMA = 26; // Slow EMA period input int InpSignalSMA = 9; // Signal SMA period input ENUM_APPLIED_PRICE InpAppliedPrice = PRICE_CLOSE; // Applied price
一款集结了传统MACD和MQL平台的两种指标结合版本,可以高效的分析市场走势,更有效,更简洁,更直观。 感谢你的购买与使用,有更好的建议请留言在评论区内,我将第一时间回复,在此祝贺你在市场里赚到足够的钱。

//--- input parameters input ENUM_TIMEFRAMES InpPeriod = PERIOD_D1; // Period input int InpBandsShift = 15; // Shift
一款在图标中显示其他任意周期蜡烛图收线的指标,可以在任意周期内使用,省去了频繁更换图表周期的烦恼,同界面的显示为你分析市场,持仓订单的开仓与平仓提供高效的便捷服务,可以高效的分析市场走势,更有效,更简洁,更直观。 感谢你的购买与使用,有更好的建议请留言在评论区内,我将第一时间回复,在此祝贺你在市场里赚到足够的钱。 我是新蜀山李少侠,欢迎你的使用与分享,300字的描述有点难,要堆文字堆够300字的描述。

This indicator automatically identifies demand and supply zones on a number of 1000 candles or more, and you can change that number of settings.
It also carries a high level of accuracy in describing the type of each zone, as it contains:
Weak areas .
Untested areas . Strong areas . Role-taking areas . Areas tested + number of times visited . Areas to which a return is expected, depending on the direction . The indicator contains alert zones.
For signals and more free indicators, you ca
FREE

Let us introduce you to a new era of neural indicators for financial markets! Intelligent Moving is a unique indicator that trains its neural network in real time! You no longer need to look for the optimal indicator parameters for each specific situation. No more late signals. The artificial intelligence is able to adapt itself and predict any market movements.
Visually, the indicator is drawn as a main solid moving average line, two dotted lines of standard deviations and signal arrows. For
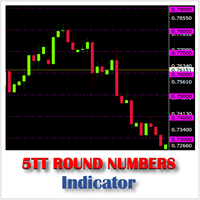
Like Support and Resistance levels, Round Numbers refer to price levels ending in one or more zeros, such as 125.00, 1.0350, 0.8750, 74.50, etc. These are psychological levels where financial institutions and traders expect price to either stall, retrace or breakthrough. On a price chart these figures are generally considered to rule off levels at the 50 and 100 mark. 5TT Round Numbers Indicator makes it absolutely easy for the trader to identify these levels on the chart without the laborious a

About the Proinsta78MT5 Indicator
The dots show a strong direction of movement, if there are no dots, then the movement changes or there will be a trading corridor with an exit. The profit depends on the timeframe, the larger it is, the more you can earn on the movement. I close on average after every 150-200 points.
I have shown the conditions for the signal in the form of screenshots in the screenshots 1-2photo section. Also in the third photo, the signals are visible and marked on the gr

The Jackson Auto Candlestick Pattern . It a powerful price action tool which auto detect and alert a hided powerful candlestick patterns . It came with few different chart skins. You can use this indicator alone to make profit, but it powerful when you combine it with trendlines, You can download The Jackson Auto Trendlines for free Link : UCRW695l9Wgg2ucnnf5DL5Vw List of Candlestick Pattern it detect 1. Bullish & Bearish Engulfing's 2. Top and Bottom Tweezer 3. Bullish and Bearish Harams 4.
MetaTrader市场是 出售自动交易和技术指标的最好地方。
您只需要以一个有吸引力的设计和良好的描述为MetaTrader平台开发应用程序。我们将为您解释如何在市场发布您的产品将它提供给数以百万计的MetaTrader用户。
您错过了交易机会:
- 免费交易应用程序
- 8,000+信号可供复制
- 探索金融市场的经济新闻
注册
登录