适用于MetaTrader 5的新技术指标 - 73
Support Resistance Inversion is based on supports and resistance to find the points in which the currency will probably go in a defined direction. Inputs: Alarm ON/OFF: turn on or off alarm on screen. The indicator draws an arrow pointing the direction to follow based on when the price cross or bounce on a support or a resistance. Support Resistance Inversion can help you to choose the moment to do your trades in a specific direction, strengthening your trading strategy.

Retracement Trend is based on a priceaction logic and volume of the lasts bars. Inputs: Alarm ON/OFF: turn on or off alarm on screen. The indicator draws an arrow pointing the direction to follow based on when a specific pattern of bar's volume is found and the price has a specific direction. Retracement Trend can help you to choose the moment to do your trades in a specific direction, strengthening your trading strategy.
MA Break Point is based on moving average and a priceaction logic to find the points in which the currency will probably go in a defined direction. Inputs: Alarm ON/OFF: turn on or off alarm on screen. The indicator draws an arrow pointing the direction to follow based on when the currency cross a moving average and verify the trend with another ma. MA Break Point can help you to choose the moment to do your trades in a specific direction, strengthening your trading strategy.
Chart Reverse Point is based on moving average, volumes, and a priceaction logic to find the points in which the currency will probably go in a defined direction. Inputs: Alarm ON/OFF: turn on or off alarm on screen. The indicator draws an arrow pointing the direction to follow based on when a specific pattern of bars is found near the moving average and the volumes are higher than a minumun defined by the indicator. Chart Reverse Point can help you to choose the moment to do your trades in a sp

The Martinware Manual Trading Helper indicator is aimed at helping people start their lives in manual trading. It can be used to display both some generic images at the right side of the graph, where custom operational remarks may be displayed or just a blank rectangle hiding the chart while backtesting. Moreover, it can periodically play a list of sounds. To show a blank rectangle, let the first image name input field empty and select the desired color. To show one or more custom images inste
FREE

This tool draws candles at different TIMEFRAME from the 'pattern' displayed on the screen... ...In the 'Standard Chart' M1, he draws the Candles in M15. For example: The 'Standard Chart' in M1, the 'OHLC' in M15 are drawn the Candles (boxes) of M15 behind the candles of M1.
Download the demo version... ...see how it can help you notice Support/Resistance points as well as good moves with highs and lows in the 15M.

Value Chart indicator presents the Price evolution in a new form. This indicator, Price Momentum , was developed taking all the calculations presented in the book " Dynamic Trading Indicators " by Mark W. Helweg and David Stendahl (2002). The technique involves de-trended Prices from a user-defined Period of analysis and the addition of a Volatility index correction. The result is an Oscillator with 3 zones: Fair Price Value, Overbought/Oversold and Extremely Overbought/Oversold zones. Adding th
FREE

For those who hate candlesticks in lower timeframes (M1 through M15) we "invented" a clean new way to follow Price movement and displacement (volatility) called Price Trail Chart . The big "secret" is to get rid of those annoying candle wicks and draw the whole complete candle without them, this way we get a cleaner chart and a new view of the Price Path. No Open or Close markings, just LOW's and HIGH's, full body candle.
Additionaly we inserted a Volume monitor from our Best Downloaded indicato
FREE

This indicator signals significant price movements compared to the average over a defined period, making it easy to spot potential trading opportunities. It takes into account not only price movements but also the spread value of each symbol, providing a more accurate picture. You can use this indicator for multiple symbols, up to 8 pairs, as specified in the input parameters. With its flexible settings, traders can easily customize it to suit their individual preferences and trading styles. It'

Turn Over is a direction indicator for determining the trend.
The Turn Over indicator visually “unloads” the price chart and saves analysis time: there is no signal - there is no deal, if a return signal appears, then the current deal should be closed.
The indicator implements a strategy for trend trading, filtering and all the necessary functions built into one tool! The principle of the indicator is that when placed on a chart, it automatically determines the current state of the market, an

The Market Momentum indicator is based on the Volume Zone Oscillator (VZO), presented by Waleed Aly Khalil in the 2009 edition of the International Federation of Technical Analysts journal, and presents a fresh view of this market valuable data that is oftenly misunderstood and neglected: VOLUME. With this new approach of "seeing" Volume data, traders can infer more properly market behavior and increase their odds in a winning trade.
"The VZO is a leading volume oscillator; its basic usefulness

The Netsrac Correlation Trade Indicator (NCTI) was created to trade correlations between different assets. NCTI offers five different strategies to do this. Five different correlation trading strategies with two or three assets Fast access your assets with one click via asset buttons Your profit/loss at a glance Configurable alerts via screen or mobile You can use the indicator with every timeframe. Higher timeframes give fewer but better signals. If you have some questions or suggestions - plea
FREE

The Netsrac Correlation Trade Indicator (NCTI) was created to trade correlations between different assets. NCTI offers five different strategies to do this. Five different correlation trading strategies with two or three assets Fast access your assets with one click via asset buttons Your profit/loss at a glance Configurable alerts via screen or mobile You can use the indicator with every timeframe. Higher timeframes give fewer but better signals. If you have some questions or suggestions - ple

An indicator to fetch the market shocks from the economic events directly to the chart. It indicates the surprise factor (actual published data minus the expected value) exactly on the right candlestick! The bigger the value of the indicator, the higher price gap will be. The indicator's value and sign gives a great opportunity to forecast the amount and direction of the price gap. Do not miss any opportunity by setting an Expert Advisor to place buy or sell orders based on this indicator's valu

Quieres ser rentable y que un indicador haga los análisis por ti.. este es la indicado tener mas seguridad en tus operaciones si respetas los parámetros este indicador fue diseñada y modificado por mas de 6 meses, escogiendo y modificando la para tener un mejor resultado y entradas mas precisas. que te ayudara a asegurar tu entrada y poder sacarle muchas ganancias. los parametros: Entrada cuando La linea roja o verde cruce hacia arriba Puede entrar apenas comencé a cruzar Compra o venta Observa
***Please Give Some Feedback and Reviews*** This is an indicator which shows the direction and the strength of the selected Symbol based on the two outputs, Signal and Value. The Signal indicates the directions as Buy equals 2(Blue) and Sell equals 1(Red). The Value output indicates the strength of the signal between -100 to 100. This indicator is both trend and fast preliminary indicator by choosing appropriate parameters. Indicator uses the Tick Volume as the hitting catalyst, which by choosi

VR System – 这不仅仅是一个指标,它是一个用于金融市场交易的完整、平衡的交易系统。该系统建立在经典交易规则和指标 移动平均线 和唐奇安通道 的组合之上。 VR System 考虑了进入市场、维持市场头寸的规则以及退出头寸的规则。简单的交易规则、最小的风险和明确的指令使 VR 系统成为对金融市场交易者有吸引力的交易策略。 设置、设置文件、演示版本、说明、问题解决,可以从以下位置获取 [博客]
您可以在以下位置阅读或撰写评论 [关联]
版本为 [MetaTrader 4] 该交易系统由两个组合指标组成:移动平均线和唐奇安通道。 Donchian channel – 该指标旨在确定金融工具的当前状态,根据确定趋势或横盘的经典规则构建。新的局部最大值高于前一个,新的局部最小值高于前一个,则认为该金融工具处于“上升趋势” 新的局部最大值低于前一个,新的局部最小值为如果我们不能应用上述任何规则,则认为该金融工具存在不确定性或持平。 Moving Average – 移动平均线旨在确定市场的进入点。该指标具有三个不同周期的移动平均线。慢速移动平均线 - 显示进入市场的方向。移动平均线—

一個取決於流動性和移動平均線的指標 > 它為您提供了 98% 的正確買入和賣出決策。以及關閉交易的時間。 PRICE 會不時增加 > 並且第一個 EA 何時啟動取決於此指標將超過 2k。 1-何時建立買入或賣出頭寸(取決於兩條線 X 的交叉點,點數計算取決於選擇的框架) (十字架應該在彩色區域之外)蠟燭必須在十字架期間或(第一個或第二個到第五個)之後接觸十字架 直接在十字下確認最後條件時計算的點數(見截圖表格..使用加號工具計算面積) 2-下一個區域外的黃線開始曲線是平倉信號 框架上的 3 件作品(1m 5m 10m 15m 30m 1h 4h 每天每周和每月)(所有對>和所有商品)專業推薦 4- 在獲得 ..(55%) 的收益後放置追踪止損 5 建議手 0.01 每筆交易為 1000 美元堆棧 分配不同對的位置示例:(usdjpy eurgbp gold) 6-有時蠟燭沒有觸及十字架(兩條線交叉如圖所示)但它高於預測賣出位置的十字架(其完美的賣出交易條件)(藍色區域,您正在等待賣出打開)注意: (應用所有先前的條件,沒有蠟燭觸摸條件) 7-有時蠟燭沒有觸及十字(兩條線如圖所示)但它

For those who struggle with overbloated Volume Profile/Market Profile indicators, here is a solution that contains only the Point of Control (POC) information. Super-fast and reliable, the Mini POC indicator presents this vital information visually within your chart. Totally customizable in splittable timeframes, type of Volume, calculation method, and how many days back you need.
SETTINGS Timeframe to split the POCs within the day. Volume type to use: Ticks or Real Volume. Calculation method .
FREE

Reversible indicator.
You need to understand that any indicator is just a visual waveform. Currency pairs never rise or fall in a straight line. Their rises and falls are alternated by pullbacks and turns.
The Reversible indicator contains an entire trading system, processes information from several technical instruments and the appearance of its signals is the final calculation result. The indicator itself evaluates how strong a signal appears in the market and when to change direction, sign
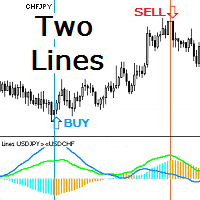
Индикатор показывает две линии динамики движения двух инструментов. Если один из коррелирующих инструментов убегает, другой будет его догонять. Этот принцип даёт точки входа в сделку по их кроссу или для синхронной покупки и продажи в парном трейдинге. Гистограмма индикатора показывает значение дистанции между линиями инструментов. При уменьшении и увеличении дистанции гистограмма принимает разные цвета. Треугольный значок показывает текущее состояние линий: расхождение ( Divergence ) или схо

One of the most popular methods of Technical Analysis is the MACD , Moving Average Convergence Divergence, indicator. The MACD uses three exponentially smoothed averages to identify a trend reversal or a continuation of a trend. The indicator, which was developed by Gerald Appel in 1979 , reduces to two averages. The first, called the MACD1 indicator, is the difference between two exponential averages , usually a 26-day and a 12-day average.

使用趋势筛选指标释放趋势交易的力量:由模糊逻辑和多货币系统提供支持的终极趋势交易解决方案! 使用趋势筛选器(由模糊逻辑提供支持的革命性趋势指标)提升您的趋势交易。 它是一个强大的趋势跟踪指标,结合了超过 13 种高级工具和功能以及 3 种交易策略,使其成为使您的 Metatrader 成为趋势分析器的多功能选择。 限时优惠:趋势筛选指标终身仅需 50 美元。 ( 原价 250$ ) (优惠延长) 体验趋势筛选器 100% 无需重新绘制的准确性,确保您的交易决策不受过去价格变化的影响。 释放多时间框架和多货币功能的多功能性,使您能够以无与伦比的信心在外汇、商品、加密货币和指数领域进行交易。 利用 Trend Screener 的综合策略套件增强您的交易: - 趋势跟踪策略和趋势延续策略 :趋势筛选器的趋势跟踪策略提供清晰的趋势延续信号,让您有效捕捉趋势走势并管理风险。 - 反转策略和早期入场点策略 :趋势筛选器的反转策略可检测市场方向的潜在变化,使您能够预测趋势反转并利用疲弱的市场趋势。通过早期入场点,您可以在潜在的趋势变化之前定位自己 获取可观的利润。 - 倒卖策略: 趋势筛选器的倒卖

The Inside Bar pattern is a very well known candlestick formation used widely by traders all over the world and in any marketplace. This approach is very simple and adds a little confirmation candle, so it adds a third past candlestick to the count to confirm the direction of the move (upward or downward). Obviously, there is no power on this candlestick formation if the trader has no context on what it is happening on the market he/she is operating, so this is not magic, this "radar" is only a
FREE

Recommended TimeFrame >= H1. 100% Non Repainted at any moment. Use it carefully, only with Trend Direction.
Trading Usage: 2 Variants: as Range System or as BreakOut System (Both Only With Trend Direction)::: (Always use StopLoss for minimise Risk);
[1] as Range System: (Recommended) in UP TREND: - BUY in Blue Line , then if price goes down by 50 points (on H1) open Second BUY. Close in any Profit you wish: TrailingStop(45 points) or Close when Price touches upper Gold Line.
in DOWN TREND
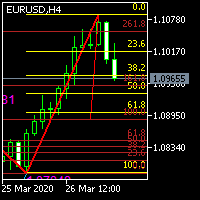
Two-way Fibonacci indicator. The function is to facilitate traders to find their retracement and entry and exit points. The principle of the workpiece of this indicator: First, draw a V shape for the high and low points formed by the fractal indicator, and then draw a golden section proportional line for the V line, which can be applied to any period and currency pair.
ECHO INDICATOR V2.2 Update
A top-quality indicator works with trend and pattern. The tool is a good assistant for the traders use various levels in trading.
When price approaches a level, the indicator produces a sound alert and (or) notifies in a pop-up message, or via push notifications. A great decision making tool for opening orders. Can be used any timeframe and can be customized
Easy to trade It implements alerts of all kinds It implements a multi-timeframe
Trade with Trend + signa
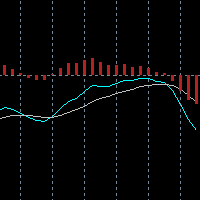
The built-in MACD does not properly display all the different aspects of a real MACD. These are: The difference between 2 moving averages A moving average of (1) A histogram of the difference between (1) and (2) With this indicator you can also tweak it as much as you want: Fast Period (default: 12) Slow Period (default: 26) Signal Period (default: 9) Fast MA type (default: exponential) Slow MA type (default: exponential) Signal MA type (default: exponential) Fast MA applied on (default: close)

BeST_Hull MAs Directional Strategy is a Metatrader Indicator based on the corresponding Hull Moving Average.It timely locates the most likely points for Entering the Market as well as the most suitable Exit points and can be used either as a standalone Trading System or as an add-on to any Trading System for finding/confirming the most appropriate Entry or Exit points. This indicator does use only the directional slope and its turning points of Hull MAs to locate the Entry/Exit points while it

Vol2DPOC volume vol2DOC-任何时间段的动态水平音量指indicator
指标的主要设置: 交易量来源-为交易量选择数据(tick或real) DPOCOn-启用/禁用指标 DPOCFrom-计算开始日期 DPOCTo-结算结束日期 该指标允许您手动选择图表上的区域,以分析最大交易量随时间的变化。
您可以通过使用垂直线并沿图表移动它们来执行此操作。 或者通过在指标设置中设置特定日期。
这是一个非常有用的指标,以更精确地确定价格何时离开修正并恢复趋势运动。
该指标显示3个缓冲区,以便指标可以连接到ea交易。 该指标与水平交易量指标IVolX和其他趋势工具一起,将帮助您显着增加有利可图的交易数量,并将您的交易提升到一个全新的水平!
Unique trend trading algorithm with advanced filtering and many features which should become a part of your trading arsenal. This indicator can give you also trading advisors (with take profit target), success rate scanner and much more. TrendMagiX PRO comes with built-in multi-pair and multi-timeframe scanner which is fully adjustable. User can select own symbols and time-frames to monitor. + ALL the features of standard TrendMagiX indicator
Important information For additional detailed inform
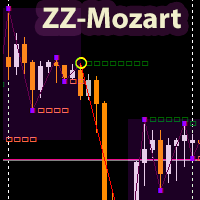
The ZigZagMozart indicator is based on the calculation of the advanced ZigZag. Displays trend break points (white squares), resulting points (yellow circles), flat zones (purple dots). The only indicator parameter: “ pivot in points ” - the minimum shoulder between the peaks of the indicator. The indicator uses market analysis based on the strategy of the famous modern trader Mozart. https://www.youtube.com/watch?v=GcXvUmvr0mY.
ZigZagMozart - works on any currency pairs. If the parameter “pivo

Users of PVRSA / PVA certainly already know the Dragon indicator and its use.
The Dragon works as dynamic support and resistance and can be used for scalper or trend follower.
In addition to the Dragon we have the WGT (fast) and EMA (slow) averages that can show immediate movement and also trend movement.
Stay tuned for the Dragon's inclination!
The indicator can be used on any asset/currency pair and can be customized according to the trader's interest.
See also my volume analysis indicato

货币强度计,为您提供当前哪些货币强,哪些货币弱的快速视觉指南。 该仪表测量所有外汇交叉货币对的强度,并对它们进行计算以确定每种货币的整体强度。 我们根据 28 对的趋势计算货币的强度。
.货币强度计是指标的通用名称,用于显示您是在处理强货币还是弱货币。这种基于算法的指标依赖于各种货币对的汇率来提供每种货币的强弱程度。
通过访问我们的 MQL5 博客,您可以下载该指标的免费版本。 购买前试用,不受 Metatrader Tester 限制: 单击此处
1. 文档 所有趋势货币强度文档(说明)和策略详细信息均可在我们 MQL5 博客的这篇文章中找到: 单击此处。
2. 联系方式 如果您有任何问题或需要帮助,请通过私信联系我。
3. 作者 SAYADI ACHREF,金融科技软件工程师,Finansya 创始人。

This indicator displays the wave structure of the market in the form several wave levels nested in each other. For each of these levels an automatic preliminary (draft) marking of waves in Elliott's style (123..., ABC... etc.) is created. This markup is completely automatic and absolutely univocal. The indicator is especially useful for beginner wave analysts, because among all the possible versions for wave marking, it allows you to immediately take the most adequate version as a ba

The Mono Waves indicator is designed to display the wave behavior of the market on a chart. Its appearance is presented on slide 1. This indicator uses the PPPC (Point-Percent Price Channel) indicator, which can be downloaded for free from the Market . When the market moves up, the upper border of the price channel is built on High candlestick prices (for more details, see the description of the PPPC indicator at the link given above). The higher the High prices rise
FREE

The advantage of the Price Surfing indicator is the search algorithm for the extremes of the price of the instrument. Most indicator signals are located at local maximums and minimums of the price . For the convenience of the trader, the potential profit of each signal is displayed on the chart. The indicator does not repainting, the signal appears after the bar is closed. MT4 version https://www.mql5.com/en/market/product/46054 Parameters SendAlert - enable alert of a new signal SendEMail

A useful dashboard that shows the RSI values for multiple symbols and Time-frames. It can be easily hidden/displayed with a simple click on the X top left of the dashboard. You can input upper and lower RSI values and the colours can be set to show when above/below these values. The default values are 70 and 30. You can choose whether the dashboard is displayed on the right or left of the chart. If you want to have 2 dashboards on the same chart you must input a different name for each. The sca
FREE

Several techniques use volume as an important point in the trade. Whether to indicate strength, exhaustion, pullback weakness, among others.
In chief I quote Richard Wyckoff's theory, which said about the importance of looking price and volume.
However, there are several possibilities to filter what is volume that should be noticed.
PVRSA/PVA users use an indicator with specific colors, which assist in identifying the volume and type of movement that the price has made.
Will the high volume
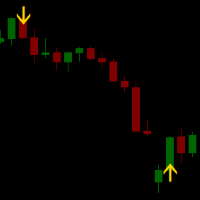
Signal RSI printa no gráfico os melhores momentos de entrada segundo o indicador RSI.
No gráfico aparecerá uma seta indicando o momento e a direção de entrada para a operação. O encerramento da operação se dá ao atingir o lucro esperado ou o stop. Se estiveres com uma operação aberta e aparecer outra seta de sentido inverso, inverta a mão e aproveite! Amplamente testado em gráficos de mini índice e mini dólar, bem como ações e FIIs.
Gráficos recomendados: 5, 10, 15 min.

FX Volume:从经纪商视角洞察真实市场情绪 简要概述
想要提升您的交易策略? FX Volume 可提供零售交易者和经纪商的持仓实时数据——远早于诸如 COT 之类的延迟报告。不论您希望获得持续稳定的收益,还是想在市场中多一分制胜的砝码, FX Volume 都能帮您识别重大失衡、确认突破以及完善风险管理。立即开启体验,让真实的成交量数据为您的交易决策带来革新!
1. 为什么 FX Volume 对交易者格外有用 极具准确度的早期预警
• 快速捕捉有多少交易者正在买入或卖出某个货币对——比大多数人提前一步。
• FX Volume 是 唯一 能够整合多家零售经纪商真实成交量数据并以简洁方式呈现的工具。 强力风险管理
• 及时识别多头或空头仓位的巨大不平衡,这往往预示着潜在的趋势反转,帮助您更自信地设置止损和目标位。
• 独家而真实的数据让每一次交易决策更具可靠性。 优化进场与出场点
• 发现“过度集中”的交易(大多数交易者都在同一方向),并通过真实成交量来确认突破。
• 避免依赖常见指标可能带来的误导信号,而是利用真实的实时成交量。 适配各种交易策略
• 将 FX

This is RSI with alarm and push notification -is a indicator based on the popular Relative Strength Index (RSI) indicator with Moving Average and you can use it in Forex, Crypto, Traditional, Indices, Commodities. You can change colors to see how it fits you. Back test it, and find what works best for you. This product is an oscillator with dynamic overbought and oversold levels, while in the standard RSI, these levels are static and do not change.
This allows RSI with alarm and push notifica
FREE

The TRIXs Indicator is the combination of the TRIX (Triple Exponential Moving Average) indicator with the addition of a SMA (Simple Moving Average) signal. It provides signs of trend continuity and the start of a new trend.
The entry and exit points of operations occur when the indicator curves cross.
It performs better when combined with other indicators.
FREE

One of the Best Volume Indicators, with the addition of a Moving Average for weighting volume over time average.
If the "Current Candle" Volume is X% greater than the Moving Average value, we will have a sign of increasing volume.
It can be a sign of Beginning, Continuity, Reversal or Exhaustion of the Movement.
Fully configurable and all options open, you can color and set ALL values as you see fit.
The 'Volume Break' shows volume bars in the same color as the candlestick, in addition to b

Combining the best of Price Action , Directional Movement , and Divergence / Convergence analysis, the Candle Color Trend is the easy and reliable way to identify the direction of the trend. The indicator automatically paints the candles according to the premise that the upward trend is defined by prices that form a series of ascending tops and bottoms. On the other hand, the downward trend is defined by prices that form a series of descending tops and bottoms.
Color Trend is certainly one of
FREE

The TRIXe Indicator is the combination of the TRIX indicator (Triple Exponential Moving Average) with the addition of an EMA (Exponential Moving Average) signal. It provides signs of trend continuity and the start of a new trend.
The entry and exit points of operations occur when the indicator curves cross.
It performs better when combined with other indicators.
FREE

The Point-Percent Price Channel (PPPC or PP Price Channel) indicator is designed to display on the chart a channel whose width is specified both as a percentage of the current price and in points. Its appearance is presented on slide 1. When the market moves up, the upper border of the channel is built at the price of High candles. In this case, the lower boundary follows the upper one at a strictly specified distance. When the price touches the lower border of the channe
FREE
Trend Reversal Indicator This indicator works effectively in the early stages of a trend, helping to identify trend reversals. Trading Recommendations: The signal is generated on the current candle. It is recommended to enter the trade on the next candle. The target profit is 20-30 pips. There are three stop-loss options: Exit the trade upon receiving an opposite signal. Place the stop-loss directly behind the signal. Set the stop-loss at the nearest high or low. It is advisable to avoid tradin

Bearish/Bullish divergent bar . One of the signals of the "Trade Chaos" system of Bill Williams. (First wiseman)
When bar moving away from the "Alligator" indicator and there is divergence on the Awesome Oscillator indicator, it shows a potential point of movement change.
It is based on the opening/closing of the bar, the position relative to the previous ones, the Alligator and AO.
When trading, the entrance is at the breakthrough of the bar(short trade - low of bar, long trade high of bar), a
Forex Driver is a great tool for detecting peaks and valleys on a chart. This indicator uses a modified peak and trough detection algorithm. This algorithm includes the Fractals indicator and the ZigZag indicator.
This tool should be used to analyze peaks and valleys, as well as to detect patterns, or for other purposes. You can use this powerful tool for your own purposes at your own risk.

The Price Control indicator determines a short-term and long-term trend. The analysis is based on the selected timeframe. The indicator shows the points of opening deals for sale or purchase, and also indicates the direction of the trend at:
Short term Long term
The indicator not only signals an immediate purchase or sale. It indicates a short-term and long-term trend. The indicator allows you to examine in more detail the real and historical market trends!

Squat bar.
One of the signals of the "Trade Chaos" system of Bill Williams.
It is calculated based on the difference in price changes and tick volume.
Strengthens the signal of the "Bearish/Bullish Divergent Bar (First Wiseman)" if it coincides with it or is nearby.
Tested in comparison with the original program "Investor's Dream".
For more effective development of the system, read and see the materials of Bill Williams.
In the settings you can choose the color of bar.

Benefits: A new and innovative way of looking across multiple timeframes and multiple indicators on any chart. Provides instant multi-timeframe analysis of any market. i.e. forex currency pairs, cryptocurrency pairs, commodities, etc. It offers precise indications across multiple timeframes of volatility as measured by RSI, ADX and STOCH within one chart. Helps you determine high probability trading setups. See example strategy in comments. Can see bullish/bearish volatility building across mult
Learning to trade on indicators can be a tricky process. Volatility Index indicator makes it easy by reducing visible indicators and providing signal alerts Entry and Exiting the market made possible through signal change Works well with high time frame to reduce market noise simplicity in trading guarantees success and minimal losses Our system creates confidence in trading in case of any difficulties or questions please send message

指标(振荡器)显示(可选):Spearman的秩相关系数,Pearson的线性相关系数,Kendall的秩相关系数和Fechner的符号相关系数。 当价格超出超买和超卖水平时,该振荡器显示了可能的市场反转点。 有四种方法可以对获得的值进行额外的滤波:简单的、指数的、平滑的、线性加权的。 酒吧关闭后,值是固定的,而不是重新绘制的历史。 使用 Spearman 计算时,我们得到已知的 SSRC,但在该指标中计算的是真实系数,并对计算结果应用平滑,从而避免重新绘制值。 参数:
Calculation mode/period/price - 模式/期间/用于计算相关系数的价格 Smoothing period/method - 周期/平滑结果值的方法

Tabajara Rules for MT5 , baseado em Setup Tabajara do professor André Machado, indica a direção do mercado com base em médias móveis quando tem velas na mesma direção da média móvel.
O indicador contém a regra de coloração aplicada aos candles e a média móvel.
O indicador permite a alteração dos parâmetros: período e método de suavização da média móvel.
O indicador permite a alteração das cores dos candles ( contornos e preenchimento) e da média móvel.
O modelo do professor André Machado conté
FREE
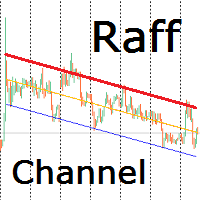
Индикатор строит канал Раффа на основе линейной регрессии. Красная линия тренда может использоваться для принятия решения о покупке или продаже внутрь канала при подходе цены к ней. Настройками можно задать ширину канала по коэффициенту отклонения от базовой линии или по максимальному и минимальному экстремуму. Так же можно включить продолжение канала вправо от текущих цен. Индикатор канала регрессии Раффа – удобный инструмент, значительно облегчающий работу современного трейдера. Он может быть

The HammerStar indicator is designed to search for the Hammer and Shooting Star patterns on charts of any currency pairs.
Hammer Downward trend.
The lower shadow is not less than 2 and no more than 3 times larger than the body.
There is no upper shadow, or it is very short (no more than 10% of the candlestick range).
The color of the body in the long game is not important, with the short - white hammer is much stronger than the black one.
Confirmation is suggested.
Shooting Star Uptrend.
The u
FREE

With this indicator user can determine not just pivot like turning points. User able to spot trading ranges boundaries and support-resistance levels. In a strong trend the reverse signals also gives us excellent entry points. Recommended user settings: In the Attis volume: look back period : 1 or (3) MA_Lenght 99. ( of course one can play with the settings and get tailored signals... as you need)
FREE

reference:
"High Frequency Trading, A Pratical Guide to Algorithmic Strategies and Trading Systems (Aldridge, Irene)"
Characteristics The calculation of VWAP is in accordance with the literature. 4 types of VWAPs, daily, monthly, yearly, moving. Note: Daily is the most popular form, the calculation is performed from the beginning to the end of each trading session (Market benchmark). In the moving, the calculation is carried out from n periods past to the current period, as with the famous m

*Non-Repainting Indicator Bruce Webb Explains How To Use Bruce's Price Predictor In Detail And Free Forex Strategy https://youtu.be/hfoB1tZZpTo Bruce's Price Predictor is an indicator that shows precise price reversals. A great arsenal to add to any chart. Bruce's Price Predictor points price reversals with high degree of accuracy and it is great for scalping on the 1min time frame, Or swing trading on the 1hr time frame. Buy and sell arrows are shown on the chart as for entry signals. They do

Volume pressure and oscillator overbougth - oversold condition togedther. Signals appears on chart. Turnig points, trading ranges, support- resistance levels also. Change parameters in the trendscalp settings. TTF bars can be set: 8, or, 15, or 45, 150. Greather periods are very useful at strong support - resistance areas. IF ONE OF OUR FREE INDICATOR IS NICE TO YOU, FEEL FREE TO BUY AT LEAST OUR CHIEPST PRODUCT TO DONATE US. "Lots of small peace can be a mountain" ( nathan rothschild, john len

Sentiment Liner This is a steroidised Daily-Weakly-Monthly high-low and open, must have indicator. With this stuff user can determine the average of (daily-weakly-montly) open levels. 4 example: if you in day mode switch the average to 5, you get the 5 day sentiment. In weakly mode turn the average to 4, than you get the 4 weak sentiment,...so on. Naturally one can us as a simple day-week-month high and low indikator. S1: high S2: low Pivot: open, Average: averager
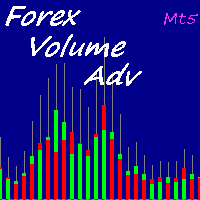
Forex is the most liquid market in the world. For this reason real volumes are not available. Some indicators use the number of ticks, in other cases the broker can supply volumes informations but they will be only data about that broker. Volumes are important becase they will form the price and volatility of the market. Using an algorithm this indicator can give you a very good approximation of the volumes for each candle.
How to read the indicators?
This version provides you many visualizati
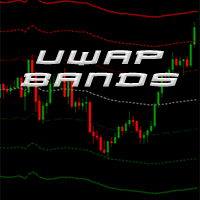
This indicator plots VWAP with 4 Standard Deviation bands. In finance, volume-weighted average price (VWAP) is the ratio of the value traded to total volume traded over a particular time horizon (usually one day). It is a measure of the average price at which a stock is traded over the trading horizon. VWAP is often used as a trading benchmark by investors who aim to be as passive as possible in their execution. Many pension funds, and some mutual funds, fall into this category. The aim of usi
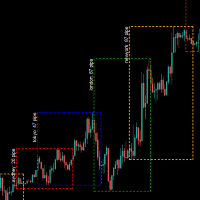
外汇市场时间指标,包含 悉尼,东京,伦敦,纽约 4个市场时间 考虑了服务器夏令时切换,以及各市场的夏令时切换 input ENUM_DST_ZONE InpServerDSTChangeRule = DST_ZONE_US; //服务器端夏令时切换规则 按照纽约还是欧洲 input int InpBackDays=100; // 最多绘制天数,出于性能考虑 input bool InpShowTextLabel=true; // 显示文本标签 哪个市场,当前波动点数 input color InpTextColor=clrWhite; // 标签文本颜色 input int InpTextFontSize=8; //标签文本字号 input bool InpFillBack=false; //方框背景色是否填充 input bool InpShowStat=false; // 显示各市场时间波动统计信息 input ENUM_LINE_STYLE InpLineStyle=STYLE_DOT; // 方框线样式
input bool InpShowWeekda

Multi-currency, multi-timeframe, harmonic pattern indicator AB = CD. Supports sending push notifications about signals to a mobile device, messages on e-mail, as well as messages using alerts on all available currency pairs and timeframes. This indicator was based on the indicator Harmonic ABCD Universal. Version for MetaTrader 5: https://www.mql5.com/en/market/product/44972 . See also: Harmonic ABCD Universal for MetaTrader 4 . Using modern software development methods has made the indicator a

Scaner indicator.
Currency pairs never rise or fall in a straight line. Their rises and falls are alternated by pullbacks and turns. Each growth and each fall is reflected in your emotional state: hope is replaced by fear, and when it passes, hope reappears. The market uses your fear to prevent you from taking a strong position. At such times, you are most vulnerable.
Everything will change if you use the Scaner indicator.
The Scaner indicator was created to neutralize temporary pauses and r

Market tops are characterized by Volume Climax Up bars, High Volume Churn and Low Volume Up bars (also called Testing). Market bottoms are characterized by Volume Climax Down bars, High Volume Churn and Low Volume Down bars (Testing). Pullbacks, in either up or down trends, are similar to market topping or bottoming patterns, but shorter in duration and with simpler volume patterns.
FREE
MetaTrader 市场 - 在您的交易程序端可以直接使用为交易者提供的自动交易和技术指标。
MQL5.community 支付系统 提供给MQL5.com 网站所有已注册用户用于MetaTrade服务方面的事务。您可以使用WebMoney,PayPal 或银行卡进行存取款。
您错过了交易机会:
- 免费交易应用程序
- 8,000+信号可供复制
- 探索金融市场的经济新闻
注册
登录