适用于MetaTrader 5的新技术指标 - 7

This isn't just an indicator; it's a top-tier market analysis tool that combines the power of various technical analysis techniques into one package. Perfect for traders seeking precision and clarity in their trading decisions. Key Features: HiLo Activator: Easily capture the essence of market trends. This component differentiates between bullish or bearish markets, helping you to be on the right side of the move. MACD (Moving Average Convergence Divergence): Quickly identify changes in market
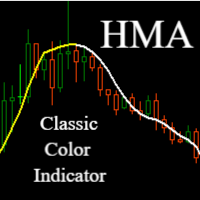
Hull Moving Average (HMA) - Faster and More Precise Trend Tracking
Hull Moving Average represents a revolutionary approach to trend analysis that overcomes the common shortcomings of traditional moving averages. This advanced indicator, developed by Alan Hull, practically eliminates the lag typical for standard moving averages while maintaining exceptional signal smoothness.
Key Benefits:
Significantly faster response to trend changes than traditional moving averages Minimal lag while mainta
FREE

A tool for creating Bill Williams indicators Our tool provides the ability to set Bill Williams indicators on a chart with a mouse click. - The Awesome Oscillator (AO) indicator helps to assess the driving force of the trend. - Alligator indicator — determines the current state of the trend and possible entry and exit points. - Fractals indicator — helps to identify significant levels - Accelerator Oscillator (AC) indicator — shows the change in trend acceleration. - Market Facilitation Index
FREE

Discover the Power of the QDOTRAXY Indicator: Your Key to Precise Trading Decisions! Have you ever imagined having a powerful ally that combines advanced technical analysis with real-time alerts to maximize your market operations? We introduce ULTRA ADVANCED, the indicator that revolutionizes how you make buy and sell decisions. Why Choose QDOTRAXY? Unmatched Accuracy: QDOTRAXY combines multiple technical indicators (MACD, Bollinger Bands, SAR, and Moving Average) to generate highly reliable si
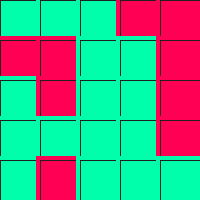
QUICKVIEW MT5 A simple indicator to instantly highlights asset variations, delivering crystal-clear market insights at a glance. Effortlessly track multiple assets with visual simplicity, enabling quicker, smarter, and more confident trading decisions daily.
Key Benefits Real-Time Asset Tracking :: Instantly monitor multiple assets simultaneously, never missing a critical market move. Flexible and Intuitive Display :: Personalize your view, displaying assets exactly as you want—clear, concise
FREE
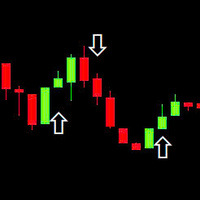
This indicator is based on the RSI (Relative Strength Index) to identify potential Breakout points and draw arrows on the chart to suggest buy/sell signals. Use RSI to find breakout signals. Draw Buy/Sell arrows on the chart. Send alerts when there is a trading signal. Buy (Orange Arrow - 0xFFAA00): When a buy signal appears. Sell (Blue Arrow - 0x0000FF): When a sell signal appears. DRAW_ARROW: Used to draw arrows on the chart.
FREE

The THREE DRAGONS is a technical indicator that portrays three mystical Chinese dragons flying through the price chart:
1. The Green Dragon (SeaGreen): - The most agile and fastest of the three - Reacts quickly to market direction changes - Usually leads the movements
2. The Red Dragon (Tomato): - Moves with balance between speed and caution - Confirms movements initiated by the Green Dragon - Its interactions with the Green Dragon may indicate opportunities
3. The Black Dragon (Black): - Th
FREE

This indicator overlays higher timeframe candles on the lower timeframe chart. You have option to make the candles Hollow (outline) or Solid (fill) for better visibility and analysis of your charts. You can easily change your chart timeframes ( to any lower timeframe than the indicator input) while using this indicator for true multi-timeframe analysis.
Features: Timeframes from 1 Min to 1 Month Minimal Inputs Customize candle body, color etc.
Inputs: Candles Period - Choose the timeframe f
This indicator collects and systematizes the data about the spread. Its code was profiling several times and optimized in such a way that despite the presence of graphics not to slow down the work of the MT5 terminal. In addition, the indicator provides for the mode of complete invisibility (while the indicator continues to collect data and save it). Having returned to the visual display mode, you can see the work done by him.
Advantages and capabilities of the SpreadFix indicator: 1. Collects
FREE

SuperTrend Indicator for MetaTrader 5
Ride Trends Like a Pro — Never Miss a Move Again Description:
The SuperTrend Indicator is your ultimate companion for mastering trend-following strategies. Designed to cut through market noise, this powerful tool combines the precision of Average True Range (ATR) with adaptive trailing stops to pinpoint trend reversals, confirm breakouts, and keep you on the right side of the market. Whether you’re trading forex, stocks, crypto, or commodities, the SuperTr
FREE

Maximize your trading performance with Dd-uP , a revolutionary indicator based on an Exponential Moving Average (EMA) smoothing. This indicator is represented by a distinct yellow line on your charts, making it easy to identify market trends and providing precise and reliable trading signals. Key Features: Advanced EMA Smoothing : Track market trends with an EMA smoothing that reacts quickly to price changes, offering precise and real-time analysis. Buy and Sell Signals : Receive clear signals w

TendencyLine Indicator - Market Trend Analysis (An exclusive indicator by PPF - Past Project Future)
General Description TendencyLine is a technical indicator developed by PPF - Past Project Future to help traders identify the prevailing market trend. It overlays a trend line based on a user-selected moving average on the price chart and displays a colored histogram that signals the trend direction.
Main Features Trend Identification: The indicator differentiates between bullish and bear
FREE
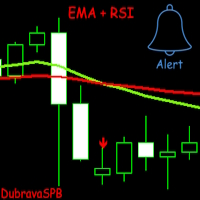
Introducing EMA + RSI – A Trading Indicator Combining Exponential Moving Average (EMA) and Relative Strength Index (RSI) Analysis. The indicator signals trade entries with arrows on the chart when two EMAs cross and the RSI meets the specified conditions.
It is initially optimized for the GBPUSD currency pair on the 1H timeframe, but users can customize it to fit their strategy. Key Features: Flexible settings: Users can adjust EMA length, choose the price for calculation, and configure RSI para

Utility of the Indicator Multifaceted Analysis : Allows for a comprehensive view of the market through different metrics (trend, volatility, momentum, risk, support/resistance). Trading Signals : Offers clear buy and sell signals, aiding traders in making entry and exit decisions. Risk Management : The risk buffer helps to assess when it is safe or risky to execute trading operations. Customizable Visualization : With multiple colors and chart styles, it becomes easy for the trader to interpre

Heiken Ashi Smoothed – The Ultimate Trend Filtering Indicator for MT5 Enhance Your Trading with Smoother Trends! The Heiken Ashi Smoothed indicator is a powerful tool designed for traders who want clearer trend signals while eliminating market noise. Unlike traditional Heiken Ashi candles, this smoothed version provides fluid, lag-free price action , making it perfect for swing trading, trend following, and long-term analysis. Key Features: Crystal-Clear Trends – Filters out market noise
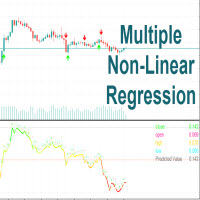
Multiple Non-Linear Regression This indicator is designed to perform multiple non-linear regression analysis using four independent variables: close, open, high, and low prices. Here's a components and functionalities: Inputs: Normalization Data Length: Length of data used for normalization. Learning Rate: Rate at which the algorithm learns from errors. Show data points: Show plotting of normalized input data(close, open, high, low) Smooth?: Option to smooth the output. Smooth Length: Length of
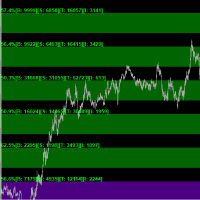
Key Features: • Multi-Zone Analysis: Track volume patterns across multiple customizable price zones • Real-Time Volume Tracking: Monitor buy/sell pressure as it develops • Dynamic Price Levels: Automatically adjusts zones around daily opening prices • Advanced Statistics: View detailed volume metrics and price action percentages
Technical Capabilities: • Volume Distribution Analysis - Buy/Sell volume ratios - Volume imbalance detection - Total trading activity monitoring - Price action directio
In the dynamic world of forex trading, technical analysis is an essential tool for traders seeking to navigate the complexities of the currency markets. One key element of this analysis is the interpretation of candlestick patterns, particularly the phenomenon of consecutive one-sided candles. These candles, characterized by a uniform direction — either completely bullish or bearish — offer significant insight into market sentiment and potential future movements. Understanding the implications o
This indicator automatically identifies and plots key support/resistance (S/R) levels on price charts using a hybrid algorithm combining fractal detection , price touch validation , and dynamic level managemen. Key Features
Support and Resistance Levels: Support levels and Resistance levels are drawn in red . Fractal-Based Detection: Levels are identified based on fractal highs and lows. Efficient Memory Handling: The number of levels is limited to 100 to avoid clutter. Cleanup on Deletion: All
The Volume-Weighted RSI (VW-RSI) is a powerful technical analysis tool that combines the traditional Relative Strength Index (RSI) with volume data to provide a more nuanced view of market conditions. By incorporating volume into the RSI calculation, the VW-RSI offers a unique perspective on price momentum, helping traders identify potential reversals, confirm trends, and filter out false signals. Below is a detailed explanation of the VW-RSI, its features, and why it stands out as a unique indi

Structure Levels (Highs & Lows) Indicator for MetaTrader 5
Decode Market DNA — Trade with Institutional Precision Description:
The Structure Levels (Highs & Lows) Indicator is your secret weapon to map the market’s hidden roadmap. Designed for traders who think in terms of price action and market structure, this tool automatically identifies critical swing highs and swing lows, transforming chaotic charts into a clear blueprint of support/resistance zones, breakout opportunities, and trend rev

Initialize RSI with period 2 above the closing price. Initialize EMA with period 20 above the closing price. Buy condition: RSI < 15 (oversold). Closing price of 4 consecutive candles > EMA (uptrend). Place BUY signal at the bottom of the candle. Sell condition: RSI > 85 (oversold). Closing price of 4 consecutive candles < EMA (downtrend). Place SELL signal at the top of the candle
FREE

AriMax – AI-Powered Trading Robot AriMax is a cutting-edge AI-powered trading robot designed to help traders maximize profits while minimizing risk. Utilizing advanced machine learning algorithms and real-time market analysis, AriMax identifies high-probability trade opportunities with precision and speed.
Key Features: AI-Driven Market Analysis – Analyzes market trends and patterns to make data-driven trading decisions.
Automated Execution – Places trades seamlessly with optimiz
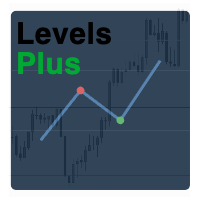
Levels Plus Indicator Overview The Levels Plus Indicator is a sophisticated and highly effective tool designed for traders who seek to identify key price levels in the market. This indicator combines multiple key levels and Volume Profile Point of Control (POC) lines to provide a comprehensive view of the market structure. Whether you're a day trader, swing trader, or long-term investor, the Levels Plus Indicator offers valuable insights that can help you make informed trading decisions. Key Fe
Tired of drawing opening range breakout line? Maximize your trading potential with the Range Breakout Indicator and the Opening Range Breakout (ORB) Indicator for MT5, two essential tools designed to enhance your trading strategy and boost your market performance. These powerful indicators allow you to profit from the explosive price movements that often occur at the opening of major stock indices, such as the DAX, DOW, NASDAQ, and S&P500. By leveraging the Opening Range Breakout Indicator, you

该指标在一个窗口中显示多个时间框架的趋势方向。如果多个时间框架的趋势一致,则会画出箭头。 您还可以切换到柱状图,显示当前时间框架的趋势。 该指标在图表上绘制入场点和近似出场点。
警告:由于该指标是多时间框架的,因此在策略测试器中使用时,应提前下载所有必要时间框架的报价。为了避免在测试器中长时间等待下载报价,您可以设置起始日期为 2025.01.01,并选择 “仅开盘价 ”或 “控制点 ”模式。
MT4的指标版本
指标特点 该指标不会重绘。历史图表上显示的内容将实时显示。 可用于交易任何资产:加密货币、股票、金属、指数、商品和货币。 适用于所有时间框架。 进场信号在新蜡烛图打开时出现,不会重新绘制。 退出交易的信号是暂时性的,因为通常情况下你可以用更多的利润完成交易。 左上方有一个详细的交易统计面板,可以将其最小化。 它使用特殊公式计算移动平均线,从而确定趋势方向。 为了不错过进入交易的信号,您可以在 “提醒 ”窗口或通过 “推送 ”接收通知。 适用于从初学者到专家的所有级别用户。
统计面板 记录信

ATR Power Levels Smart Support Resistance Indicator! What makes this indicator unique?
Unlike traditional support & resistance tools, ATR Dynamic Zones uses Adaptive ATR calculations to detect peaks & valleys with extreme accuracy. Once price breaks above or below a key level, the zone is automatically converted into a buy or sell area , giving traders a clear roadmap for smart entries & exits. How It Works:
Detects peaks & valleys dynamically using ATR-based price movement
Highli
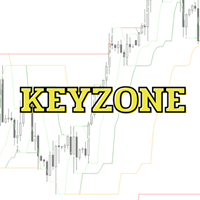
Keyzone 是一款专为 识别支撑和阻力水平 而设计的指标,共分为**四个关键级别:**3、8、21 和 89。这些级别是基于对 Smart Money Concept (SMC) 智慧资金概念 的高级优化,使其在保持简单性的同时,具备极高的交易效率。 凭借 简洁而强大的特性 ,Keyzone 可广泛适用于各种交易风格,包括:
剥头皮交易(Scalping) – 适合快节奏高频交易 波段交易(Swing Trading) – 捕捉中期价格波动 趋势跟随(Trend Following) – 把握长期市场趋势 仅需 四条关键线 ,交易者即可高效分析市场, 无需复杂的 SMC 概念 。即使是新手交易者,也能 快速掌握并灵活运用 Keyzone 进行交易!!!!!!!
如何使用 Keyzone 指标 震荡市场(区间交易) 在震荡市场中,Keyzone 水平充当 支撑和阻力区域 : 买入 :当价格在下方 Keyzone 反转时。 卖出 :当价格在上方 Keyzone 反转时。 这些水平提供了可靠的进场和出场点参考。 趋势市场 在趋势市场中,Keyzone 帮助交易者识别突破机会: 上升趋势
FREE

中文 (Chinese) 适用于MetaTrader 5 (MT5)的虫洞时间框架指标 不仅仅是另一个交易工具——它是您在金融市场中的竞争优势。专为新手和专业交易者设计,虫洞指标彻底改变了您分析数据和决策的方式,确保您始终领先一步。 为什么您需要虫洞指标 领先竞争对手: 同时在同一图表上查看两个时间框架的能力,让您始终比他人快一步。再也不用在不同图表之间切换,您需要的一切尽在眼前。 发掘隐藏的机会: 改变传统时间框架,发现其他交易者错过的模式。想象一下,您的H1图表在1:59 PM而非2:00 PM关闭,这让您在市场反应之前采取行动。或者调整5分钟图表的边界,从00:01到00:06分析蜡烛,而不是标准的00:00到00:05。这些微妙的变化可以揭示独特的市场动态。 获取可操作的见解: 借助检测趋势、反转和支撑/阻力水平的精密工具,虫洞为您提供自信交易所需的知识。 经验证的创新 虫洞指标并非基于猜测,而是尖端研究的成果: 利用机器学习分析市场低效性。 识别零售交易的集群以揭示隐藏的市场动态。 这些见解推动了一个结合专业级策略的指标开发。 虫洞如何赋能您 更快决策: 实时数据让您始终领先
FREE
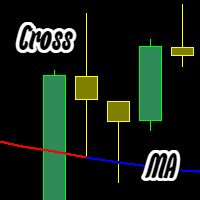
该指标绘制双色移动平均线(MA): 蓝色 — 前一根K线的开盘价和收盘价高于MA线。 红色 — 前一根K线的开盘价和收盘价低于MA线。 可自定义设置: MA类型(简单、指数、平滑、线性); MA周期; MA颜色变化时触发警报。 如有问题,请联系我们修正! bar cross Moving cross candle cross Moving cross bar cross MA cross candle cross MA cross bar cross Moving Average cross candle cross Moving Average cross bar 该指标绘制双色移动平均线(MA): 蓝色 — 前一根K线的开盘价和收盘价高于MA线。 红色 — 前一根K线的开盘价和收盘价低于MA线。 可自定义设置: MA类型(简单、指数、平滑、线性); MA周期; MA颜色变化时触发警报。 如有问题,请联系我们修正!
该指标绘制双色移动平均线(MA): 蓝色 — 前一根K线的开盘价和收盘价高于MA线。 红色 — 前一根K线的开盘价和收盘价低于MA线。
FREE

Volume Bar POC 指标 是一种创新工具,可以基于成交的点数交易量精确显示关键价格水平(控制点,POC)。该指标分析每根K线内的每个价格点,并显示最重要的价格水平,可用作强大的支撑和阻力区。非常适合日内交易和长期交易策略。 Volume Bar POC 指标如何工作? 该指标在每根K线形成过程中使用高级算法来计算POC: 在K线开启时创建表格 : 新K线开启时,指标会创建一个内部表格,包含以下数据: 价格 :K线高低范围内的所有价格水平。 成交量 :每个价格水平的点数交易量(tick volume)。 表格动态覆盖K线范围内的所有价格点。 在K线形成过程中更新表格 : 随着高点和低点的变化,新价格水平被添加到表格中。 当市场(买/卖报价)经过某一价格水平时,该价格水平的成交量会增加。 计算POC(控制点) : 指标持续监测哪个价格水平的成交量最大。 POC被定义为点数或交易量最多的价格水平。 此信息会动态更新,因此该指标始终显示K线形成过程中最活跃的价格水平。 主要特点和优势 : 点数成交量分析 :使用点数交易量,确保高精度并支持所有MetaTrader 5平台支持的市场。
此指標產生二元期權或外匯剝頭皮交易的入場訊號, 通常在圖表上,您會看到一個箭頭出現在最後一根蠟燭上或消失,這是正常的:指標正在處理數據,並讀取條件以發送進入訊號。情況每秒都在變化,因此訊號會出現和消失。這基本上是向交易者發出的通知,要求他們做好準備,因為可能進入的條件正在形成。在蠟燭結束時,如果條件得到確認,指標最終會在圖表上列印箭頭,並發出出現在特殊「彈出」視窗中的聲音警告:這是開啟交易(或選擇權)的時候。
營業時間和貨幣對:建議在參考貨幣市場開放時進行交易;對於歐元和英鎊貨幣對,建議在歐洲市場開盤時進行操作(8-17 gmt);對於美元貨幣對,建議在美國市場開盤時進行操作(14.30-21 gmt);對於澳元、新西蘭元和日元貨幣對,建議在亞洲市場交易時段進行操作(22-6 gmt)。
時間範圍:最佳時間範圍是 M5,也可以在更高的時間範圍內操作,重要的是不要在太低的時間範圍內操作(M1-M2)
到期日:1 根蠟燭(如果第一根蠟燭到期時沒有獲利,則允許開設第二個部位)。
此指標的表現為每月 ITM 訊號超過 70%:每日 ITM 訊號百分比範圍為 90% 至 50%

The Extreme Spike PRT Indicator is an effective tool for identifying sharp market fluctuations . It performs its calculations using the ATR (Average True Range) indicator and displays candles with extreme volatility in two categories: primary spikes and secondary spikes , within the Metatrader platform oscillator window. This tool assists traders in detecting intense price movements and conducting more precise analyses based on these fluctuations. Time Frame 15-minute - 1-ho

ZigZag Indicator for MT5
The ZigZag Indicator is a valuable tool available in MetaTrader 5, designed to highlight the highs and lows on a price chart. By marking pivotal turning points in price—commonly referred to as Pivot Highs and Lows (HH-HL-LH-LL)—it simplifies the process of identifying price trends. In any price movement, consecutive peaks and troughs are formed. Understanding these patterns correctly is essential for recognizing the direction of the overall market trend or short-term fl
FREE

Fair Value Gap (FVG) Indicator for MetaTrader 5
The Fair Value Gap (FVG) Indicator is an effective tool designed to spot trading opportunities in MetaTrader 5 by identifying imbalances in supply and demand. These imbalances, known as FVGs, emerge when the price moves aggressively. To explain simply, imagine three candlesticks: the gap between the first and third candlestick forms the " FVG ." This indicator highlights these gaps as dynamic boxes—green for bullish FVGs and red for bearish FVGs.
FREE
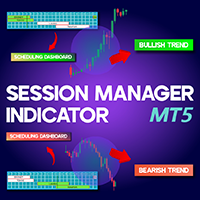
Session Manager Indicator MT5 Effective time management and understanding market activity are vital for traders in the fast-paced financial markets. Different trading symbols exhibit unique behaviors and levels of activity during specific time periods. The Session Time Manager indicator for MetaTrader 5 enables traders to monitor time and analyze price movements. This tool highlights key trading sessions—New York, London, Sydney, and Tokyo—by overlaying boxes on the price chart. «Indicator Insta
FREE

RSI on Moving Average Indicator for MT5
The RSI on MA Indicator integrates Moving Average Crossovers with the Relative Strength Index (RSI) to enhance trend detection and momentum analysis. By merging these technical elements, it improves precision in identifying market movements. The indicator displays two oscillating lines ranging from 0 to 100, making it easier to pinpoint buy and sell opportunities while clarifying trend directions. «Indicator Installation & User Guide» MT5 Indicator Instal
FREE

The Stochastic RSI (StochRSI) is a technical indicator that combines the characteristics of the Relative Strength Index (RSI) with the Stochastic Oscillator, resulting in a more sensitive tool that generates a higher number of trading signals. Developed by Tushar Chande and Stanley Kroll, the indicator was designed to overcome a perceived limitation of the traditional RSI: the low frequency of overbought and oversold levels activation (commonly 80 and 20), especially in less volatile assets. Ho
FREE

摘要 本指标使用多种计算方法绘制多个支撑和阻力水平的枢轴点(Pivot Points),允许自定义其外观,并在价格触及这些水平时提供警报。它适用于不同的时间框架,可以显示历史水平或仅显示当前水平。 概述 目的 :在图表上绘制动态枢轴水平(Pivot、S1-S4、R1-R4),帮助识别潜在的价格反转区域。 主要特性 : 支持7种计算方法(经典、Camarilla、Woodie、斐波那契等)。 可显示当前周期(今日)或过去周期的历史水平。 可自定义视觉效果(颜色、线条样式、宽度)并提供价格触及警报。 输入参数 时间框架 :选择计算枢轴点的基础周期(例如:日线、周线)。 计算模式 : 经典 1/2 :传统 (H+L+C)/3 公式并派生支撑/阻力。 Camarilla :使用前一周期的收盘价和价格范围计算较紧密的水平。 Woodie :结合当前开盘价。 斐波那契/斐波那契回撤 :对前一周期的价格范围应用斐波那契比率。 Floor :修改经典公式,增加额外的水平。 显示模式 :当前周期或历史周期的枢轴水平。 视觉自定义 :标签、价格标记、线条颜色/样式/宽度。 警报 :当价格触及水平时触发弹窗

Based on the Extreme Trend Indicator on Trading View converted for MT5. Usage of the Indicator is free, but if you want the source code, you can purchase the source code by messaging me.
Extreme Trend is an indicator that identifies when a new trend is forming and creates a trading signal. This indicator can be used for many markets, forex, gold etc. If you have any inquiries or want to create an EA using this indicator, you can message me.
FREE
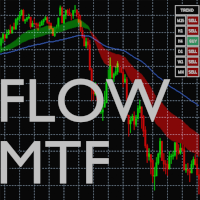
This indicator takes as parameters the periods for three moving averages (Short, Long, Very_Long) and displays them for the current timeframe: - in the form of a cloud (green if Short is greater than Long, red if Short is less than Long) - as a line for the Very_Long moving average. It also allows you to display the status (BUY or SELL) of these same moving averages but for the M15, H1, H4, W1 and MN1 timeframes. This information is summarized in the window titled "TREND", where, for each timefr
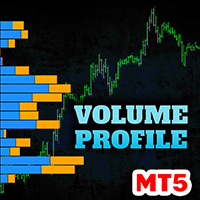
Contact me after payment to send you the user manual PDF file. Download the MT4 version here. Volume Profile Indicator A functional and useful tool that can improve your trading plan.
This indicator calculates volume in price levels(typical volume indicator shows only candle volumes).
With the volume of price levels, you can identify important areas that have the potential to reverse. You can also see the volume of support and resistance levels and decide on them.
Using volume profiles along

GammaLevels Indicator! What makes this indicator unique?
Unlike traditional support & resistance tools, ATR Dynamic Zones uses Adaptive ATR calculations to detect peaks & valleys with extreme accuracy. Once price breaks above or below a key level, the zone is automatically converted into a buy or sell area , giving traders a clear roadmap for smart entries & exits. How It Works:
Detects peaks & valleys dynamically using ATR-based price movement
Highlig

Overview The Waterfall Trading Indicator is a powerful momentum detection tool designed to identify high-probability trading opportunities across multiple timeframes. Built on pure price action analysis, this indicator provides clear, non-repainting signals that are especially effective for binary options and forex trading. Key Features Non-Repainting Signals : Based on real-time price action, ensuring reliable trade signals Multi-Timeframe Compatibility : Effective across all timeframes, with o
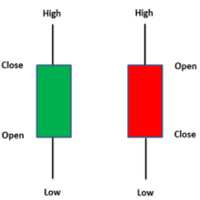
The indicator shows the strength of the trend if the green number is more than 50, you need to look for a signal to buy, and on the contrary, the red number is more than 50, you need to look for a sell,
The indicator is based on the Heiken Ashi candle
the indicator is suitable especially for scalping and medium-term trading
REMEMBER THE INDICATOR DOES NOT GUARANTEE A WINNER BUT IT HELPS TO MAKE CORRECT TRADING
THE RISK ON THE TRANSACTION WILL BE NO MORE THAN 3 PERCENT
FREE

As an ICT or SMC trader you must do top-down analysis, and you struggle to make template of drawing object on Metatrader just like you normally do on Tradingview. Well, Drawing Assistance indicator will make your top-down analysis much easier on Metatrader. Allow to design template for 3 timeframes. (HTF, MTF and LTF). Each objects drawn on chart will have the color, style and visibility individually by the timeframe it was drawn on. Save time as all analyzing is done on Metatrader chart. Shortc

Fibo Extrema Bands is a unique indicator that visually demonstrates when the market shifts into a trend and highlights key levels acting as support or resistance. It combines easy-to-read “stepped” extrema lines with Fibonacci levels (whose values can be adjusted in the indicator’s inputs), simplifying the search for entry and exit points. Install Fibo Extrema Bands to gain a powerful tool for trend analysis and for identifying critical price levels! This product is also available for MetaTrade
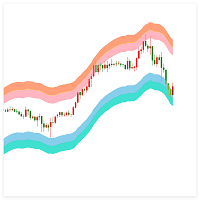
指标简介 : 波动区间指标旨在通过分析市场的历史价格数据,帮助交易者识别当前市场的波动范围。通过计算价格波动的上限和下限,交易者能够确定潜在的支持和阻力位置,从而为后续的交易决策提供依据。该指标特别适合用于震荡市场和高波动环境,可以有效帮助交易者捕捉价格突破区间的时机,从而优化入场和退出点。
应用场景 : 震荡市场 : 在震荡行情中,价格通常在某一特定区间内波动,波动区间指标能够帮助交易者识别该区间的上下限。当价格突破这些边界时,可能会出现新的趋势或反转,从而为交易者提供明确的入场或退出信号。 高波动市场 : 在高波动市场中,波动区间指标可以帮助交易者识别价格的潜在突破点。例如,当市场突然出现大幅波动时,波动区间可能会被迅速突破,波动区间的突破可能意味着新的趋势形成,交易者可以利用这一点进行交易。 趋势识别 : 在趋势市场中,波动区间的突破可能意味着当前趋势的加速或延续。当价格突破上限时,可能是上涨趋势的确认;当价格突破下限时,可能是下跌趋势的确认。 联系方式: https://www.mql5.com/en/users/zhihui_dianjin

This indicator is based on Mr. Mark Fisher's ACD strategy, based on the book "The Logical Trader."
- OR lines - A lines - C lines - Daily pivot range - N days pivot range - Customizable trading session - Drawing OR with the desired time Drawing levels A and C based on daily ATR or constant number - Possibility to display daily and last day pivots in color zone - Displaying the status of daily PMAs (layer 4) in the corner of the chart - Show the order of daily pivot placement with multi-day piv
FREE
A comprehensive MT5 trading performance indicator designed to provide real-time analytics of your trading activity on chart.
Key Features: - Dual tracking modes: Chart Symbol or Magic Numbers - Customizable display with toggle options for each metric - Adjustable font size for better visibility - Real-time updates with color-coded results
Performance Metrics: - Total Profit/Loss: Track overall performance - Total Trades: Monitor trading frequency - Win Rate: Measure trading success percentage
FREE
Spike Phantom – Best Spike Detector for PainX and GainX Volatility Spikes (Non-Repainting)
Tired of missing explosive market spikes? Want a powerful tool designed for trading PainX & GainX spikes on WellTrade? Spike Phantom is the ultimate non-repainting spike detector built to capture high-impact market movements with precision and speed . Designed specifically for PainX and GainX and Synthetic Pairs , this indicator provides real-time alerts for perfect entry and exit points. VPS recommend
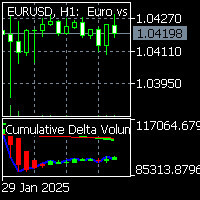
To get access to MT4 version please click here . This is the exact conversion from TradingView: "Cumulative Delta Volume" by "LonesomeTheBlue". The screenshot shows similar results from tradingview and Metatrader when tested on ICMarkets on both platforms. This is a light-load processing and non-repaint indicator. All input options are available. Buffers are available for processing in EAs. You can message in private chat for further changes you need. Thanks for downloading
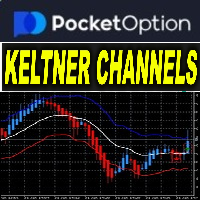
ocket Options Keltner Channel with MA v3.12 Indicator Name: Keltner Channel v3.12 – Advanced Trend and Signal Indicator
Version: 3.12
Release Date: 2024
Platform: MetaTrader 5 (MT5)
Category: Trend Indicators Overview
Keltner Channel v3.12 is a trend-following indicator that combines Keltner Channels with Moving Averages (MA1 and MA2) to identify breakouts, trend shifts, and momentum changes. This tool provides real-time buy and sell signals, visual markers, and alerts to assist traders in dec
Volonacci Indicator It is an indicator that combines Fibonacci and volume to determine the price direction This indicator helps you identify Fibonacci angles according to the strategy The Volonacci indicator is indeed an interesting combination of Fibonacci levels and volume. This indicator uses Fibonacci tools to identify potential support and resistance levels, and enhances this by using volume to confirm the strength behind the price action.
MT4 Version https://www.mql5.com/en/market/produ
VWAP Trend Pro (Volume Weighted Average Price) is a versatile trading tool that can be used effectively in several ways: This is an advanced Volume Weighted Average Price indicator that revolutionizes your trading experience by dynamically changing colors across scanned timeframes, providing real-time trend insights. The intuitive right corner scanner with three simple squares represents Monthly, Weekly, and Daily trends, each bordered by the current trend color and with background color indicat

very simple indicator to help with fast risk management during volatility.
~Displays: - stop loss in points of your choice. - take profit in points of your choice. - what lot size to risk on the trade relative percentage.
~Values that can be changed: - take profit points. - stop loss points. - risk in percentage. - color of lines. - width of lines. - linestyle. - buy / sell trade.
A simple Zig Zag indicator with added visualization of Higher High, Lower High, Higher Low, Lower Low. This indicator will be very helpful when working with support/resistance levels. The ZigZag indicator is a fundamental tool that will significantly help you navigate complex situations in the financial markets. By providing a clear visual representation of price movements and trends, it simplifies the analysis process and improves decision-making capabilities. Its role in identifying trends and
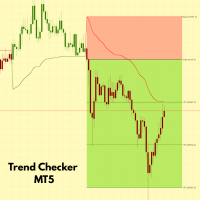
Trend Checker MT5 – Smart Indicator for Trend Detection and Optimal Trade Levels GammaTrend is an advanced technical analysis tool designed to help you trade with precision and confidence. This indicator leverages the Average True Range (ATR) and market closures to identify optimal entry points, set stop-loss levels, and determine potential profit targets. Key Features:
Clear Trend Identification – Helps you understand market momentum and direction.
Accurate Entry Signals – Use

Simple Japanese candlestick indicator
Contains 3 patterns: - bearish engulfing - bullish engulfing - doji
Only contains these 3 because after rigorous testing and trading (data) these seem to be the most efficient. Also contains: - alerts if enabled
When japanese candlestick is detected it is colored with relevant color depending on bias, and also shows label next to it. Labels: - BEG = Bearish engulfing - BE = Bullish engulfing - DO = Doji

Trend Strength Visualizer A Simple Tool for Trend Analysis This indicator helps you quickly assess the strength of market trends using fast and slow moving averages. It’s designed to give you a clear visual representation of the trend, so you can make better trading decisions. ~Displays: Green Line : Strong uptrend (potential buying opportunities). Red Line : Strong downtrend (potential selling opportunities). ~Values That Can Be Changed: Fast MA period. Slow MA period. Line color for uptrend an

Checklist Indicator for MT5 Streamline your trading process with the Checklist Indicator —a powerful tool designed to keep you disciplined and organized. This indicator allows you to create and manage a personalized checklist directly on your chart, ensuring you follow your trading rules before entering a position. ️ Customize your own trading checklist
️ Stay consistent and avoid impulsive trades
️ Improve decision-making with structured analysis
️ Seamlessly integrates into your MT5 workfl

The Previous High Low Levels indicator displays the high and low of the previous candle from a selected higher timeframe. This helps traders identify key support and resistance zones while trading on lower timeframes. Features:
Plots the previous high and low from a higher timeframe
Works on all timeframes and instruments
Helps identify strong support and resistance levels
Lightweight and does not repaint How to Use: Select a higher timeframe (e.g., H1, H4, D1) in the settings. T
FREE

The Matrix Series indicator analyzes price action, moving averages, and volatility to detect trending conditions. Bullish Trend: Green zones or upward signals indicate a strong uptrend, ideal for long positions. Bearish Trend: Red zones or downward signals suggest a downtrend, perfect for short positions. Sideways/Neutral Market: Non-highlighted or gray zones show periods of market consolidation or low momentum, helping you avoid false signals. Use Cases: Trend Confirmation: Use the indicator to

One of the most accurate ways to predict price movements is to identify imbalances. When we identify significant price imbalances (aka fair value gaps or fvgs/ifvgs), it becomes relatively easy to place trades based on continuations and retracements. A moving average simply cannot give you anywhere near the precision we find when we observe the reaction of price to an imbalance. There are a few products on the market that claim to provide trading opportunities based on imbalances, but we believe

MACD Classic: 移动平均收敛/发散指标(MT5) 为寻求精确性和适应性的高级交易者设计。 MACD Classic 是一个专为 MetaTrader 5 开发的定制技术指标,使用 MQL5 编写,优化用于提供清晰的移动平均收敛和发散信号,帮助您更高效地识别趋势和进出点。 关键特点 : 快速EMA (12) : 适用于捕捉市场的快速波动。
慢速EMA (26) : 有助于识别市场的主导趋势。
信号线 (9) : 平滑波动,提供更清晰的信号。 该指标可在多个参数中进行配置,以适应您的特定需求。得益于其设计,它非常适合在 短期和长期时间框架 中使用,让您根据市场条件调整指标的灵敏度。 测试与性能 : 在本产品附带的视频中,您可以看到 MACD Classic 在不同时间框架下的表现,从 1分钟图表到日线图 。此外,还包括在波动市场和稳定市场中的对比,帮助您可视化其在检测关键信号方面的有效性。 尽管 没有任何指标能够保证未来的表现与过去测试相似 ,但 MACD Classic 已经过精心优化,提供 可靠的技术分析 ,并成为提升决策的有力工具。 为什么选择 MACD
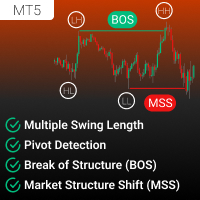
1TF BOS/MSS 指标 是一款强大的工具,旨在直接在单一时间框架内分析和可视化市场结构。该指标能够精准检测市场结构的突破(BOS)和市场结构的转变(MSS),帮助交易者轻松识别关键反转点和趋势延续点。其可自定义设置和详细标注使其成为交易者在决策过程中追求清晰性和自信不可或缺的工具。 功能和参数 核心功能: 市场结构突破 (BOS) 检测: 自动识别看涨和看跌的结构突破,突出显著的趋势变化。 市场结构转变 (MSS) 检测: 精准定位市场动态变化的关键反转点,提供潜在的交易机会。 多重波动长度分析: 通过多个可自定义的波动长度检测转折点,提供短期和长期市场结构的全面视图。
(例如:如果波动长度设置为 4、6、8,则该指标能够识别所有三种长度的转折点、结构突破和市场结构转变,提供对不同时间范围内价格行为的细致洞察。) 自定义选项: 转折点检测: 启用或禁用转折点检测。 检测方法:可选择使用蜡烛的 高/低点 或 收盘价 进行转折点计算。 高/低点: 使用蜡烛的最高点或最低点检测转折点。 收盘价: 使用蜡烛的收盘价进行转折点计算。
(例如:如果选择高/低点,则只有当某根蜡烛的高点高于前后

该指标在图表上绘制了供需区域。结合您自己的规则和技术,该指标将允许您创建(或增强)您自己的强大系统。还请查看提供更多功能的 付费版本 。我的建议是寻找在至少 25 个条形图后发生第一次区域测试的交易机会。 特征 区域有 3 种颜色(可通过输入调整)。深色表示未测试区域,中色表示已测试区域 ,浅色表示损坏区域 。 每个区域都写有区域外边界的价格以及区域测试的数量。 输入参数 最大后退柱线以搜索第一个极值 - 默认值为 3000。将搜索 xx 前的第一个极值。值越高,需要的系统资源就越多 。对于较慢的计算机,500-1000 的值可能更合适。 区域测试之间的最小蜡烛数量 未经测试的需求颜色 测试需求颜色 破碎需求颜色 未经测试的供应颜色 已测试的供给颜色 破损供给颜色 文本颜色 测试次数标签的字体大小 价格标签尺寸 [1-3]
FREE
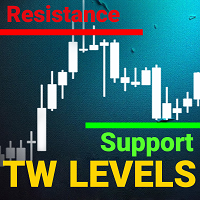
support resistance levels indicator mt5:
此工具是一个多时间框架指标,能够在图表上识别和绘制支持和阻力线以及斐波那契水平,其准确性与人眼相同。TW 外汇支持和阻力水平具有复杂的算法,可以扫描图表以识别先前的价格稳定和反弹水平,并记录触碰次数。
您是否厌倦了手动绘制支持和阻力水平以及斐波那契回撤?
查看此产品的功能;您会感到惊讶。
产品特点:
1. 次要和主要水平:您可以根据自己的喜好自定义次要和主要水平,并使用高级算法删除额外水平。
2. 水平触碰次数:TW 支持阻力水平与突破 mt5,计算并提供每个水平在过去被触碰的次数,使您能够评估每个水平的强度。
3. 斐波那契水平:最后一波的斐波那契水平动态绘制,这使您能够检查这些水平与静态支持和阻力水平计算器获得的值之间的对齐。
4. 开发者缓冲区:该产品包括开发交易策略所需的缓冲区。
5. 适用于所有货币和时间框架:您可以将 TW 支持和阻力水平用于黄金、欧元、英镑、美元等。
6. 简单且可定制的用户界面:该产品的用户界面非常简单且可定制,允许您根据自己的喜好个性化或禁用颜色

VWAP FanMaster:精准掌握回调策略!
VWAP FanMaster 是专为追求 精准入场点 和 高效回调交易 的交易者打造的终极指标。 它结合了 VWAP(加权平均成交价) 与 斐波那契扇形线 ,清晰标绘出市场中的重要价格区域。 主要特点 简单而强大 :只需移动垂直线,指标将自动绘制 VWAP 和 斐波那契扇形线 。
智能交易策略 :等待价格回到绘制的区域,以捕捉 完美回调 的支撑和阻力点。
高级可视化工具 :快速识别 价格共振区域 ,做出果断的交易决策。 为什么选择 VWAP FanMaster? 易于使用 ,适合新手和资深交易者。
提升交易精度 ,通过结合两种强大的分析工具。
改善风险管理 ,提供清晰一致的价格预测。 优化您的交易策略,用 VWAP FanMaster 轻松掌控市场!
FREE
The Channel Sgnals ProfRoboTrading Indicator for MT5 is an effective Forex trading tool designed to track market movements. The MT5 signal point indicator effectively detects trend reversals after they have already occurred. This Indicator is a fully automated technical tool that includes a number of parameters to track market trends. It automatically examines the ever-changing price dynamics of the market, compares the information with earlier data and generates a trading signal. Because
FREE
MetaTrader市场是您可以下载免费模拟自动交易,用历史数据进行测试和优化的唯一商店。
阅读应用程序的概述和其他客户的评论,直接下载程序到您的程序端并且在购买之前测试一个自动交易。只有在MetaTrader市场可以完全免费测试应用程序。
您错过了交易机会:
- 免费交易应用程序
- 8,000+信号可供复制
- 探索金融市场的经济新闻
注册
登录