适用于MetaTrader 5的新技术指标 - 46
Automatic trend lines. Type 1. With two extremums. 1) From the current bar "go" to the left and look for the first (right) extremum point with the InpRightExmSide bars on both sides. 2) From the first point again "go" to the left and look for the second (left) extremum point with the InpLeftExmSide bars on both sides.

Easy Trend , as the name implies, is an indicator that easily shows the prevailing trend by bringing several indicators into one. The strategy is: when all indicators point in the same direction a signal is triggered. When red, is a signal to sell, when blue, signal to buy. It is that simple :) There are a total of 9 indicators: Moving Average, RSI, CCI, Parabolic SAR, William's Range, Stochastic, MACD, ADX and Heiken Ashi. It is possible to configure each of these indicators to suit your way of

Buy Sell Signal Low TF gives buy/sell signals and alerts with up and down arrow at potential reversal of a pullback or a trend continuation pattern in low timeframe. This is an indicator which gives signals based on trend => It works best in trend market with the principle is to ride on the trend not trade against the trend.
The components of Buy Sell Signal Low TF: - The trend is determined by SMMA 13 , SMMA 21 and SMMA 35 ( can be changed manually to suit your preference). - The signal is
FREE

Sqn Max Indicator Sqn Max is an exclusive indicator to trade the market with high effectiveness.
The indicator is based on price action, volatility and trend.
This indicator is as simple as possible but not too simple.
The indicator can generate alerts to ease the trading process. You don't have to stay all day in front of your screen.
The indicator can be used with any class of assets and with any time frame.
It is possible to achieve better results trading our list of selected assets.
W

The True Oversold Overbought indicator provides you with ability to swiftly check whether the asset is oversold or overbought. Other than complementing your trading with True Oversold Overbought, you can use the indicator as your only trading system. It works with all forex instruments and will save you the headache of estimating when the market is due for a reversal or retracement. When the "Super Charge" feature is enabled, the areas where the price is in oversold/overbought status are ampli

If you want to find good trading opportunities, then you must trade near the Trend Line. This allows you to have a tighter stop loss on your trades — which improves your risk to reward . But that’s not all… Because if you combine Trend Line with Support and Resistance, that’s where you find the best trading opportunities. Now you might wonder: “So when do I enter a trade?” Well, you can use reversal candlestick patterns (like the Hammer, Bullish Engulfing, etc.) as your e
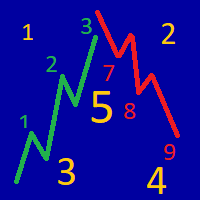
The indicator determines the strength of the trend and its possible reversal points, based on the author's arithmetic approach .
Each new peak or trough is a trend development. Such peaks and troughs are numbered so that the strength of the trend development can be seen. Attempts to change the trend are also numbered. This gives an understanding of a possible change in the direction of the trend. Indicator signals are generated when trying to change the trend .
In the settings, it i

Mean Volume Most indicators are based on price analysis.
This indicator is based on volume. Volume is overlooked piece of information in most trading systems.
And this is a big mistake since volume gives important information about market participants.
Mean Volume is an indicator that can be used to spot when volume is above average.
It usually means that institutional traders are active.
Peak in volume can be used to confirm an entry since increased volume can sustain the move in one or

MACD 2 Scalper Indicator for Precision Trading The MACD 2 Scalper works seamlessly on a variety of assets, including Boom Crash 1000, Crash 500, VIX75, GBP/USD, and many more. What is the MACD 2 Scalper? The MACD 2 Scalper is based on the traditional Moving Average Convergence Divergence (MACD) indicator, with a key difference: it features two lines that form a cloud, offering more nuanced insights. The divergence between the MACD and the signal line is displayed as a color-coded histogram. Vers

[ MT4 Version ] [ EA ] Advanced Bollinger Bands RSI MT5 Advanced Bollinger Bands RSI is an Indicator based on the functionalities of the Advanced Bollinger Bands RSI EA . The scope of this indicator is to provide a more affordable solution for users interested in the alerts coming out of the strategy but not in Autotrading. This strategy uses the Bollinger Bands indicator in combination with the RSI, the signal triggers only when both the BB and the RSI indicate at the same time overbought or ov

This is a usefull utility for monitoring spread and also for recording informations to a file. (Files will be placed into "Common\Files\Spread Monitor"). There is the possibility to let the indicator calculate high/low into the past thanks to downloading ticks. (It's a slow and approsimate thing! The best way to use it is to attach to a chart and let it recording spread in real time). There is also a buffer with the average of spread in latest X periods.
Easy and effective.
FREE

This indicator shows your daily profit for each chart. Please let me know in the comment section or via the MQL5 chat if you want find any problem, or if you want any specific features for this indicator. How to use:
Attach the indicator to the chart you want to see your profit. You can change the color of the indicators. (Currently positive figures are green, and negative are red) You can display the profit for pair it is attached, or for the whole account (all the pairs)

该系统擅长识别市场的短期逆转。 它基于对市场结构的机器学习研究,可以成为扫描市场或直接交易的绝佳工具。 一切都没有100%的胜率,但这个指标有时总是准确的。
当它认为反转会发生时,它会给蜡烛涂上特定的颜色,画一个箭头,然后提醒你是否购买或出售即将到来的蜡烛。
1. 简单的设置 A.在任何时间段拖放到任何图表上。 B.启用警报(可选) c.你就完了! 2. 视觉和音频警报 A.警报直接发送到您的手机 b.弹出发送到您的终端的警报 3. 多用途 A.股票、外汇、期权、期货 4. 灵活 A.适用于任何时间范围
重要提示:指标会在超过50%确定会发生某些事情时绘制箭头,但只有当它已经确定时,它才会通过改变蜡烛颜色,绘制箭头并提醒您来向您发出信号。 只有在这三件事都发生的时候才会发出信号。

Fx Levels Premium Indicator Support and Resistance are important concepts in trading. Fx Levels Premium was created to easily draw important levels of support and resistance for the active trader.
The indicator will give you all important levels (support/resistance) to watch for a wide range of assets.
Trading without these levels on your chart is like driving a car for a long journey without a roadmap. You would be confused and blind.
Support and resistance levels should be used as guidel

This indicator calculates fibonacci levels via moving averages trend and draw these lines. You can change fast and slow Moving Averages settings for customization. Inputs:
Fast MA Time Period : 64 Fast MA Shift: 0 Fast MA Method: Smoothed Fast MA Apply To: Median Price Slow MA Time Period: 32 Slow MA Shift: 0 Slow MA Method: Smoothed Slow MA Apply To: Median Price ZigZag: False ZigZag Color: Red ZigZag Type: DashDot ZigZag Width: VeryThin Fibo Settings TrendFibonacci: True FiboTrendColor: Blac
FREE

Moving VWAP Indicator Moving VWAP is an important indicator drawing the Volume-Weighted Average Price (VWAP).
The VWAP is a reference used by institutional traders and acts as a level of support / resistance.
If price is above VWAP then means market is bullish.
If price is below VWAP then means market is bearish.
It can be used to enter in the market with low risk (near VWAP) and also identify the correct direction of the market.
The Moving VWAP is as simple as a Simple Moving Average.
Pin Bar Indicator
The Pin Bar indicator is a pattern recognition indicator for Forex, Stocks, Indices, Futures, Commodities and Cryptos.
The strategy that comes with the Pin Bar pattern is based on price action.
Inputs of the indicator are:
Distance : distance in pixels relative to top or bottom of candle to display the arrow symbol UseAlerts (true/false): enable alerts PopAlerts (true/false): enable alerts in the popup window EmailAlerts (true/false): enable email alerts PushAle

Naked Forex Kangaroo Tail Indicator Kangaroo Tail Indicator is a pattern recognition indicator for Forex, Stocks, Indices, Futures, Commodities and Cryptos.
The Kangaroo Tail is a multi-bar pattern.
The Kangaroo Tail pattern is very effective and is very simple to trade.
The strategy that comes with the Kangaroo Tail is based on price action.
The indicator does what it was designed for: displaying Kangaroo Tail patterns. Don't expect to follow the up and down arrows and make money . Tr

Inside Bar IndicatorInside Bar is a very popular candlestick pattern.
Inside Bar indicator can be used to trade Forex, Stocks, Indices, Futures, Commodities and Cryptos.
The Inside Bar indicator will search for inside bar candles pattern in the chart and will generate display them.
The indicator is also able to generate alerts in your screen or sent to your phone.
Inputs of the indicator are:
Symbol: type of char symbol to be displayed in the chart to show Inside Bar patterns CustomCode:

Naked Forex Big Shadow Indicator Big Shadow Indicator is a pattern recognition indicator for Forex, Stocks, Indices, Futures, Commodities and Cryptos.
When you have a Big Shadow on your chart then this is a strong signal meaning that you might be ahead of a reversal. You can take other elements (momentum, trend, volatility, price action, fundamentals) to build a complete strategy and confirm your entries. Beware that you might not make money just following the arrows generated by the pattern r
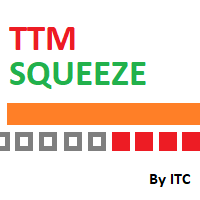
TTM Squeeze Indicator TTM Squeeze is an indicator to time entries based on volatility.
TMM Squeeze might well be one of the best and most overlooked indicator. It was created by famous trader John Carter and is also used by many traders like Nathan Bear.
Why is the TTM Squeeze indicator important? Because in trading correct timing entries might be more important than picking the right direction. This is a concept that is not very well understood in the trading community. Most trader think

Naked Forex Kangaroo Tail Pro Indicator Kangaroo Tail Pro Indicator is a pattern recognition indicator for Forex, Stocks, Indices, Futures, Commodities and Cryptos.
The Kangaroo Tail is a multi-bar pattern.
The Kangaroo Tail pattern is very effective and is very simple to trade.
The strategy that comes with the Kangaroo Tail is based on price action.
The indicator does what it was designed for: displaying Kangaroo Tail patterns. Don't expect to follow the up and down arrows and make

Choose the best trading tool: The impact of news on the exchange rate of a currency pair! As a news source you can use: Terminal calendar or Investing.com website In the second case, you will additionally need the Get News5 utility. The indicator combines well with the Trade maker utility, providing multi-currency trading. Calculates: indices of the impact of current news on currency pairs, taking into account market expectations. actual trend directions for 5 customizable timeframes and levels

Fisher Kuskus Indicator Fisher Kuskus is an indicator used by scalpers on low time frames like M1.
The Fisher Kuskus is now available for Metatrader platform.
Inputs of the indicator are:
Period : period to be used for calculation of the indicator PriceSmoothing : value of 0.0 to 0.99 IndexSmoothing : value of 0.0 to 0.99 The indicator can be used with any time frame.
It can be used with any class of assets: Forex, Stocks, Indices, Futures, Commodities and Cryptos. Other indicators for

Normalized Volume99% of indicators are based on price analysis.
This indicator is based on volume. Volume is overlooked piece of information in most trading systems.
And this is a big mistake since volume gives important information about market participants.
Normalized Volume is an indicator that can be used to confirm reversal points.
The indicator code volume with colors indicating high, normal and low volume.
You could enhance dramatically your trading system using volume analysis.

FX Sniper Yellow Indicator FX Sniper Yellow is an exclusive leading indicator to trade Forex with your Metatrader trading platform.
FX Sniper Yellow is able to analyze market participants behavior and to predict changes in the price direction even before movement starts.
Most indicators are lagging indicators and are useless. FX Sniper Yellow is a unique leading indicator .
The indicator displays arrows in your chart (please see screenshot attached) showing the probable direction of

FX Sniper Magenta Indicator FX Sniper Magenta is an exclusive and leading indicator to trade Forex with your Metatrader trading platform.
FX Sniper Magenta is able to analyze market participants behavior and to predict changes in the price direction even before movement starts.
Most indicators are lagging indicators and are useless. FX Sniper Magenta is a unique leading indicator .
The indicator displays arrows in your chart (please see screenshot attached) showing the probable direc

FX Sniper Orange Indicator FX Sniper Orange is an exclusive indicator to spot situations where market has gone too far and market could reverse soon after.
The indicator displays arrows in your chart indicating probable future price action (see screenshot attached).
FX Sniper Orange never repaints. Once candle is closed signal is confirmed and arrow will never disappear.
Users of the indicator can setup alerts when new arrows are displayed in the chart.
Inputs of the indicator are:
D
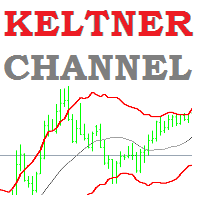
Keltner Channel Indicator Keltner Channel is an oscillator like Bollinger Bands.
Keltner Channel is a very good tool to time entries for your strategy.
Keltner Channel displays a channel where price is supposed to stay unless we are in overbought or oversold situations.
Various strategies use Keltner Channel indicator successfully to spot overbought / oversold situations and look for reversals.
Keltner Channel indicator uses ATR to determine overbought and oversold situations. Inputs of the

Engulfing Bar IndicatorEngulfing Bar indicator is a pattern recognition indicator for Forex, Stocks, Indices, Futures, Commodities and Cryptos.
The Engulfing Bar indicator is an enhanced pattern of the popular Engulfing Bar to keep only the best patterns produced in the market.
The strategy that comes with the Engulfing Bar is based on price action.
Inputs of the indicator are:
Distance: distance in pixels relative to top or bottom of candle to display the arrow symbol UseAlerts (true/

Naked Forex Tweezer Pro Indicator Tweezer Pro Indicator is a pattern recognition indicator for Forex, Stocks, Indices, Futures, Commodities and Cryptos.
The standard Tweezer is a two bar pattern. Our enhanced version is a multi-bar pattern. We filter the patterns for you so that you only get the best and most effective patterns and ignore the noise.
The Tweezer pattern is a simple and effective pattern to trade.
The strategy that comes with the Tweezer is based on price action.
The

Seeing and interpreting a sequence of Candlesticks is easy to spot when you are a human... Higher Highs, Higher Lows, are the panorama of a Buying trend, at least in a short period of time... Seeing a current candlestick higher high and a lower candlestick low, as a human, you can immediately spot a "divergence", an "alert", a "starting range", but in the end and based on other analysis a human trader can understand and behave accordingly to this kind of candlestick data... But what about EAs (r
FREE

Tokyo Session Box Indicator : Draw a box of Tokyo session. Inputs tutorial: 1. Automatic: true/false. To calculate box automatic base GMT. 2. Broker time zone: if Automatic is False, you have to define broker time zone (ex: 2 ) 3. Button ON/OFF properties: x, y, corner, color, background fill, width, height, font name, font size. This button will toggle showing or hiding Tokyo session box.
FREE

It's a multi-symbol and multi-timeframe scanner for our indicator - ACB Breakout Arrows . With default settings, it scans for the buy/sell signals on 28 currency pairs and 9 time-frames concurrently.
Features
It can scan 252* combinations of symbols and time-frames from a single chart. Open the signal's chart loaded with a predefined template with a single click. Easy drag n drop anywhere on the chart. Real-time alerts with popup, sound, push-notifications and email alerts.
Input Para

This indicator helps keep track of the number of trades taken in the day. It shows losses and potential profit then the total profits which is, profits - losses. Then total profit for the week and month. Soon the indicator will be sharing some trading tips based on your trading. It really does put necessary pressure and helps you to set a goal for yourself for the day. Familiarise yourself to draw your analysis on the same chart with the indicator because it will have to alert you if price brok
FREE

支撑和阻力水平查找器:
支撑和阻力水平查找器是一种先进的工具,旨在增强交易中的技术分析。具有动态支撑和阻力水平,它随着图表上新的关键点的出现实时调整,提供动态和响应式分析。其独特的多时间框架功能允许用户在任何所选时间框架上显示来自不同时间框架的支撑和阻力水平,提供细致的透视,例如在五分钟图上显示每日水平。它采用智能算法,其中包含历史数据集,使其与其他S&R指标区分开来,确保综合分析。在检测水平时,该工具采用多参数计算,有助于提高准确性。用户可以单独自定义支撑和阻力水平的颜色,创建个性化的视觉体验。该工具还包括警报功能,可在价格接近关键水平时通知交易者,增强及时决策。具有方便的功能,如隐藏和显示按钮,以及用于快速切换水平可见性的热键,支撑和阻力水平查找器为寻求在其技术分析中精确性和灵活性的交易者提供了多功能且用户友好的解决方案。
特点:
- 动态支撑和阻力水平:随着图表上新的重要关键点的出现进行调整。 - 多时间框架支撑和阻力水平:能够在任何其他时间框架上显示任何时间框架的水平。例如,在M5上显示每日水平。 - 使用智能算法,其中包括历史数据,与其他S&R指标不同。 - 在
FREE

该指标最多绘制 6 个级别,可以根据交易者的要求启用/禁用以使图表更清晰
这 6 个级别分为 2 组:高和低
对于每组,可以选择不同的时间范围
它基于先前高低反转的策略,因为它认为当价格达到每日、每周或每月高低时,价格通常会在更小的时间范围内(如 5 分钟)显示拒绝
特征 :
- 在单个图表中跟踪多达 6 个时间帧高低点
- 在这些级别设置警报,邮件、推送或终端警报,当价格触及这些级别时,您将立即收到警报
- 自定义关卡样式,包括线条样式、宽度、颜色等
- 班次:想要跟踪或研究第 2 天或第 3 天的高低?您可以将 shift 设置为 2 用于 2nd Bar 的 High Low 或 3 设置为 3rd Bar 的 High Low 等等。
该指标最多绘制 6 个级别,可以根据交易者的要求启用/禁用以使图表更清晰
这 6 个级别分为 2 组:高和低
对于每组,可以选择不同的时间范围
它基于先前高低反转的策略,因为它认为当价格达到每日、每周或每月高低时,价格通常会在更小的时间范围内(如 5 分钟)显示拒绝
特征 :
- 在单个图

三角形图案的图案浏览器,例如对称三角形、不对称三角形或直角三角形,楔形图案,例如上升楔形或下降楔形,扩展图案和趋势通道
该指标探索历史模式以及当前模式,对于那些试图通过手动绘制趋势线或三角形来节省时间并希望将其用于自动分析在图表上绘制最佳模式的人来说,它是最佳指标
特征 :
- 用于立即更改 ZigZag 扩展深度以调整并找到最佳模式的面板
- 将模式转移回之前的之字形柱以探索过去发生的事情,您可以探索趋势线是否受到尊重,了解价格走势
并通过探索以前的历史模式,使用该指标分析和学习它们,得出一个总体策略
- 从切换按钮立即从趋势通道或趋势线切换到楔形或三角形模式
- 暂停以冻结模式,因此模式不会改变并继续检查价格触摸以获取警报
- 触摸级别的多种类型的警报:邮件、推送、终端和打印通知
- 通过调整点启用早期警报,以便您在价格接近水平时提前收到警报并准备入场
- 趋势通道:启用/禁用上、中或下线警报
- 目标:对于三角形和楔形,它会自动设置目标,这是您必须买入卖出的有趣区域,如果您是突破交易者,您可以在那里预订利润或等待价格行动进行反转交易
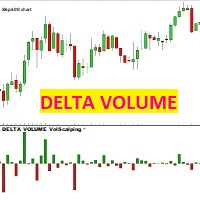
VOLUME DELTA Volscalping 该指标针对每根价格蜡烛绘制一个 Delta 蜡烛,即买入和卖出合约之间的差额。 如果买价(卖出)交易的合约超过卖价,蜡烛将是红色和负数,相反,如果卖价(买)交易的合约超过买价,蜡烛将是绿色和正数。
注意:该指标仅适用于提供真实市场数据流的经纪商,并将签订的合约分为 BID 和 ASK。 外汇、差价合约和加密货币属于合成市场,它们没有真实的市场数据流,因此该指标将不适用于它们。 AMP FUTURE 经纪商是提供真实市场数据流的经纪商,即使有模拟账户,也无需存款。 适用于在真实市场上交易的指数、商品、商品(例如 CME、EUREX、ICE ...)
VOLUME DELTA Volscalping 该指标针对每根价格蜡烛绘制一个 Delta 蜡烛,即买入和卖出合约之间的差额。 如果买价(卖出)交易的合约超过卖价,蜡烛将是红色和负数,相反,如果卖价(买)交易的合约超过买价,蜡烛将是绿色和正数。
注意:该指标仅适用于提供真实市场数据流的经纪商,并将签订的合约分为 BID 和 ASK。 外汇、差价合约和加密货币属于合成市场,

The indicator "JAC Trend Color Candle" for Meta Trader 5, was created to visually facilitate the trend for the trader. It is based on three parameters, which identifies the uptrend, downtrend and non-trending market. The colors are trader-configurable, and the average trader-configurable as well. trend parameters cannot be configured as they are the indicator's differential.
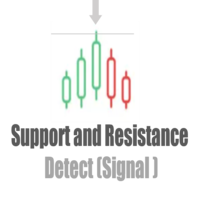
The indicator, Support and Resistance Detect Signal automatically detects support and resistance levels and trend lines, emitting a signal whenever the condition is met, as configured.
It reads support and resistance drawn manually or automatically built into the chart by other external indicators.
Note: Support and Resistance Detect Signal is compatible with almost all external indicators that draw on the chart, support and resistance levels, in addition to trend lines.
Discover our Elit
The indicator, Support and Resistance Detect Signal automatically detects support and resistance levels and trend lines, emitting a signal whenever the condition is met, as configured.
It reads support and resistance drawn manually or automatically built into the chart by other external indicators.
Note: Support and Resistance Detect Signal is compatible with almost all external indicators that draw on the chart, support and resistance levels, in addition to trend lines.
Discover

Secreto is a fundamental technical indicator that allows you to assess the current market situation in order to enter the market of the selected currency pair in a trend and with minimal risk. It basically uses the process of identifying the rate of change in price growth and allows you to find entry and exit points from the market. The indicator can be used with an optimal risk-to-reward ratio, it shows good signals. Uses two options for settings. Shows favorable moments for entering the marke

Arrow technical indicator without redrawing Vendetta in the Forex market is able to give tips with the least errors. The indicator does not redraw its signals when the price changes. It combines several filters, displaying market entry arrows on the chart.
Every rise and fall is reflected in your emotional state: hope is replaced by fear, and when it passes, hope appears again. The market uses your fear to prevent you from taking advantage of a strong position. At such moments you are most vu

Dependence arrow indicator for forex, futures and binary options without redrawing. It gives a lot of signals, which requires additional indicators to check them. Works only on opening prices. Therefore, reliable and without redrawing. Often signals that went in the wrong direction are canceled out on the next signal.
Unfortunately, most popular indicators in practice give a huge number of false signals, since they all work without any consideration of global trends. That is why in today's co

Draw and Sync Objects Multiple Charts 1. Draw objects by key press. ( You must: 1. Press Function key => 2. Click where you want to draw => 3. Draw it => 4. Press ESC to complete). (If you don't want to draw after pressing function key, you must press ESC to cancel). 2. Developing : Sync selected objects to multiple charts by button. 3. Developing: Hide objects that do not belong to the current symbol (Objects drawn with this indicator will belong to the symbol they are plotted on. When your c
FREE

Reservoir is a reversal indicator and is part of a special category of instruments. The indicator not only analyzes the price movement, but also indicates the points of possible reversals. This contributes to the quick and optimal opening of buy or sell orders (depending on the current situation). In this case, the historical data of the analyzed asset is necessarily taken into account. It is the correct implementation of such actions that in many ways helps traders make the right decision in t

Salinui - Arrow trend indicator, without delay and redrawing, is used by traders in trend strategies in trading in financial markets (Forex, CFD, binary options). The indicator predicts the most likely short-term price movement based on complex mathematical calculations. One of the biggest challenges traders face is finding the right trading system for them. This indicator is designed to detect trends in price movement and allows you to quickly determine not only the direction of the trend, but

Passage Victorious is a handy tool, and even if you are used to trading on a clean chart, sometimes you need to take a look at this indicator. If you are not sure how to determine the trend inflection point and are concerned about how to draw trend lines then this indicator is for you. From now on, you do not need to sit near the computer and analyze the price, just use this indicator.
The indicator calculates saturation levels of the price chart. A signal to exit the oversold area is a buy s

Fixation of the Result is a trend indicator, a technical analysis tool that helps determine the exact direction of a trend: either an up or down price movement for a trading pair of currencies. This indicator, although a little late, is still the most reliable signal that a trader can safely focus on. Determining the market trend is an important task for traders.
The indicator is used in the forex markets. One of the main definitions for monitoring the currency market is a trend, which is why

The Signal Sunrise channel indicator automatically builds a trend movement support channel. The price is in its trend movement in a certain range, and not a chaotic spread of the price is unclear in which direction. And if the price deviates within a certain range, then this means that the boundaries of these ranges are support and resistance lines and form a channel.
It is no secret that the wave theory, like many others, is based on observations, however, one of the most important patterns

50% off. Original price: $60 Triangle Finder is a multi symbol multi timeframe dashboard that finds symmetrical triangle pattern in 28 symbols and 9 timeframes with a deep scan feature to scan all market watch symbols (up to 1000 instruments!).
Download Demo here (Scans only M1, M5 and M10) Settings description here MT4 version here
Triangle Finder features: Realtime monitoring of 28 customizable instruments and 9 timeframes at the same time. Deep scan mode to scan all market watch sym

Developed by Jack Hutson in the 80's, the Triple Exponential Moving Average (a.k.a. TRIX ) is a Momentum technical indicator that shows the percentage of change in a moving average that has been smoothed exponentially 3 times. The smoothing process was put in place in order to filter out price movements that are considered insignificant for the analysis period chosen. We at Minions Labs found hard to follow the smoothness of the original TRIX line, so we colored the TRIX line with BUY and SELL t
FREE

Element is a Forex arrow indicator that implements a kind of technical analysis based on the idea that the market is cyclical in nature. Follows the market trend with good reliability, ignoring sharp market fluctuations and noise around the average price. Thus, all intersection points will be optimal points at which the movement changes taking into account the indicator period. It catches the trend and shows favorable moments of entering the market with arrows. Displays signals simply and clear
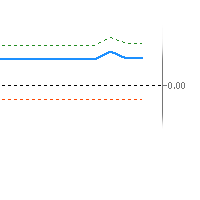
An imbalance indicator that marks imbalance on the chart with zones and gives the amount of imbalance as an oscillator value. There's one line for the amount of short imbalance, one line for the long imbalance and the combined imbalance as a thicker line. The combined imbalance goes above 0 if there's more imbalance above than below the current price and vice versa. The blue thicker line, shows (imblance above - imbalance below). The greeen dotted line shows imbalance above The red dotted line s
KF-BB
Professional Bollinger Bands with Alert.
Bollinger bands available in the market are mostly drawn based on simple moving average . KF-BB is the first bollinger bands that can draw the center line using all the usual methods simple , exponential, etc. A very professional indicator, it does not end here other advantages of this indicator include creating an alarm on the desktop and the mobile phone When the candlesticks hit one of the center lines or the upper and lower bands
Features in

该仪表盘显示所选符号的最新可用谐波形态,因此您可以节省时间并提高效率 / MT4 版本 。
免费指标: Basic Harmonic Pattern
指标列 Symbol: 显示所选符号 Trend: 看涨或看跌 Pattern: 形态类型(Gartley、蝴蝶、蝙蝠、螃蟹、鲨鱼、Cypher 或 ABCD) Entry: 入口价格 SL: 止损价 TP1: 第一止盈价 TP2: 第二次获利价格 TP3: 第三次获利价格 Current price: 当前价格 Age (in bars): 最后绘制的模式的年龄
主要输入 Symbols : 从 "28 种主要货币对 "或 "选定符号 "中选择。 Selected Symbols : 希望监控的符号,用逗号分隔("EURUSD,GBPUSD,XAUUSD")。如果您的经纪商为货币对设置了后缀或前缀,您必须在以下两个参数中添加(货币对前缀或货币对后缀)。 Max Iteration: 调整模式的最大迭代次数(如果该值越小,则模式越少,性能越快;如果该值越大,则模式越多,性能

该指标可识别预测市场反转点的最常用谐波形态。这些谐波形态是外汇市场上不断重复出现的价格形态,暗示着未来可能的价格走势/ 免费 MT4 版本
此外,该指标还内置了市场进入信号以及各种止盈和止损。需要注意的是,虽然谐波形态指标本身可以提供买入/卖出信号,但建议您使用其他技术指标来确认这些信号。例如,在进行买入/卖出之前,您可以考虑使用 RSI 或 MACD 等震荡指标来确认趋势方向和动能强度。
该指标的仪表盘扫描器:( Basic Harmonic Patterns Dashboard )
包括的谐波形态 加特里 蝶形 蝙蝠型 螃蟹 鲨鱼 赛弗 ABCD
主要输入 Max allowed deviation (%): 该参数是指谐波图形形成时的允许偏差。该参数决定了谐波图样的结构可以变化多少,而指标不会将其视为有效图样。因此,如果设置的百分比越高,则模式识别的灵活性就越大,而如果设置的值越低,则限制性就越大。例如:如果设定值为 30%,那么指标将把当前价格 ±30% 范围内符合形态比例的形态视为有效形态。 Depth: 该参数决定了谐波形态的每个波浪中必须
FREE

这很容易成为最容易被忽视的指标,它可以为您提供对价格行为的最大洞察力。这是我自己使用的唯一指标。
该指标可让您深入了解今天的价格走势,以及最有可能朝哪个方向移动。
ADR 代表平均每日范围。如果您在盘中交易或剥头皮,您必须知道价格将移动多少的范围。
假设价格已经移动了当天正常水平的一半,并且处于价格行动的底部,价格更有可能继续下跌,而不是再次一路上涨以达到平均每日范围。价格总是寻求在平均每日范围内移动。
您还将获得动态支撑和阻力。当价格移动到平均范围时,您可以向中间交易。
该指标还将让您知道价格是否可能从趋势线反弹。因此,如果您喜欢使用趋势线进行交易,这就是您的指标!
你会得到 3 种类型的范围。
1. 黑色区间 - 基于当前价格的当前区间,但如果价格波动超过平均水平,则会吸引顶部或底部。当价格移动超过 ADR 的 50% 时,该范围最终将与其他两个范围之一保持一致。
2. 绿色区间 - 如果我们从今天的低点计算,价格平均会移动多远?
3. 红色范围 - 如果我们从今天的高点计算,价格平均会移动多远?

The Market Reversal Catcher indicator looks for market reversal points or major pullback. To do this, it analyzes previous price movements and using a flexible algorithm for estimating the probability of a reversal, also gives recommendations on entry points and sets recommended profit targets for positions opened on a signal. Market Reversal Cather User Guide - Read Version for MetaTrader 4 - here The indicator is very easy to use and does not require a lot of information to understand how it

The indicator, Big Candle Detect , is based on ATR and Volume to detect candlesticks of buying and selling strength, which is represented through an oscillator indicator. With this indicator you will be able to identify the lateral market, providing better entries according to your strategy.
Big Candle Detect highlights candles with brighter colors when the condition is found, making it easier to identify, in addition to being fully compatible for automation in your EA.
SETTINGS
ATR P

About AIntel
Is there are reason you select RSI 14 or 21? Is there a reason you select EMA 25? Is there a reason you pick these periods for these and any other indicators? Those numbers might have worked 10 or 20 years ago. They might be working for traiding certain currency pair in a certain timeframe.. But they DO NOT give you the best profit and outcome at all times all pairs all trades! AInter is "automated inteligence" series indicators that optimize automatically for best profit so you do

Switch symbols and timeframe by arrow buttons 1. You can switch multiple symbols of one or all charts. 2. You can set list of symbols to switch between them or get them from Market Watch. 3. You can change timeframe of one or all charts. List of timeframes here [M1, M5, M15, M30, H1, H4, D1, W1, MN1]. Switch symbol of all charts: indicator check current symbol of the chart to get index of it in list and change for next or previous. Key functions: - Right arrow key: switch to next symbol. - Left
FREE

An Adaptive Moving Average (AMA) is one more moving average overlay, just like EMA. It changes its sensitivity to price fluctuations . The Adaptive Moving Average becomes more sensitive during periods when price is moving in a certain direction and becomes less sensitive to price movement when price is volatile. For more information, welcome to our Telegram Group. https://t.me/InfinXx
FREE
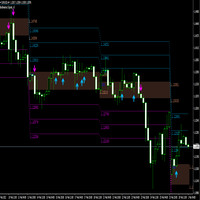
A breakout refers to when the price of an asset moves above a resistance area, or moves below a support area . Breakouts indicate the potential for the price to start trending in the breakout direction. For example, a breakout to the upside from a chart pattern could indicate the price will start trending higher. The indicator works with arrows in case of breakthrough, you also have a level of 1 tp, a level of 2 tp, a level of 3 tp. For more information, welcome to our Telegram Group. https:
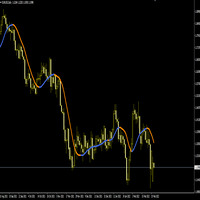
The Hull Moving Average (HMA) attempts to minimize the lag of a traditional moving average while retaining the smoothness of the moving average line. Developed by Alan Hull in 2005, this indicator makes use of weighted moving averages to prioritize more recent values and greatly reduce lag. The resulting average is more responsive and well-suited for identifying entry points. For more information, welcome to our Telegram Group. https://t.me/InfinXx
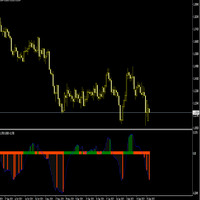
The Slope indicator measures the slope of a linear regression , which is the line of best fit for a data series. A 20-period Slope, therefore, measures the slope of a 20-day linear regression. ... In general, a positive slope indicates an uptrend, while a negative slope indicates a downtrend. How do you use slope Indicator?
By applying the slope indicator to both the price chart and the price relative , chartists can quantify the price trend and relative performance with one indicator. A po

此供需区域指标在图表上绘制区域并在价格达到或突破区域时发送警报。也可以使用它来提醒常规双顶/底部而不是区域。可以使用 RSI、ADX、成交量和发散过滤器来过滤出最强的设置。结合您自己的规则和技术,该指标将允许您创建(或增强)自己的强大系统。该指标适用于已经熟悉供应需求以及在决定关闭或打开交易时如何使用它的更有经验的交易者。 特征
支持以下分歧: MACD、OsMA、RSI、CCI、随机指标和真棒。 这些区域有 3 种颜色(可通过输入进行调整)。未测试区域为深色,测试区域为中等,破损区域为浅色。 区域外边界的价格以及区域测试的数量都写在每个区域。 该指标可以将信号写入全局变量,EA 可以使用这些变量进行自动交易。 输入参数
请在 此处 找到输入参数的说明和说明。

Boom and Crash Spike Detector 指标是根据主要用于检测价格中的 Boom 和 Crash 的高级策略进行编码的。 植入了复杂的算法来检测价格中高概率的繁荣和崩溃。 它会在潜在的繁荣或崩溃阶段发出警报: 繁荣阶段:当价格上涨过快时。 崩溃阶段:当价格下跌过快时。
限时优惠:该指标仅适用于 30 美元和终身。
主要特征
向手机发送推送通知 在计算机或笔记本电脑上弹出并发出警报 显示非重绘箭头(向上箭头表示潜在繁荣,向下箭头表示潜在崩溃) 与所有对一起工作。
推荐
时间范围:H1 和 H4 推荐货币对:处于趋势阶段的货币对。
接触
如果您有任何问题或需要帮助,请通过私信联系我。
作者
SAYADI ACHREF,金融科技软件工程师和 Finansya 创始人。

指數波動趨勢指標。
主要特點:
它僅用於 Binary 或 Deriv 經紀商中的綜合指數,它們是相同的。 它有趨勢過濾器。 它有一個聲音警報來警告可能的價格下跌。 如果您將其放在 VPS 上,它可以向您發送移動警報。 它配置了 L566b12 算法,旨在提高效率。
如何使用指標
它在 M1 的時間性中起作用。 趨勢必須強勁。 等待信號蠟燭以與趨勢不同的顏色結束。 在 Deriv 時鐘的 57 秒處進入,以便在下一個燭台開始時進入交易。 您最多只能應用 2 個鞅。
聯繫以獲取更多信息:
WhatsApp: +5930962863284
購買後,請與我聯繫以向您發送有關如何從該工具中獲得最大好處的附加指南。
關於如何獲得最佳門票的 PDF 實用指南。 VIP模板引導您走向更好的趨勢。 個性化建議。
MetaTrader市场是您可以下载免费模拟自动交易,用历史数据进行测试和优化的唯一商店。
阅读应用程序的概述和其他客户的评论,直接下载程序到您的程序端并且在购买之前测试一个自动交易。只有在MetaTrader市场可以完全免费测试应用程序。
您错过了交易机会:
- 免费交易应用程序
- 8,000+信号可供复制
- 探索金融市场的经济新闻
注册
登录