适用于MetaTrader 5的新技术指标 - 38
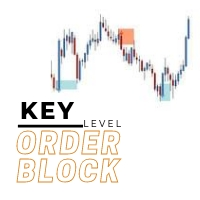
The key level order block indicator automatically draws order-blocks for you on the chart. The indicator compliments any strategy and can also be used as an independent tool. It can work with smart money concepts, harmonic patterns, supply and demand, flag patterns, Quasimodo strategy and many more.
Advantages
The key level order block DOES NOT RE-PAINT, giving you confidence when a signal appears and also helps when looking back. The key level order block includes an on/off button on th

The Market Sessions Indicator for MT5 helps you predict market turnarounds by detecting major supply and demand areas. These pivot points tend to occur after a new session has started and the previous one is still open. It is also used to gauge how many points or pips the market moves on average during a session. This helps us to place better our take profits and stop losses. The indicator works on all forex pairs, gold, silver, commodities, stocks, indices and any other instrument that your

Supertrend indicator uses a combination of a moving average and average true range to detect the trend of a trading instrument.
Supertrend indicator for MetaTrader 5 easily shows the trend as a line following the price.
Triple SuperTrend Histo indicator calculate three supertrends to show the trend as a histogram. Changing the color from red to green means you can BUY , from green to red means you can SELL .
Description of the method of drawing a histogram. The price is above the EMA 20

Average Daily Range (ADR) with Support (S) and Resistance (R) Levels is an indicator which shows how far a currency pair can move in a day. It can be used to find hidden support and resistance levels, estimate effective profit and stop loss targets, and provide short term trade signals from the hidden S and R levels. Features
Automatically plots on the chat, the top and bottom of the ADR value (i.e. a horizontal channel) which acts as Support and Resistance Levels Automatically calculates the

[ MT4 Version ] Bulls and Bears Power Bulls and Bears Power is an indicator that clearly highlights if bulls or bears are currently in control of the market. A price movement started with high Bulls control in the market can indicate the beginning of a new trend movement. The relative indicator power between price peaks also indicates if the movement is losing strength and might foresee a significant correction or a trend reversal. Bulls and Bears Power indicator offers a clear and simplified vi

AUTO MIDAS VWAP Volume Weighted Average Price (VWAP) is a trading benchmark commonly used by Big Players that gives the average price a Symbol has traded throughout the day. It is based on both Volume and price.
Commonly, MIDAS VWAP damand you to determine the initial point of analysis. This indicator plots automatically based on ZigZag Approach.
You will be able to use up to 3 HIGH MIDAS VWAP's and 3 LOW MIDAS VWAP's.
Wish the best trade results!!

Description: The Multi POC displays multiple Point Of Controls on one chart. This Indicator is also already included in the "VolumeProfile" Indicator .
Features: Customizable Range POC Customizable section POCs with VAL&VAH lines Works on all timeframes Drag & Drop for live calculation
Support: The indicator is constantly being developed and improved. Please do not hesitate to contact me via the MQL5 Platform. I am very grateful about any Bug report, so that i can constantly improve the ind

The Forex Master Pattern is an alternative form of technical analysis that provides a framework which will help you to find and follow the hidden price pattern that reveals the true intentions of financial markets. This algorithm here does a good job detecting the Phase 1 of the Forex Master Pattern cycle, which is the contraction point (or Value).
On Phase 2 we get higher timeframe activation (also called Expansion), which is where price oscillates above and below the average price defined

每个人的指标 Pip Scalper 用于剥头皮趋势。 使用此指标更长时间地保持趋势。 它适用于所有时间框架和资产。 使用此工具获取每日点数。 使用 200 移动平均线过滤交易。 建议使用较小的时间范围。 用于日间交易。
关于和如何使用:
Pips Scalper 基于长期趋势交易。 买蓝色 卖出红色 在活跃期间使用 200 移动平均线作为过滤器和交易。
Pip Scalper 用于剥头皮趋势。 使用此指标更长时间地保持趋势。 它适用于所有时间框架和资产。 使用此工具获取每日点数。 使用 200 移动平均线过滤交易。 建议使用较小的时间范围。 用于日间交易。
关于和如何使用:
Pips Scalper 基于长期趋势交易。 买蓝色 卖出红色 在活跃期间使用 200 移动平均线作为过滤器和交易。
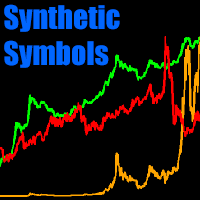
在您的终端符号(或您的自定义符号)之间执行任何操作以创建 自定义合成符号 :对数刻度、相对表现(股票与 SP500、黄金与白银……)、货币指数……可能性无穷无尽! 您可以逐个蜡烛地执行符号和常数之间的任何数学运算。包含用于获取 2 个值之间的最小值 [min(a,b)] 或最大值 [max(a,b)] 以及平方根 [sqrt(x)]、绝对值 [abs(x)] 的函数,一个值的对数 [logn(x) 或 log10(x)] 或最接近的整数 [round(x)]。 从 2.0 版开始,您还可以在当前交易品种中声明指标并访问其值,例如: $ma_indi = <MA> : 50,0,0 ; #CURRENT - indicator ($ma_indi, 0) 指标名称的语法是自定义指标的 文件夹/名称 和终端指标之间的“ < > ”。 如何使用 使用市场报价中以“#”字符开头的符号(例如#EURUSD)编写公式。确保任何符号的名称不包含任何运算符字符、括号或“#”,以便正确评估公式。 您还可以将公式保存在 txt 文件中并改为加载该文件。 该公式将在每根蜡烛上进行评估,将结果显
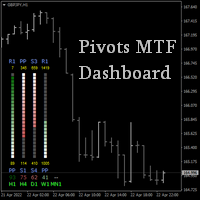
If you trade by levels, then this indicator is for you.
The indicator displays support and resistance levels for the selected timeframes, additionally showing how many points to the nearest levels, as well as between which levels the current price is in the form of a color scale and percentages.
Location anywhere on the chart, the ability to scale, the calculation offset taking into account the hourly difference of your broker, the choice of colors and other parameters will allow you to cus

Cybertrade Keltner Channels - MT5 Created by Chester Keltner, this is a volatility indicator used by technical analysis. It is possible to follow the trend of financial asset prices and generate support and resistance patterns. In addition, envelopes are a way of tracking volatility in order to identify opportunities to buy and sell these assets.
It works on periods longer than the period visible on the chart. All values are available in the form of buffers to simplify possible automations.
FREE

Cybertrade ATR Trend Zone - MT5 The indicator shows, by calculating the ATR (Average True Range), the zone of probable price resistance. Indicated to be used as a probable exit point of an operation.
It works on periods longer than the period visible on the chart. All values are available in the form of buffers to simplify possible automations. This indicator is the same one we use in our EA. Also check out our other products.
FREE

Trend Entry Indicator Your Trading will Be easier with this indicator!!! This Indicator is Developed To make our trading life easier. Get an Arrow for Entry with Take Profit and Slop Loss marks on chart. - Indicator is Based on trend, because thats what we all want we want to follow the trend "it's our friend". - Based on Levels, price action and oscillators. - It works on all currency pairs, all indices, metals and stock. - it works on all pairs/indexes on Deriv including Boom and Crash. - Tim

Cybertrade Double Bollinger Bands - MT5 The Bollinger Bands indicator shows the levels of different highs and lows that a security price has reached in a given duration and also their relative strength, where the highs are close to the upper line and the lows are close to the lower line. Our differential is to present this indicator in a double form, with the availability of its values to simplify automation.
It works on periods longer than the period visible on the chart. All values are
FREE

Every indicator has its advantages and disadvantages. Trending ones show good signals during a trend, but lag during a flat. Flat ones thrive in the flat, but die off as soon as a trend comes. All this would not be a problem, if it was easy to predict when a flat changes to a trend and when a trend changes to a flat, but in practice it is an extremely serious task. What if you develop such an algorithm, which could eliminate an indicator's flaws and enhance its strengths? What if such an algorit
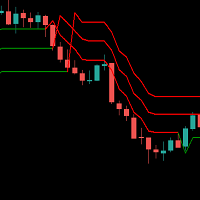
Supertrend indicator uses a combination of a moving average and average true range to detect the trend of a trading instrument.
Supertrend indicator for MetaTrader 5 easily shows the trend as a line following the price.
USAGE THIS INDICATOR If the closing prices are above Supertrend Line, there is a Bullish sentiment at that moment. The opposite is a Bearish sentiment. Three green lines - Strong Bullish sentiment. Three red lines - Bearish sentiment.
For BUY : - Three green lines and pric

The Market Sessions Indicator for MT5 helps you predict market turnarounds by detecting major supply and demand areas. These pivot points tend to occur after a new session has started and the previous one is still open. It is also used to gauge how many points or pips the market moves on average during a session. This helps us to place better our take profits and stop losses. The indicator works on all forex pairs, gold, silver, commodities, stocks, indices and any other instrument that yo
You can identify the strength of the main forex currencies with this tool. You can combine it with different styles and get the best strategy out of it. It has very high power. It can be customized.
MT4 version
This indicator will have many updates and special settings will be added to it.
You can contact us via Instagram, Telegram, WhatsApp, email or here. We are ready to answer you.
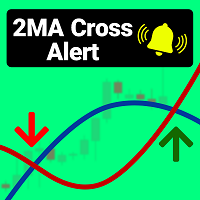
This indicator setup two Moving Average indicators and when the smaller Moving Average (2) crosses the larger one (1) , you will be notified by Popup alert, mobile notification, or Email.
If your strategy works with two Moving Average indicators, you do not need anymore to constantly and tediously look at the chart. You should just add this indicator to the chart according to your required settings, and whenever the defined cross (up or down) is done, it notifies you and you wouldn't miss the

Highly configurable Volume indicator.
Features: Highly customizable alert functions (at levels, crosses, direction changes via email, push, sound, popup) Multi timeframe ability Color customization (at levels, crosses, direction changes) Linear interpolation and histogram mode options Works on strategy tester in multi timeframe mode (at weekend without ticks also) Parameters:
Volume Timeframe: You can set the lower/higher timeframes for Volume. Volume Bar Shift: you can set the offset of th
FREE

Color Candle Indicator. The indicator implements a breakout system using the channel. When price exits the gray channel, the candlestick color changes to the color corresponding to trend direction. Blue for growth, yellow color for fall. Bright colors denote coincidence of trend direction and direction of a candlestick. Dark colors correspond to the situation when the direction of a candlestick is opposite to trend.
FREE

Benefits of the Surfboard indicator :
Entry signals without repainting If a signal appears and is confirmed, it does NOT disappear anymore, unlike indicators with repainting, which lead to major financial losses because they can show a signal and then remove it. perfect opening of trades The indicator algorithms allow you to find the Peak and floor position to enter a deal (buy or sell an asset), which increases the success rate for each and every trader using it. Surfboard works with any asse

KT Higher High Lower Low marks the following swing points with their respective S/R levels: Higher High: The swing high made by the price that is higher than the previous high. Lower High: The swing high made by the price that is lower than the previous high. Lower Low: The swing low made by the price that is lower than the previous low. Higher Low: The swing low made by the price that is higher than the previous low.
Features The intensity of swing high and swing low can be adjusted by cha

The US Dollar Index, also known as DXY, is used by traders seeking a measure of the value of USD against a basket of currencies used by US trade partners. The index will rise if the Dollar strengthens against these currencies and will fall if the Dollar weakens against these currencies. Plan your technical analysis of the US Dollar Index by tracking its price in the chart and keep up with the latest market movements with news, advice pieces, and the dollar index forecast. The U.S. dollar index (

Description Price action patterns detection that can work as triggers in any trading strategy, It include Flag, Flag Top, Flag 1234, and micro pullback patterns Support: We create great tools for the entire trading community. Most of them are free. If you believe in what we do Support Us Here. How is this indicator useful? You can use the indicator signals as a trigger to entry in the market and complement any trading strategy. Components Note 1: This indicator should only be considered a

its not just an Indicator. its a trading system I'm working on for 3 years and also would be updated you don't need any thing else to trade because its a price action indicator that shows all static and dynamic support and resistance this indicator contains 7 lines that gives us dynamic support and resistance also when main lines (white ones) become flat for 26-52 periods they show strong levels. you can find consolidating areas, strong downtrend(in Green channel) and strong uptrend(in Red Chan

Ayuda a interpretar la tendencia del precio de mercado de acuerdo a las mediciones en tiempo real, ideal para reforzar los resultados mostrados por el RSI las bandas de Bollinguer. Recuerde que el mercado de instrumentos financieros es altamente volatil, no opere con dinero que ponga en riesgo su estabilidad financiera. Solo use fondos que este dispuesto a perder. Resultados pasados no garantizan resultados futuros. Mantenga Siempre control sobre el riesgo.

交易时段指标突出显示每个交易时段的开始和结束 。
Trading_Sessions_Indicator_Free 产品的付费版本,可以自定义会话的开始/结束。
[选项:] Asian session Open Asian session Close Asian session OpenSummertime Asian session CloseSummertime European session Open European session Close European session Open European session Close Timeshift
请使用M15-H2时间帧以获得最佳效果。
增加了时间帧M1,M5的校正。 近似校正: Bars Correction ------------------ 23.50 ____ 10 23.54 ____ 5 23.55 ____ 4(5) 00.05 ____ 5(6)
我在市场上的其他产品 https://www.mql5.com/en/users/sky-angel/selle

Lehmer均值可以看作是一个窗函数,其权重系数取决于计算中使用的变量的值。该平均值是非线性的,因为在其计算中使用了取幂。 指标的特征取决于两个参数: iPeriod - 指标周期,有效值大于等于2; iPower - 指数,在计算指标值时使用。有效范围是 -32768 到 32767
在 iPower = 0 时,我们得到调和平均值, iPower = 1 - 算术平均值, 对于 iPower = 2,反谐波平均值。 Lehmer 均值具有较大的指数,突出了时间序列的最大边界。对于负指数,强调最小值。由于此属性,Lehmer 均值可用于平滑时间序列和构建通道。
第一张图片显示了使用收盘价计算的通道,指数为 +500 和 -500。 第二张图片显示了同一通道,iPower = +1000 和 -1000。 在第三和第四个数字中,Lehmer 的平均值适用于 +/- 1000 和 +/- 5000 的最高价和最低价。

Cybertrade Auto Fibonacci retraction and projection - MT5
##### Free indicator for an indefinite period. ##### Auto Fibonacci is an indicator that automatically plots the Fibonacci retracement and projection based on the number of bars you select in the indicator setting. You can customize nine different levels of retraction and three levels of projection. It works on periods longer than the period visible on the chart. All values are available in the form of buffers to simplify possible au
FREE

Simple Super Trend indicator for MetaTrader 5. A trend indicator similar to moving averages. Use it for entry and exit signals. It gives accurate signals on precise time. Works as a Trailing SL/TP. This indicator can also be used on multiple timeframes where you place it on a larger timeframe then go to a lower timeframe. Super Trend needs to be used in conjunction with other indicators like rsi, Parabolic SAR, MACD, etc to receive filtered signals.
FREE

This indicator calculates gann support and resistance prices with use gann pyramid formulation and draw them on the chart. And If you want, Indicator can alert you when the current price arrive these pivot levels. Alert Options: Send Mobil Message, Send E-mail, Show Message and Sound Alert Levels: S1, S2, S3, S4, S5, R1, R2, R3, R4, R5 Inputs: GannInputPrice: Input price for gann pyramid formulation. GannInputDigit: How many digit do you want to use for calculation formula. (The number and the
FREE

This indicator is designed according to the combination of WPR and Stoch indicators, when WPR goes up and Stoc goes up quickly too, the price may meet strong resistance, many times short order will take profit, but if the price break through it, Long positions are more likely to be profitable, and the reverse held true as well. You can adjust the parameters of WPR and Stoc to Adapt the symbol you operate. Click here to look the advanced edition: https://www.mql5.com/en/market/pro
FREE

Highly configurable Average True Range (ATR) indicator.
Features: Highly customizable alert functions (at levels, crosses, direction changes via email, push, sound, popup) Multi timeframe ability Color customization (at levels, crosses, direction changes) Linear interpolation and histogram mode options Works on strategy tester in multi timeframe mode (at weekend without ticks also) Adjustable Levels Parameters:
ATR Timeframe: You can set the lower/higher timeframes for ATR. ATR Bar Shift: y
FREE

This indicator is the advanced edition of WRP&KD support resistance designed according to the combination of WPR, Stoch, RSI, CCI, and tick volume indicators. You can add other timeframe's support and resistance on the current chart. When WPR, Stoch, RSI, CCI goes up the same time quickly and the volume become larger, the price may meet strong resistance, many times short order will take profit, but if the price break through it, Long positions are more likely to be profitable, and the

RSI Scanner is a multi symbol multi timeframe RSI dashboard that monitors Relative Strength Index indicator for price entering and exiting overbought and oversold in up to 28 symbols and 9 timeframes.
Download Demo here (Scans only M1, M5 and M10) Settings description here MT4 version here
RSI Scanner features: Signals RSI entering and exiting the overbought and oversold zones. Monitors 28 customizable instruments and 9 timeframes at the same time. Supports all 21 timeframes of Metatra

"Hunttern harmonic pattern finder" base on the dynamic zigzag with the notification and prediction mode
This version of the indicator identifies 11 harmonic patterns and predicts them in real-time before they are completely formed. It offers the ability to calculate the error rate of Zigzag patterns depending on a risk threshold. It moreover sends out a notification once the pattern is complete.
The supported patterns:
ABCD BAT ALT BAT BUTTERFLY GARTLEY CRAB DEEP CRAB CYPHER SHARK THREE
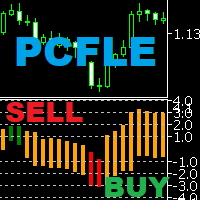
PCFLE Histogram (Price Change From the Last Extreme) - plots the percentage movement from the last extreme. Can be used for graphical representation of percentage movement from last lowest low to current high / from last highest high to current low. Input parametters: InpDigits - the number of decimal places displayed on the y-axis You can set colors and horizontal levels in the indicator properties. Examples of how to trade with the indicator can be found in screenshots.

最后,界面变得方便。 现在,您可以用鼠标控制指标周期。 只需点击按钮并滚动鼠标滚轮即可增加或减少CCI周期。 按钮可以放在任何方便的地方,一键固定使用。 您可以在一个图表上设置多个指标,并同时单独或全部管理它们。 图表上的简单安装使您不必担心重命名或更改每个指标的参数,自动算法本身将重命名和创建必要的对象,以及在使用后删除它们。 界面尽可能方便,实际上不需要手动干预。 这个组件非常适合那些经常在交易策略中使用CCI指标的人。 不是脚本! 可以在图表上不断工作!在测试仪中不起作用。 一个巨大的要求留下您对这个免费产品的反馈。 安装工程:
-将"Button_CCI"设置为图表。 将出现一个按钮来控制指示器和CCI指示器本身. 您可以在一个窗口中设置多个指标,将为每个指标创建一个按钮。
-按钮出现在一排,一个接一个,但你可以将它们移动到主图表上的任何方便的地方。 一旦按钮固定到位,它们就不能移动。
-当按下按钮时,相应指示器的控制模式被激活。 与此同时,图形本身的滚动被禁用。 当鼠标向前滚动时,CCI周期增加,向后减少. 如果按下多个按钮,则多个指示器一次更改。
-更改
FREE

该指标每天显示当前情况的趋势和目标。 由于正确确定市场条件,该指标还减少了亏损交易的数量。 专为分析和日内交易而设计。
如何使用:
蓝线显示当天的开盘价,其中 4 条线根据特殊公式设置,确定当天的目标。 您可以按照趋势的方向搜索和打开交易。
灰线是第一个目标。 当价格达到这些水平时,最好关闭部分头寸并保护您的交易。 此外,在这些价格区域中,您可以小心地根据趋势进行交易。
黄线是今天的最终目标。 当价格接近这个水平时,值得关闭大部分交易量并保护交易,或者完全关闭趋势交易。 不建议在这些区域跟随趋势。
黄线可以突破很远,很少但会发生。 这是奖金收入。
当一天内达到蓝线区域的价格时,上述的一切都可以重复。
开始交易时,请查看左上角的指标建议。 不要针对指标进行交易!
FREE

真正的供需指标 - 将允许您快速确定所有时间范围内的阻力位和支撑位。 该指标对那些在交易中使用技术分析的人很有用。 该指标易于使用,只需在图表上拖放,该指标就会向您显示最可能的支撑位和阻力位。 切换时间范围时,您将看到新选择的时间范围的水平。
推荐机器人黄牛 - 测试 。
输入参数 使用价格标签 - 开启/离开在水平附近显示价格图标 价格水平颜色 - 选择价格图标的颜色 价格 Lebel 大小 - 价格图标大小 支持/抵抗级别颜色 - 选择级别的颜色 订阅我的 page ,我还有很多其他有用的产品。 如果您喜欢这个指标 ,请留下评论,它将进一步激励我免费分享有用的产品。 感谢您选择本产品。 我将努力继续以有用和高质量的产品取悦您。 如果您有任何问题,请随时与我们联系!
使用愉快!

Kolmogorov-Zhurbenko 滤波器可以被认为是一种特殊的窗函数,旨在消除频谱泄漏。此过滤器最适合平滑随机(包括金融)时间序列。 基于此过滤器的指标包含以下参数: iLength - 用于构建过滤器的原始矩形窗口的周期。有效值为 2 - 255。 iDegree - 过滤顺序。如果 iDegree=0,那么将获得一个简单的移动平均线。如果 iDegree=1,那么你得到一个三角形移动平均线。更高阶允许更好的平滑和噪声抑制。允许值为 2 - 255。此外,此参数影响指标的最终周期 = iLength + iDegree * (iLength - 1)。 iMultiplier - 一个乘数,显示从过滤器值计算的标准偏差数。
指示器的外观如图所示。

Offer 249 down from 350 for the next 1 copies. then back to 350 $
Are you tired of using outdated indicators that leave you guessing where to set your profit targets? Look no further than the AK CAP Opening Range Breakout Indicator. This powerful tool is backed by a US patent and has already helped countless traders pass funded challenges like FTMO. We use it daily on our prop traders and internal funds, and now it's available to you as well. The calculation behind the indicator is incredibly

交易数据分析助手 : 这是一款交易数据统计分析工具,数据图表较多可供分析参考 . 语言: 支持语言的选择切换(目前支持中文和英文 主动识别不用人工选择) 主窗口显示: 余额显示 总盈亏显示 现在持仓盈亏金额显示 现在持仓盈亏比例显示 买单卖单总单量,总手数,以及盈亏情况显示. 仓位使用比例显示 按照目前持仓能够承受的亏损点数预计 (点击右下角可缩放)每日订单单量,手数,盈亏情况统计 (点击右下角可缩放) 当周盈亏数据
(点击右下角可缩放) 当月盈亏数据
(点击右下角可缩放) 当年盈亏数据
交易数据统计区: 详细订单统计,(可以选择按日,周,月,季度,年)(按品种,识别码)(现有持仓详细统计) 盈亏/手数/交易次数 柱状图 多/空持仓时间/获利水平情况 多货币盈利次数/盈利水平分布情况 余额净值曲线/余额曲线/盈利曲线等(注:加载余额净值曲线可能需要一定的数据处理时间,请耐心等待加载完成...) 每次订单盈亏利润柱状图 多货币对盈利曲线图 数据统计分析报告 关于版本更新 有任何问题,建议,欢迎交流.
FREE

The indicator implements the author's approach to the construction of the popular "Zig-Zag" indicator.
The advantages of the "ZIgZag Level" indicator is that it filters out market noise and shows levels.
"ZIg Zag Level" is based on peaks and troughs, displays levels.
These levels can be disabled and configured.
The indicator displays the price of the level, the price tag can be disabled.
The "zigzag" line between the points can also be disabled.
The indicator has a built-in notific

Tomamos 5 medios móviles las unimos en una la cual suavizamos y volvemos a suavizar, resultando un mega suavizador de medios móviles suavizadas. Indicador de mql5 funciona en cualquier broker y para todos los tiempos, siendo el mas optimo el de 5, 15 a mas. Funciona mejor en grupo consigo misma osea poner uno de 14 y otro de 50 y 400,, así se observa mejor su desempeño.

Only 5 copies of the EA at $30! Next price --> $45 Find charts and signals based on harmonic patterns, which work great in 1-hour timeframes and up.
Buy and sell signs based on different harmonic patterns as follows:
0: ABC_D
1: ABCD_E
2: 3Drive
3: 5_0
4: Gartley
5: Bat
6: Crab
7: Butterfly
8: Cypher
9: NenStar
10: Shark
11: AntiBat
12: AntiGartley
13: AntiCrab
14: AntiButterfly
15: AntiCypher
16: AntiNenStar
17: AntiShark
How to use:
When there is an opportunity to
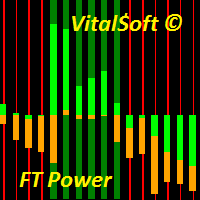
The FT Power indicator system is designed to determine the trend direction of the price chart. Consists of two histograms. The central histogram Bull/Bear Power determines the predominance of bullish or bearish power. When the indicator value is above zero, Bull/Bear Power shows that the bulls are strong, and when the histogram goes below 0, the bulls are exhausted and further growth becomes doubtful. The main histogram is used to determine the trend or flat sections of the chart and confirm the

It is the very same classic Stochastic indicator, but with a little twist: we changed the Signal Line with a 2-color line, so we can use it with EAs as a filtering system. And that's it! I know it could seem stupid but I needed that, so I created it. The original formula is right from Metaquote's chest, no additions, no subtractions, it is Stochastics in its core.
So I will not publish here the Stochastics parameters as they are all the same as always... Enjoy!
If you like this indicator, all
FREE
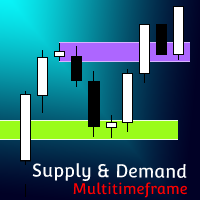
[ MT4 Version ] Supply and Demand Multitimeframe Supply and Demand Multitimeframe is the first indicator in the market that combines multiple aspects like trading volume, price structure and momentum to identify Supply and Demand zones for every asset. The Supply and Demand indicator analyzes simultaneously up to 4 different TFs and represents their information in the current graph. Its interactive UI highlights everytime the price enters a Supply or Demand zone even if the zones are not visible

KT Candlestick Patterns Scanner is a Multi-Symbol and Multi-Timeframe scanner that fetches and shows various candlestick patterns on 28 currency pairs and 9 time-frames concurrently . The scanner finds the candlestick patterns by loading the KT Candlestick Patterns indicator as a resource in the background.
Features
The scanner can find the candlestick patterns on 252* combinations of symbols and time-frames from a single chart. Open the signal's chart loaded with a predefined template with

Configure scaffolding charts and signals based on the scissor pattern, which works great at low times.
Buy and sell signs based on 2 previous candle patterns
It works on the active time form, and when detecting the pattern in 4 time frames, 5 minutes, 15 minutes, 30 minutes and one hour, the alert can be set to notify us of the formation of this pattern.
MetaTrader version 4 click here
How to use:
When there is an opportunity to buy or sell, the marker places a scissors mark on

Trend Reversal alert: The concept of the EA is to give you a message/alert when something happens in the market, so you will never pass a tradechance for a trendreversaltrade. The EA give you the message when the chance is higher for a trendreversal, but it is important to say that this doesn`t mean that you should trade every signal. The advantage provided by the program is that you don`t need to sit the hole time for the PC and look at the chart because you get a message when a good trendrever
FREE

Vix 75 and Boom Sniper Entry
= Assistance for Non Beginners traders = Market Structure is KEY =Trading is a Risk ... Know what you are entering into when starting your trading journey
Basically the indicator gives signals due to reach of Support and Resistance, it also give signals on touch of order block. Works Best on Gold and Eurusd and Synthetic Index - its best give accurate confluences with a TDI
TDI settings: RSI Period -10 Bollinger Bands - Period 34 - First indicators Dat

MACD divergence indicator finds divergences between price chart and MACD indicator and informs you with alerts (popup, mobile notification or email) . Its main use is to find trend reversals in the chart. Always use the divergence indicators with other technical assets like support resistance zones, candlestick patterns and price action to have a higher possibility to find trend reversals. Three confirmation type for MACD divergences: MACD line cross zero level Price returns to previous H/L Crea
FREE

Mouse You can draw fibonaccis moving the mouse over the zigzag indicator Pin them You can click on fibonacci with this option and it will no longer be deleted unless you click on it again :) Precision The tuned fibonacci gets the precise point in lower timeframes Enjoy it You can ask me for add more features, so please comment and leave your ranting for me to be happy, thank you :)
FREE

Market Momentum Alerter Market Momentum Alerter will inform you about danger to operate in the market.
Imagine you see a very nice setup (Forex, Stocks, Indices) and you decide to place your trade...
And you finally lose your trade and don't understand what happened.
This can happen due to big operations in the market carried out by banks and big institutions.
These operations are invisible for most people.
Now with the Market Momentum Alerter you will be able to detect those operation

ATR Scanner Pro is a multi symbol multi timeframe volatility scanner that monitors and analyzes Average True Range indicator value in up to 28 symbols and 9 timeframes in 3 modes : ATR value: As a volatility dashboard it shows the ATR indicator value in all pairs and timeframes and signals when the ATR value reaches a maximum or minimum in a given duration. Short term ATR/Long term ATR ratio: It shows ratio of 2 ATRs with different periods. It's useful in detecting short term volatility and

"The trend is your friend" is one of the oldest and best-known sayings in financial markets. However, this message only represents half of the picture. The correct saying should be, "The trend is your friend only until it ends." KT Trend Filter solves this problem by clearly indicating the start of an Uptrend and Downtrend using an averaging equation on the price series. If the trend direction is not clear, it shows the trend as sideways showing the uncertainty in the market.
Features
Get a
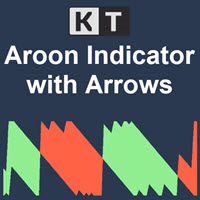
KT Aroon oscillator is the modified version of the original Aroon oscillator initially developed by Tushar Chande in 1995. It measures the time interval between the ongoing highs and lows and uses this deduction to calculate the market trend's direction and strength. It works on the notion that the price will form new highs consecutively during an uptrend, and during a downtrend, new lows will be formed. Buy Signal: When Aroon Up line cross above the Aroon Down line.
Sell Signal: When Aroon Do

Indicator and Expert Adviser EA Available in the comments section of this product. Download with Indicator must have indicator installed for EA to work.
Mt5 indicator alerts for bollinger band and envelope extremes occurring at the same time. Buy signal alerts occur when A bullish candle has formed below both the lower bollinger band and the lower envelope Bar must open and close below both these indicators. Sell signal occur when A bear bar is formed above the upper bollinger band and upp

KT OBV Divergence shows the regular and hidden divergences build between the price and OBV - On Balance Volume oscillator.
Features
Unsymmetrical divergences are discarded for better accuracy and lesser clutter. Support trading strategies for trend reversal and trend continuation. Fully compatible and ready to embed in an Expert Advisor. Can be used for entries as well as for exits. All Metatrader alerts are available.
What is a Divergence exactly?
In the context of technical analysis, i
The KT QQE Advanced is a modified version of the classic QQE oscillator to depict it more accurately using the colored histogram with fast and slow Trailing Line(TL).
Unlike the classic QQE, the KT QQE Advanced consists of a histogram with overbought/oversold levels.
Applications
Find quick buy/sell signals across all the timeframes using the MTF scanner. Find the trend direction more accurately. Detects overbought/oversold market. Shows the price momentum.
Inputs RSI Period Smooth Per
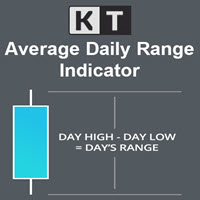
KT Average Daily Range(ADR) shows the upper and lower levels using the average daily range covered by the currency pair or the instrument. The average daily range is calculated using the chosen period in the input settings. ADR High: ADR upper level is found by adding the average daily range value to the current day's low.
ADR Low: ADR lower level is found by subtracting the ADR value from the current day's high.
Features
It shows the ADR levels with several other helpful information bene
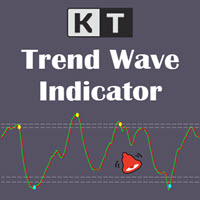
KT Trend Wave is an oscillator based on the combination of Price, Exponential, and Simple moving averages. It usually works great to catch the short term price reversals during the ongoing trending market. The bullish and bearish crossovers of the main and signal lines can be used as buy/sell signals (blue and yellow dot). It can also be used to find the overbought and oversold market. The buy and sell signals that appear within the overbought and oversold region are usually stronger.
Feature
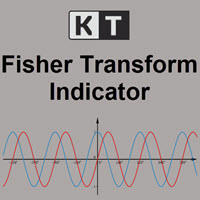
KT Fisher Transform is an advanced version of the original Fisher Transform oscillator equipped with divergence detection, crossover alerts, and many more features. Originally it was developed by John F. Ehlers. It converts the asset's price into a Gaussian normal distribution to find the local extremes in a price wave.
Features
A light-weighted oscillator that efficiently identifies the upward and downward crossovers and marks them using vertical lines. It also finds regular and hidden div

KT MACD Alerts is a personal implementation of the standard MACD indicator available in Metatrader. It provides alerts and also draws vertical lines for the below two events: When MACD crosses above the zero line. When MACD crosses below the zero line.
Features It comes with an inbuilt MTF scanner, which shows the MACD direction on every time frame. A perfect choice for traders who speculate the MACD crossovers above/below the zero line. Along with the alerts, it also draws the vertical line

PriceRunner MT5 The PriceRunner indicator is based on pure relative power. It gives promising results even in M1 timeframes in currency pairs and M2 in commodities and cryptos. The indicator is designed with user-friendly and simple settings. It is very suitable even for beginners who are interested in indicators and strategies. I am ready to make improvements on the indicator in line with the needs of those who buy or rent. However, even in its current state, you can see very promising results
MetaTrader市场是一个简单方便的网站,在这里开发者可以出售自己的交易应用程序。
我们将帮助您发布您的产品,并向您解释如何为市场准备您的产品描述。市场上所有的应用程序都是加密保护并且只能在买家的电脑上运行。非法拷贝是不可能的。
您错过了交易机会:
- 免费交易应用程序
- 8,000+信号可供复制
- 探索金融市场的经济新闻
注册
登录