YouTubeにあるマーケットチュートリアルビデオをご覧ください
ロボットや指標を購入する
仮想ホスティングで
EAを実行
EAを実行
ロボットや指標を購入前にテストする
マーケットで収入を得る
販売のためにプロダクトをプレゼンテーションする方法
MetaTrader 5のための新しいテクニカル指標

金融指標 SolarTrade Suite: Mercury Market Indicator - 金融市場の世界で信頼できるガイドです!
これは、革新的で高度なアルゴリズムを使用して値を計算する移動平均であり、見た目にも美しいデザインも備えています。
投資と金融市場の世界を自信を持ってナビゲートしたいですか? SolarTrade Suite Financial Indicator: Mercury Market Indicator は、情報に基づいた投資決定を下し、利益を増やすのに役立つように設計された革新的なソフトウェアです。
SolarTrade Suite Financial Indicator: Mercury Market Indicator の利点:
正確な予測: 当社の指標は、高度なアルゴリズムと分析技術を使用して、市場の動きを正確に予測します。資産を売買するのに最適なタイミングに関するシグナルを取得します。
便利なインターフェイス: 直感的なインターフェイスにより、プログラムを簡単に習得し、インストール後すぐにそのメリットを享受できます。設定か

Volume Break Oscillator is an indicator that matches price movement with volume trends in the form of an oscillator. I wanted to integrate volume analysis into my strategies but I have always been disappointed by most volume indicators, such as OBV, Money Flow Index, A/D but also as Volume Weighted Macd and many others. I therefore wrote this indicator for myself, I am satisfied with how useful it is, and therefore I decided to publish it on the market. Main features: It highlights the phases i

ゴールドブリッツスキャルピングインジケーターを紹介します。このツールは、M1、M5、M15の時間枠でゴールドをスキャルピングするための最適なツールです。先進的なAIニューラルネットワークを使用して開発されたこの非リペイントインジケーターは、一貫した利益と優れた取引結果を保証します。精度と効率を追求したゴールドブリッツスキャルピングインジケーターは、M15時間枠で最も良い結果を提供します。 主な特徴: 先進的なAIニューラルネットワーク: 最先端のAI技術を活用して比類のない精度を実現。 非リペイント: 一貫したパフォーマンスのために信号のリペイントを防ぎます。 複数の時間枠スキャルピング: M1、M5、M15に最適化されており、M15時間枠で最良の結果を提供。 包括的な信号: 明確な売買シグナル、利益確定(TP)および損切り(SL)レベルを提供し、情報に基づいた取引をサポート。 利点: 高精度: 高精度のシグナルで卓越した取引成功を実現。 リアルタイムアラート: 即時のアラートとシグナルで先手を打つ。 使いやすさ: 明確な指示とサポートで簡単に使用。 生涯アクセス: 現行バージ
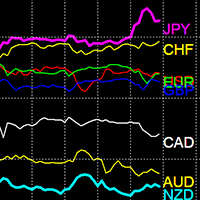
通貨強度インジケーター
通貨強度インジケーターは、トレンドを識別するための強力なツールです。さまざまな通貨の強さと弱さを比較し、トレンドの通貨ペアを簡単に見つけることができます。
セール価格: 49 ドル
機能
強い通貨と弱い通貨を効果的に区別します トレンドの通貨を自動的に識別します マルチタイムフレーム 28 通貨ペアをロードします パフォーマンスが最適化されています
インジケーターの使用法 強い通貨: 80 を超える通貨は強いと見なされます。 弱い通貨: 20 未満の通貨は弱いと見なされます。
例
EUR が 80 を超えて上昇傾向にあり、USD が 20 未満で下降傾向にある場合、EURUSD は上昇傾向にあります。
JPY が 80 を超えて上昇傾向にあり、GBP が 20 未満で下降傾向にある場合、GBPJPY は下降傾向にあります。
インジケーターで通貨が高いほど、強いことを意味します。インジケーター上で通貨が低いほど、その通貨は弱いです。
インジケーターの反対側にある通貨で構成される通貨ペアは、通常、強いトレンドで、しばらく続き
A MUST HAVE - NON REPAINT INDICATOR - that will help you to make the decision whether to Buy or Sell , including where to set the Take Profit and Stop Loss . The Buy/Sell signal will not redraw nor repaint until new signal occurs. The Take Profit and Stop Loss will change following the market conditions. Our indicator will give alert to your mobile/handphone when new buy/sell signal arrive. For best result, combine this indicator with your knowledge on price action and support & resistance, also
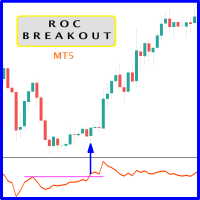
When prices breakout resistance levels are combined with Rate of Change oscillator "ROC" oscillator breaks out its historical resistance levels then probability emerges to record farther prices. It's strongly encouraged to confirm price breakout with oscillator breakout since they have comparable effects to price breaking support and resistance levels; surely, short trades will have the same perception. Concept is based on find swing levels which based on number of bars by each side to confirm
FREE

The Accumulation/Distribution (AD) Technical Indicator is a tool used in technical analysis to determine whether an asset is being accumulated (bought) or distributed (sold) in the market. Key Characteristics of the AD Indicator: Purpose: The AD indicator is used to assess the balance between buying (accumulation) and selling (distribution) of an asset. This helps traders and investors evaluate the strength of the current trend and potential reversals. Interpretation: Rising Indicator: When the
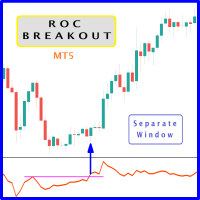
When prices breakout resistance levels are combined with Rate of Change oscillator "ROC" breaks out its historical resistance levels then higher chances emerges to record farther prices. It's strongly encouraged to confirm price breakout with oscillator breakout since they have comparable effects to price breaking support and resistance levels; certainly short trades will have the same perception. Concept is based on find swing levels which based on number of bars by each side to confirm peak or
FREE

HURRY! The offer price of $89 is ACTIVE ONLY for FIRST 5 PURCHASES, after which the price will increase to $129. William Delbert Gann, commonly known as W.D. Gann, was an exceptional market analyst renowned for his unique trading style in the early 20th century. His trading techniques were based on a blend of mathematics, geometry, astrology, and ancient mathematics. Gann believed that stock market movements followed specific patterns and cycles, rather than being random. His methodologies, ce

Dominant Candle Finder is a significant candlestick on a price chart that stands out due to its size, volume, or price movement compared to surrounding candles. It often indicates strong buying or selling pressure and can be used to identify potential reversal points, breakouts, or continuations in the market. Dominant candles can serve as key indicators for traders to make informed decisions, providing insights into market sentiment and potential future price movements. MT4 Version - https://w

If you like this project, leave a 5 star review.
Follow on TikTok: @quantum.trader
[ Any Symbol Can Be ADDED ] Works on [ EURUSD-GBPUSD-GBPJPY-USDJPY-XAUUSD ]
This indicator calculate and draw the Prediction or Forecast the peaks of the next day based on REGRESSION ( forecast high - forecast low - forecast middle - forecast upper q - forecast lower q )
These are important levels looked by many institutional and professional
traders and can be useful for you to know the places whe

RTS5Pattern AVG RTS5Pattern AVG is a revolutionary statistical indicator designed for the MetaTrader 5 platform, bringing an innovative approach to technical analysis and market movement prediction. This indicator combines advanced mathematical methods, including normalization and historical data analysis, with a user-friendly interface and precise trading capabilities. RTS5Pattern AVG is an ideal tool for traders looking to improve their trading strategies and achieve better results. Key Featur

Description The Profit and Loss Indicator by Creative Tech Solutions is a robust and comprehensive tool designed to help traders monitor their trading performance in real-time. This indicator provides detailed metrics on profits and drawdowns, ensuring traders are always informed about their trading activities and performance. With customisable alerts and display settings, this indicator is an essential tool for any serious trader. Features Real-Time Metrics : Monitor profit and drawdown percent
FREE

Price Sessions is an exclusive MetaTrader 5 indicator that integrates symbol information and trading sessions into your chart. It does not link to any account information or external sources, ensuring user safety. Main Features: 1. Symbol Information Current Symbol Live Price Live Spread 2. Trading Sessions (Time zone UTC/GMT+0) Tokyo session London session New York session If you find this utility helpful, please rate it. If you encounter any issues or have suggestions, pleas
FREE

Rivoluziona il Tuo Trading con l'Indicatore di Segnali Scalping su Timeframe Multipli Scopri il segreto del successo nel trading con il nostro esclusivo indicatore di scalping su timeframe multipli. Questo strumento avanzato è progettato per trovare segnali efficienti e precisi, aiutandoti a massimizzare i profitti e a ridurre i rischi associati al trading veloce L'indicatore di segnali Alien Scalper MTF è uno strumento di analisi tecnica altamente efficace, progettato per identificare opportu

Moving Pivot Average The Moving pivot indicator compares the selected period with its counterpart from the previous period. The indicator uses very flexible algorithm for pivot value calculating. It allows you to allocate in days a certain time intervals (custom bars) and calculate the average pivot value based on High, Low and Close prices of these bars. How many custom bars will be taken into account is determined by the "Days" setting. The pivot line can be considered an average trend line

RSI Divergence Signal
The RSI Divergence Signal is a technical analysis tool used in financial markets to identify potential trend reversals. It compares the Relative Strength Index (RSI) with price action to detect divergences. When the RSI moves in the opposite direction of the price, it signals a potential change in momentum, suggesting that the current trend may be weakening. This divergence can indicate a buying opportunity in a downtrend or a selling opportunity in an uptrend. Traders
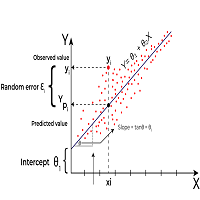
Linear Regression is a statistical method used to model the relationship between two or more variables. The primary goal of Linear Regression is to predict the value of one variable (called the dependent variable or outcome variable) based on the value of one or more other variables (called independent variables or explanatory variables) Linear Regression can be applied to technical analysis, and it is indeed one of the tools used by traders and analysts to make predictions and identify trends i
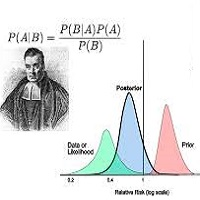
Bayesian methods can be effectively applied to predict price trends in financial markets, including Forex, stocks, and commodities. Here’s how Bayesian techniques can be used for trend prediction: 1. Bayesian Linear Regression Bayesian linear regression can be used to model the relationship between time and price. This method allows for the incorporation of prior beliefs about the trend and updates the trend as new data comes in. Example: Suppose you want to predict the price trend of a currency
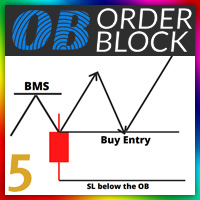
Orde Block Detector: The order block detector can automatically identify the breakthrough of the market structure. After the trend framework breaks through, the order block area can be drawn automatically. In order to draw the OB area more accurately, we also automatically find the candle on the left and right sides of the original candle according to its trading principle, and draw a more accurate ob area through more subtle quantitative rule judgment. Futures : 1. Customize the BMS color, a

The ICT Propulsion Block indicator is meant to detect and highlight propulsion blocks, which are specific price structures introduced by the Inner Circle Trader (ICT).
Propulsion Blocks are essentially blocks located where prices interact with preceding order blocks. Traders often utilize them when analyzing price movements to identify potential turning points and market behavior or areas of interest in the market.
USAGE (fingure 1) An order block is a significant area on a pric

Here is a version for MetaTrader 5 of the famous Wave Trend indicator. Introducing the Wave Trend Oscillator Indicator for MT5 We are excited to present our Wave Trend Oscillator Indicator, exclusively designed for MetaTrader 5. This advanced tool is a must-have for traders who seek precision and efficiency in their trading journey. Our oscillator is built on the principles of wave trend analysis, capturing the ebb and flow of market trends with unparalleled accuracy. It helps traders identify p
Session Bias This Strategy of bias useful for those who follow TRADESHARE on youtube. This script is designed for traders who want assistance in determining their session bias, particularly for those who trade within sessions typically represented by a single 4-hour candle. The method involves using price action to establish a daily bias, guiding decisions on whether to focus on buys, sells, or both. The analysis is based on the previous daily and 4-hour candle closes, followed by an exami
FREE
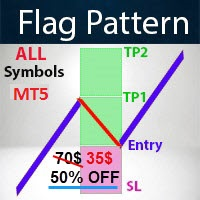
- Real price is 70$ - 50% Discount ( It is 35$ now )
Contact me for instruction, any questions! Introduction A flag can be used as an entry pattern for the continuation of an established trend. The formation usually occurs after a strong trending move. The pattern usually forms at the midpoint of a full swing and shows the start of moving. Bullish flags can form after an uptrend, bearish flags can form after a downtrend.
Flag Pattern Scanner Indicator It is usually difficult for a trade
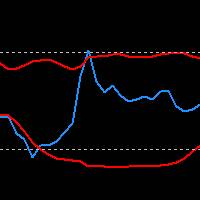
RSI Indicator with Bollinger Bands: Maximize Your Win Rate with Precision and Advanced Trading Strategies Take your trading to the next level with the RSI Indicator combined with Bollinger Bands. Customize the RSI period, band moving average, and deviation to tailor the indicator to your unique strategies. Upon request, we also offer the possibility to customize or create bespoke indicators to best meet your trading needs.
This indicator will draw lines for previous day Highs and Lows, current day open price and current day price plus and minus ATR. This will provide an overview of the support and resistance for the price movement of the current trading day. The ATR is fixed to the 1 day period, so this indicator is suitable for the time frames lower than 1 day, i.e. 4HRTF, 1HRTF or 15MTF.

Ultra-fast recognition of parabolic channels (as well as linear, horizontal and wavy channels) throughout the depth of history, creating a hierarchy of channels. Required setting: Max bars in chart: Unlimited This indicator is designed primarily for algorithmic trading, but can also be used for manual trading. This indicator will have a very active evolution in the near future and detailed descriptions on how to apply to create robots

Support and Resistance Malaysianは、サポートとレジスタンスの水準をチャート上に表示するカスタムインジケーターです。これらの水準は、マレーシアのSNR理論に基づいています。この理論では、水準は特定の価格水準を指し、エリアではありません。これらの価格水準は、ラインチャートのピークと谷に基づいています。 特徴: A-Level、V-Level、ギャップレベルの3つの種類の水準。 水準の新鮮さインジケータ:新鮮な水準は、未テストの水準や取引された水準よりも重要です。 新鮮な水準と新鮮でない水準の色とスタイルをカスタマイズ可能。 新鮮な水準のみを表示するか、すべての水準を表示するかを選択できます。 バックテスト期間と現在の価格上下の水準の数を調整可能。 複数のタイムフレームをサポート。 用途:
トレーダーは、MSnR Linesを使用して潜在的なサポートとレジスタンスの水準を識別し、取引の意思決定を行うことができます。新鮮な水準はより重要であり、より良い取引機会を提供する可能性があります。また、異なるタイムフレームの水準を使用してマルチタイムフレーム分析を行い

Insight Pro is a comprehensive tool for market analysis. It offers various features such as trend analysis, resistance and support levels, and distribution analysis, suitable for both novice and experienced traders. Features Trend Analysis Detects and visualizes market trends. Suggests potential entry and exit points based on trends. Customizable trend lines for clear market direction. Displays extreme levels based on standard deviation. Positive slope indicates buy orders; negative slope indic
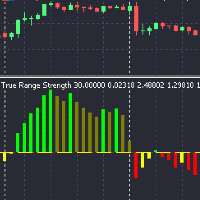
高度なトリガーオプションを備えたトゥルーレンジ強度インジケーター このインジケーターは、日々の価格変動に関連するさまざまな指標を計算および表示します: 指標 トゥルーレンジ (TR): (高値 - 安値, |高値 - 前日終値|, |安値 - 前日終値|) の最大値 TR 変動率 (TR_ROC): 日々の参考価格に対する TR の変動率 ポジティブ TR ROC の日計合計: 1日のポジティブ TR ROC 値の累積 ネガティブ TR ROC の日計合計: 1日のネガティブ TR ROC 値の累積 ポジティブおよびネガティブ TR ROC の日計合計の差: TR ROC の純累積 使用法 インジケーターを別のチャートウィンドウに追加します 入力から希望するプロットタイプ、値タイプ、およびトリガータイプを選択します インジケーターを使用して日々のボラティリティと価格変動の傾向を評価します カラーヒストグラムは純累積トレンドの迅速な視覚的リファレンスを提供します 注: このインジケーターは毎取引日の始めに計算をリセットします
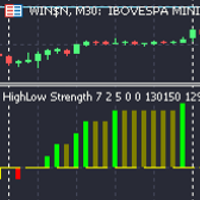
高低強度インジケーター 概要 高低強度インジケーター は、日中の新しい高値と安値がどのくらい頻繁に発生するかを 監視および表示するために設計された強力なツールであり、ピークとトラフとしても知られています。 または、高値と安値の頻度を追跡します。このインジケーターは、市場のトレンドや潜在的な反転を強調し、 市場分析や取引戦略を強化したいと考える投資家、日中のトレーダー、クオンツトレーダーにとって不可欠なツールです。
主な機能 このインジケーターは、「Count New Daily Highs and Lows」と「Count Highs and Lows」の2つの異なる方法で動作します。 「Count New Daily Highs and Lows」モードでは、日中の新しい高値と安値を追跡し、毎日の市場のピークとトラフに関する洞察を提供します。 「Count Highs and Lows」モードでは、現在の期間内の高値と安値をカウントして、即時の価格アクション分析を行います。各モードは、Cumulative Highs、 Cumulative Lows、および High Low

ボリンジャー バンド ダッシュボード インジケーターは、1 つのパネル (ダッシュボード) を使用して、さまざまな時間枠でボリンジャー バンド インジケーター シグナルを追跡する便利で有益な方法を提供します。このツールを使用すると、トレーダーは必要な情報を迅速かつ簡単に入手でき、市場での効率的な意思決定が可能になります。
主な特徴:
1. **シグナルパネル**: ダッシュボードには、選択した時間枠のボリンジャーバンドシグナルが表示され、明確で構造化された情報がユーザーに提供されます。 2. **時間枠設定の柔軟性**: ユーザーのニーズに応じて、任意の時間枠を有効または無効にする機能。これにより、特定の取引戦略の最も重要な時間間隔に集中することができます。すべてのタイム フレームがオフになっている場合、インジケーターには 3 つのハードコーディングされたタイム フレームが表示されます。これは、継続的な信号送信を保証するために行われます。 3. **カラー設定**: このツールは、さまざまなパネル要素に対して高度なカラー設定を提供します。 - ダッシュボードの背景 - テーブ

Blue and red support and resistance levels displayed directly on the chart. Alerts for close above resistance and close below support. Defaults:
EnableNativeAlerts = false; EnableEmailAlerts = false; EnablePushAlerts = false;
Really easy to trade with. There's no place like SR trading!
Disclaimer:
Support occurs where a downtrend is expected to pause due to a concentration of demand. Resistance occurs where an uptrend is expected to pause temporarily, due to a concentration of supply

Trend change > Arrows (' Up ' and ' Down ') When the icon appears in the indicator buffer ('Up' or 'Down'), Alerts are triggered. You can use 200 EMA to reduce false signals.
Enter trade when the arrow appears but wait until the candle closes Close trade when the line's color changes or use your own closing strategy. Works on all timeframes Works on all currencies Note
works better with other indicators or an existing strategy

ObieTrader is a short term signals indicator. It is used for intraday trading. ObieTrader identifies the short term trend using Williams percent R indicator and average true range. When a short term trend is confirmed by the indicator, it plots semaphores on the bar to show the trend. Bars with red dots indicate downtrend and bars with blue dots indicate uptrend.
When a trend is identified, open positions in the direction of the trend. When red circles appear open short position. When blue c

COLORED TREND MA / MACD CANDLES draw MA Candles above/below Moving Average draw MACD Candles above and below 0 and Signal-Line
Your Advantage: a simple view of the trend direction a simple view over the higher trend direction a calmer chart for the eye clear rules can be defined Settings: Value Quick-Set : pre-Settings MACD 3 / 9 / 6 MACD customize MA Candles Fast EMA : 12 Slow EMA : 26 MACD SMA : 9 1. MA Period : default 14 and 20, which are my favorite for all timeframes, I believe in the 1
FREE

When prices breakout resistance levels are combined with momentum oscillator breaks out its historical resistance levels then probability emerges to record farther higher prices. It's strongly encouraged to confirm price breakout with oscillator breakout since they have comparable effects to price breaking support and resistance levels; surely, short trades will have the same perception. Concept is based on find swing levels which based on number of bars by each side to confirm peak or trough
FREE

The Accelerator Oscillator (AC) technical indicator measures the acceleration or deceleration of the current market strength. It is designed to identify potential trend reversal points and is used to determine the moment of buying or selling assets. The indicator helps traders make decisions based on changes in market dynamics. This implementation of the indicator is its creative version. Since the standard version is very limited by its built-in settings, this implementation has significantly m

Our BOOM SELL ALERT indicator is specifically engineered to take candles on BOOM 1000 , BOOM 500 is tool is optimized for M1 (1-minute) timeframe, ensuring you receive timely and actionable insights. The indicator is a combination of many indicators. - AO Oscillator - Stochastic HOW TO USE THIS INDICATOR To use well this indicator , it need to use SCHAFF TREND RSX ( 5 MIN OR M5) IF SCHAFF trend RSX is GREEN and you have a signal then SELL when you have ENTRY and out with

RTS5Pattern-touch-mouse -EN is a revolutionary statistical indicator designed for the MetaTrader 5 platform, bringing an innovative approach to technical analysis and market movement prediction. This indicator combines advanced mathematical methods, including normalization and historical data analysis, with a user-friendly interface and precise trading capabilities. RTS5Pattern-touch-mouse -EN is an ideal tool for traders looking to improve their trading strategies and achieve better results.

When prices breakout resistance levels are combined with momentum oscillator breaks out its historical resistance levels then probability emerges to record farther higher prices. It's strongly encouraged to confirm price breakout with oscillator breakout since they have comparable effects to price breaking support and resistance levels; certainly short trades will have the same perception. Concept is based on find swing levels which based on number of bars by each side to confirm peak or trough
FREE

Unlock the power of Fibonacci with our advanced indicator!
This tool precisely plots Fibonacci levels based on the previous day's high and low, identifying the next day's key support and resistance levels. Perfect for day trading and swing trading, it has consistently generated weekly profits for me.
Elevate your trading strategy and seize profitable opportunities with ease.
NOTE: In the Input section make sure the draw labels are set to "True" so you can see each levels.

Limited Offer:
Take advantage of our limited-time offer on the FxBears Powers Indicator! When you purchase this powerful tool, you'll also receive the renowned FxBears EA, an expert advisor that automatically executes the indicator's signals. Don't miss out on this unbeatable combination to enhance your trading strategy! No more losses with this indicator, test it for years ago and see if there is losses in one day results. but before testing it please see the explaining video down here.

SMT (Smart Money Technique) Divergence refers to the price divergence between correlated assets or their relationship to inversely correlated assets. By analyzing SMT Divergence, traders can gain insights into the market's institutional structure and identify whether smart money is accumulating or distributing assets. Every price fluctuation should be confirmed by market symmetry, and any price asymmetry indicates an SMT Divergence, suggesting a potential trend reversal. MT4 Version - https:/

The indicator is based on the relationship between two sets of Stochastic lines. The first set consists of 6 Stochastic with periods: 5, 8, 10, 12, 14, 16. The second set consists of 6 Stochastic with periods: 34, 39, 44, 50, 55, 60. These periods are customizable. Input parameters Stochastic MA Method Method of calculation ===== Short-term ===== Stochastic #1 %K Period Stochastic #2 %K Period Stochastic #3 %K Period Stochastic #4 %K Period Stochastic #5 %K Period Stochastic #6 %K Period Short
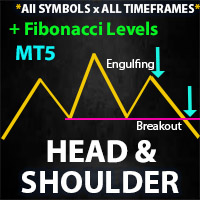
** All Symbols x All Timeframes scan just by pressing scanner button ** *** Contact me after the purchase to send you instructions and add you in "Head & Shoulders Scanner group" for sharing or seeing experiences with other users. Introduction: Head and Shoulders Pattern is a very repetitive common type of price reversal patterns. The pattern appears on all time frames and can be used by all types of traders and investors. The Head and Shoulders Scanner indicator Scans All char

** All Symbols x All Time frames scan just by pressing scanner button ** *** Contact me after the purchase to send you instructions and add you in "Order Block group" for sharing or seeing experiences with other users. Introduction: The central banks and financial institutions mainly drive the market, Order block is considered a market behavior that indicates accumulation of orders from banks and institutions, then the market tends to make a sharp move(Imbalance) on either side once

Market Heartbeat is in your hand! Introduction The Market Heartbeat indicator with a special enhanced algorithm (volume, money flow, cycle of market and a secret value) is a very repetitive trend finder with a high success rate . Interestingly, this Winner indicator indicates that the trend has changed its direction or the end of a trend retracement or even appears at the range market. The Market Heartbeat can use in scalping trading or trend trading. It finds immediately with alarm, n
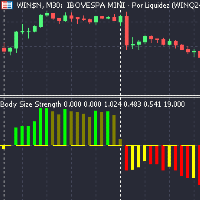
Body Size Strength Indicator Overview The Candle Body Size Strength Indicator provides a comprehensive suite of calculations that analyze daily price movements, delivering actionable insights that can significantly enhance your trading strategies.
Why Choose the Body Size Strength Indicator? Quantitative traders will appreciate the extensive calculations and buffers that this indicator offers. It is designed to integrate seamlessly with algorithmic trading systems, enhancing the precision and

the Spike detector show multiple indication for entries, for max profits enter on each indication given u can also add on lots size as entries go to secure max profits before spike occure, the more entries you enter along the way ,the more profits u have after the initial spike, after spike hold 3-5 candles before close for max profits . good on al timeframes max stop loss is 22candles.

Magnified Price Experience trading like never before with our Magnified Price indicator by BokaroTraderFx, designed exclusively for MetaTrader 5. This revolutionary tool provides traders with instant insights into price movements, offering a clear advantage in today's fast-paced markets.
Key Features: 1. Real-time Precision: Instantly magnify price action to uncover hidden trends and patterns. 2. Enhanced Visibility: Clear visualization of price movements with adjustable zoom levels. 3. Us
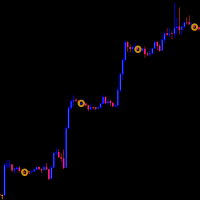
The Daily Closing Price Indicator marks the closing prices of previous days to easily spot them during chart analysis.
Features: -Available for MT5 only -Applicable in all instruments -Applicable in all timeframes
https://c.mql5.com/31/1144/daily-closing-price-indicator-screen-9611.png https://c.mql5.com/31/1144/daily-closing-price-indicator-screen-1492.png
https://c.mql5.com/31/1144/daily-closing-price-indicator-screen-5676.png
Parameters: https://www.mql5.com/data/temp/7867750/38bz

Key Features: Pattern Recognition : Identifies Fair Value Gaps (FVGs) Spots Break of Structure (BOS) points Detects Change of Character (CHoCH) patterns Versatile Application : Optimized for candlestick charts Compatible with any chart type and financial instrument Real-Time and Historical Analysis : Works seamlessly with both real-time and historical data Allows for backtesting strategies and live market analysis Visual Representation : Draws rectangles to highlight significant areas on the cha
Overview: Elevate your trading strategy with the Advanced SuperTrend Buy Sell Signals Indicator! Designed for both novice and professional traders, this indicator provides clear and accurate buy/sell signals based on the popular SuperTrend algorithm, enhanced with customizable parameters and visual alerts. Features: Clear Trend Visualization: Identifies UpTrends (green line) and DownTrends (red line) with precision. Customizable Parameters: Adjust ATR period and multiplier to fit your trading s

The AT Forex Indicator MT5 is a sophisticated trading tool designed to provide traders with a comprehensive analysis of multiple currency pairs. This powerful indicator simplifies the complex nature of the forex market, making it accessible for both novice and experienced traders. AT Forex Indicator uses advanced algorithms to detect trends, patterns and is an essential tool for traders aiming to enhance their forex trading performance. With its robust features, ease of use, and reliable signal
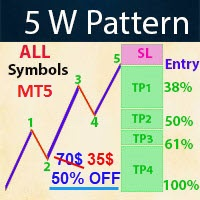
- Real price is 70$ - 50% Discount ( It is 35$ now )
Contact me for instruction, any questions! Introduction The Elliott Wave in technical analysis describes price movements in the financial market that are related to changes in trader sentiment and psychology. The 5 W Pattern (Known as 3 Drives) is an Elliott Wave pattern that is formed by 5 consecutive symmetrical moves up or down. In its bullish form, the market is making 5 drives to a bottom before an uptrend forms. In a bearish 5-d

このニュースアシスタントは、トレーダーが必要とする経済イベントを主要な出版ソースから取得するように設計されており、さまざまで簡単なフィルターを備えた端末のマーケットウォッチに基づいてリアルタイムでニュースを発行します。
外国為替トレーダーはマクロ経済指標を使用して、通貨の売買に関する情報に基づいた意思決定を行います。たとえば、トレーダーが米国経済が日本経済よりも速く成長すると信じている場合、米ドルを買って日本円を売るかもしれません。 マクロ経済イベントが外国為替市場に与える影響について詳しくは、こちらをご覧ください。 * 注意、このトレードアシスタントはストラテジーテスターでは機能しません 。イベントの情報を確認するには、ライブマーケットが必要です。 この製品の特徴: ブローカーのマーケットウォッチに基づいて商品を表示します 値は公開され次第 イベント発行者の主要な情報源から情報を受け取る イベント値解放時の警告 簡単なフィルタリングの可能性 最も近いイベントを表示する イベント値がリリースされる X 分前にアラートを送信 イベントに関する役立つ説明 現在の値と予測、イベントの重

ボリュームとマーケットプロファイルプロ 説明: MarketProfile インディケーターは、異なる価格レベルでの取引量の正確で詳細な分析を提供します。各取引日のボリュームプロファイルを計算して表示し、市場構造とボリューム分布を理解して、情報に基づいた取引の意思決定を支援します。 主な特徴: 日次ボリューム分析: インディケーターは各取引日のボリュームプロファイルを計算して表示し、異なる価格レベルでのボリューム分布を簡単に特定できるようにします。 ポイントオブコントロール (POC): POCは、当日の最大取引量の価格レベルを示す水平線として表示され、重要なサポートとレジスタンスレベルを特定するのに役立ちます。 バリューエリアハイ (VAH) とバリューエリアロー (VAL): これらの線は、70%の取引量が発生するバリューエリアの上限と下限を示します。この情報は、市場活動と価格反転の可能性のあるポイントを理解するために重要です。 セッションごとの色: インディケーターは、異なる取引セッション(アジア、ヨーロッパ、アメリカ)のために色分けされたバーを提供し、どのセッションで最も活動

Halo pedagang, indikator gedhe iki wis dirancang kanggo nganalisa pasar kanthi cara sing luar biasa. Bakal kasedhiya kanggo kabeh pedagang ing situs mql5 ing platform MT5.
Kaping pisanan, kudu ditekanake yen Indikator Dagang iki yaiku Non-Repainting, Non Redrawing lan Non Lagging Indicator Indicator, Sing ndadekake becik saka dagang manual lan robot, kanggo sinyal akurat sing paling apik!.
Analytics AI beda karo kabeh sing dikenal
amarga? , nduweni analisis internal sing canggih bange

この製品は、ブローカーサーバーのタイムゾーンに基づいて15か国の取引セッションを表示するように設計されており、希望の設定に基づいたさまざまな表示モードにより、チャートの混雑を防ぎ、ユーザーの希望の時間でセッションを設定することが可能です。
外国為替市場に太陽が沈むことはありませんが、そのリズムは独特の取引セッションのビートに合わせて踊ります。これらのセッション、それらの重複、およびその独特の雰囲気を理解することは、市場に逆らうのではなく、市場とともに動きたい外国為替トレーダーにとって非常に重要です。
Tokyo China London Canada New York Moscow Saudi Arabia ... USDJPY *** *
***
AUDJPY ***
NZDUSD *
***
EURAUD
**
GBPUSD
***
***
EURCHF
***
USDCHF
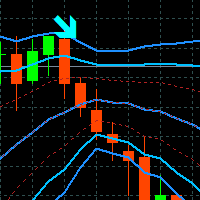
Tyr Bands Indicator
Tyr Band works with BB and 3 different deviations, plus the Stochastic confirmation. So when the price closes below/above the BB Reversal Band (Red) and the Stoch is in the confirmation zone, then the arrow (buy/sell) appears. This arrow indicates that we can entry to the market up/down on the next opening. Since it is only an indicator, it will not place SL or TP, we need to have them placed manually if you want to trade. The SL will lie on the external BB band (Blue), and
FREE

Probability emerges to record higher prices when MACD breaks out oscillator historical resistance level. It's strongly encouraged to confirm price breakout with oscillator breakout since they have comparable effects to price breaking support and resistance levels; surely, short trades will have the same perception. As advantage, many times oscillator breakout precedes price breakout as early alert to upcoming event as illustrated by 2nd & 3rd screenshot. Furthermore, divergence is confirmed in c
FREE
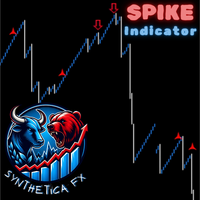
The SyntheticaFX Spike Indicator for MetaTrader 5 is an advanced trading tool designed to enhance your trading strategy by detecting potential spikes and analyzing market trends across various timeframes. This indicator is specifically tailored for the Crash and Boom indices, providing timely alerts and essential trend information to help you make informed trading decisions.
Key Features:
1. Spike Detection: - Identifies potential spikes on the following indices and timeframes:
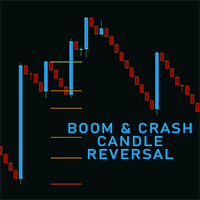
Indicator for Boom and Crash Synthetic Indices The indicator will be sold in a limited quantity. The current price of the first 5 licenses is $200
The next price is $300
We present a specialized technical indicator designed exclusively for Boom and Crash synthetic indices offered by Deriv broker. This tool is tailored for traders who prefer a methodical approach to trading with clearly defined price levels.
Indicator Functionality: • Displays key price levels for position entry •

Probability emerges to record higher prices when MACD breaks out oscillator historical resistance level. It's strongly encouraged to confirm price breakout with oscillator breakout since they have comparable effects to price breaking support and resistance levels; surely, short trades will have the same perception. As advantage, many times oscillator breakout precedes price breakout as early alert to upcoming event as illustrated by 2nd & 3rd screenshot. Furthermore, divergence is confirmed
FREE

This is the Cumulative Volume Delta (CVD) , it's an indicator that calculates the long and short volumes plotting it then as a line on the chart, the most efficient way to use this indicator is by comparing the CVD line to the current chart and looking at the Divergence beetween the two of them, so that you can identify fake-outs and liquidty sweeps. for example in the picture that i put below you can see that the price has made a lower low but the CVD didn't, that means the volumes didn't suppo
FREE
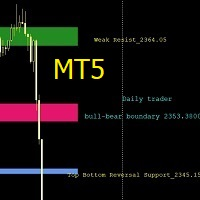
Support and Resistance Levels is an intelligent indicator that displays horizontal support and resistance levels, suitable for traders of different trading frequencies. You can select your preferred trading frequency, and the indicator will automatically calculate the support and resistance levels relevant to that frequency. Among these, the Bull-Bear Line is an interval used to distinguish the strength of bullish and bearish forces, and is an important level.
You can combine it with other in

This is the Volume Avarage Weighted Price (VWAP) it's a indicator that shows where is the avarage of the current volumes and the levels at which the price is considered premium, above the second upper band, or discount, under the second lower band, it's also very usefull to use the VWAP level as a target for operations since it's a very liquid level so the price it's attracted to it. feel free to leave a feedback either positive or negative based on your expereince with this indicator, enjoy the
FREE

The DD_PL Running MT5 indicator is a trading tool developed by the Dagangduit Core Team . This indicator is designed to display real-time running profit and loss (P/L), providing essential information about your trading account's performance. Key Features: Real-Time P/L Monitoring : Calculates and displays profit and loss in real-time. Visual Indicator : Uses labels and colors to provide a visual representation of profit and loss status. Customizable Display : Allows adjustment of text color, b
FREE

The DD_Profit_Monitor MT5 indicator is a trading tool developed by the Dagangduit Core Team . This indicator is designed to monitor profits in real-time with the following key features: All Time Profit : Displays the total profit earned since the beginning of the trading account's usage. This feature helps traders see the overall performance of their trading activities. Daily Profit : Displays daily profits, allowing traders to monitor their daily performance more specifically. Key Features: Al
FREE
MetaTraderマーケットは、履歴データを使ったテストと最適化のための無料のデモ自動売買ロボットをダウンロードできる唯一のストアです。
アプリ概要と他のカスタマーからのレビューをご覧になり、ターミナルにダウンロードし、購入する前に自動売買ロボットをテストしてください。完全に無料でアプリをテストできるのはMetaTraderマーケットだけです。
取引の機会を逃しています。
- 無料取引アプリ
- 8千を超えるシグナルをコピー
- 金融ニュースで金融マーケットを探索
新規登録
ログイン