适用于MetaTrader 5的新技术指标 - 6
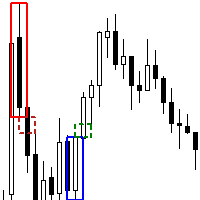
The Order Block FVG Box indicator for MetaTrader 5 is a powerful tool designed for discerning traders looking to identify and capitalize on high-probability trading opportunities. This indicator excels at pinpointing valid Order Blocks that are immediately followed by Fair Value Gaps (FVG), enhancing your trading strategy with precise visual cues. Key Features: Order Block Identification : Detects valid Order Blocks, which are significant areas where institutional buying or selling has occurred,
FREE

If you need an indicator that shows market entry points, then this is your indicator.
The indicator is not redrawn. Shows buy and sell points for any TF (time frame) and any currency pair. Settings are adjustable for all instruments. You can configure each parameter for any broker, for any account.
This is a PILLOW that is comfortable :)) Just check it out.....

### 介绍 MetaTrader 5 的终极枢轴点水平指标
Ultimate_Pivot_Levels 是一种多功能工具,旨在通过准确绘制枢轴点水平来增强您的交易体验。它允许您手动输入所需的值或使用众所周知的枢轴点计算方法来创建枢轴点水平。它在背景中绘制这些水平,并允许您自定义水平、区域的大小和颜色,同时在每个新柱状图中保持您的调整。无论您是新手交易者还是经验丰富的专业人士,此指标都能为您提供灵活性和精确度,使您能够做出明智的交易决策。
### 主要特点
1. **多种枢轴点计算方法**:Ultimate_Pivot_Levels 指标支持多种枢轴点计算方法,允许您选择最适合您的交易策略的方法:
- **手动值**:输入您的自定义枢轴点水平,或从所需的频道或网站复制粘贴。
- **标准方法**:基于前一周期的高、低和收盘价格的经典枢轴点计算方法。
- **Camarilla 方法**:以其独特公式而闻名的流行方法。
- **Woodie 方法**:一种变体,更多地考虑了收盘价。
- **DeMark 方法**:由 T
FREE

The Multi Asset Monitor Panel is a game-changer for traders who need to keep an eye on multiple markets simultaneously. This innovative panel allows you to monitor any symbol and any timeframe you need, all within a single, organized interface. With up to three lists of symbols and customizable MT5 templates, you can tailor your monitoring setup to fit your specific trading strategy. What sets the Multi Asset Monitor Panel apart is its flexibility and customization options. You can control the s

Conquistador is a fundamental technical indicator designed to assess the current market situation and determine the optimal entry and exit points in the currency pairs market with minimal risk. This indicator was created on the basis of original indicators for searching for extremes and is excellent for determining a reversal or sharp movement of the market. Thanks to Conquistador, you can recognize such moments in a timely manner and receive notifications in the form of colored dots on the cha
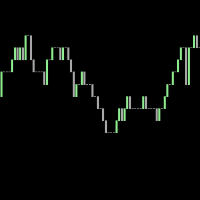
This is a tick indicator which compares the current bid price with the previous bid directly before it, and draws candles based on a comparison of the current ticks. It does not use historical ticks. Everything happens in real time, data moves from right to left, and the newest data arrives at the right. A trend line can be added which points in the direction of the price shifts.
FREE

K线剩余时间的作用是 为了帮助交易者更好地理解市场动态,并做出更精准的交易决策 。在金融市场中,尤其是外汇和二元短线交易领域,了解K线图的剩余时间对于交易者来说至关重要。下面将详细探讨K线剩余时间指标的重要性及其在不同交易策略中的应用: 提高交易时机把握的准确性 精确计时 :通过显示当前K线周期的剩余时间,交易者可以更精确地把握入场和出场的时机 。 避免延误 :减少因估计时间而产生的误差,避免在关键时刻延误操作 。 优化策略执行 :使交易者能够在K线闭合前及时调整其交易策略,以应对市场变化。 增强交易体验 辅助工具 :作为辅助指标,K线剩余时间可以提高交易者的交易体验,减少心理负担 。 减轻心理压力 :通过直观显示剩余时间,减轻交易者在交易过程中的心理压力,特别是在快速变化的市场中。 提升交易效率 :使交易者能够更加专注于市场分析,而不是频繁检查时间。 适应不同交易周期 多周期适用性 :无论是一分钟、五分钟还是更长的时间周期,K线剩余时间指标都能提供准确的时间信息 。 灵活调整 :交易者可以根据不同的交易策略和市场条件,灵活调整对时间敏感度的需求。 支持复杂策略 :对于实施多时间框架分
FREE

成交量在交易中扮演着至关重要的角色,它是衡量市场活跃度和投资者情绪的关键指标。以下是成交量对交易的几个重要作用: 确认趋势 :道氏理论强调了成交量在确定市场趋势中的重要性。较大的成交量通常表明市场多空双方的分歧较大,而较小的成交量则可能意味着市场对当前价格的认同度较高。 捕捉主力动作 :通过一段时间的成交量分析,可以捕捉到主力资金的动向。一天的成交量可能会被操纵,但长期的成交量更能真实反映市场主力的行为。 预测价格变动 :成交量的变化往往先于价格变动。例如,价格上涨时伴随着成交量的增加,可能预示着后市将继续上涨;相反,如果价格上涨但成交量减少,则可能意味着上涨动力不足。 衡量市场活跃度 :成交量的大小可以直接反映市场的活跃程度。高成交量表明市场活跃,低成交量则可能意味着市场冷淡。 供需关系的体现 :成交量是市场供需关系的直接表现。供不应求时,成交量会放大;供过于求时,成交量会萎缩。 辅助技术分析 :在技术分析中,成交量与价格、时间和空间一起构成了分析的四大要素。成交量的分析可以帮助投资者更准确地判断市场趋势和转折点。 决策依据 :有经验的投资者会将成交量作为进出市场的依据之一。例如,带

Product Description: Adaptive Y-Axis Scaling is a powerful MT5 indicator designed to enhance your trading experience by providing precise control over the Y-axis (price) scaling of your charts. This innovative tool allows you to customize the price scaling by specifying the number of pips from the visible chart's highs and lows. The calculated price range from this input is then used to set the maximum and minimum prices for the open chart, ensuring an optimized and comprehensive view of market
FREE

O LIVRO VISUAL é uma ferramenta que auxilia na identificação de escoras e renovação de ordens, para quem opera Tape Reading ou fluxo no gráfico é uma excelente ferramenta. Porem ele funciona somente em Mercados Centralizados ou com profundidade nível 2. É de fundamental importância você saber que ele não funciona em Mercado de FOREX. Porem pode ser utilizado no Mercado da B3.
>>> BIG SALE PROMOTION: 50% OFF + GIFT EA! - Promo price: $64 / Regular price $129 <<< - The promotion will end soon!
The Forex Trend Tracker is an advanced tool designed to enhance the trading capabilities of forex traders. This sophisticated indicator uses complex mathematical formulas alongside the Average True Range (ATR) to detect the beginnings of new upward and downward trends in the forex market. It offers visual cues and real-time alerts to give traders a competitive advantage in th

This indicator displays the remaining time of the current candle, providing a visual representation of the time left until the candle closes and a new one begins, helping traders to make more informed decisions and stay on top of market fluctuations with precise timing, enhancing their overall trading experience and strategy execution, and allowing them to optimize their trades and maximize their profits.
FREE

This spread indicator displays the actual spread of each candle. It highlights the maximum spread and the minimum spread of the chosen symbol. This indicator is very helpful to see in real time the spread evolution helping to avoid taking a trade when the spread is too high.
Inputs:
Print value in Points: if true displays the spread as a whole number
D isplay minimum and maximum spread of the past N days: select the number of days to consider the maximum and minimum spread
Automatically
FREE

Description of the Indicator The indicator "BullsBearsPulse" is designed for MetaTrader 5 and provides a visual representation of the Bulls Power and Bears Power indicators. These indicators are useful tools for technical analysis, particularly for the EUR/USD currency pair, to help traders identify potential trading opportunities. Functionality Bulls Power : This indicator measures the strength of the bulls (buyers) in the market. It calculates the difference between the highest price and a 20
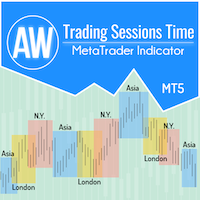
为了方便交易者获取市场表现数据并更好地制定交易策略,我们开发了交易时段指标。各个交易所的开盘时间会影响交易,因为它会影响市场活动和交易量。这些因素决定了不同工具的波动性和交易机会。 AW 交易时段指标显示亚洲、伦敦和纽约市场的交易时间。交易者可以显示或隐藏不同的时区以获得更好的体验。在图表上,您可以看到距离交易时段结束的时间,以及交易时段的大小。图表上数据的显示具有灵活的图形调整,适合不同风格的交易图表。
更多产品 -> 这里
优点:
显示亚洲、伦敦和纽约交易时段, 如果有必要,以数字显示会话大小, 开启后,显示交易时段结束的时间, 可以单独禁用交易时段, 图表上可自定义的会话边框样式 如果需要,可以在图表上显示垂直线 可以用纯色显示会话 自定义会话文本(颜色、偏移量、名称)
输入变量:
主要设置 Number_of_Days-显示指标的天数。
Show_Session_Size_in_Points - 启用后,指标将显示每个交易时段规模的数字值(以点为单位)。
Show_Time_Until_end_of_Session - 在图表的右上角显示或隐藏会话结束的时
FREE

Fractals Dynamic Fractals Dynamic – 是 Bill Williams 改進的免費分形指標,您可以在其中手動設定左側和右側的柱形數量,從而在圖表上建立獨特的模式。 现在所有基于或基于分形动态指标的交易策略都将有一个额外的信号。
此外,分形可以充当支撑位和阻力位。 在一些交易策略中,显示流动性水平。 为此,在这个版本的多分形和多帧指标 MultiFractal Levels 中引入了水平。 您会发现这个指标在任何价格图表上作为您交易的助手更具信息性,视觉性和实用性。 使用分形動態指標作為您交易系統的補充 也試試我在市面上的其他產品 https://www.mql5.com/ru/users/capitalplus/seller
祝您在交易中獲得豐厚的利潤!
FREE

Introduction
The "Smart Money Concept" transcends the realm of mere technical trading strategies to embody a comprehensive philosophy on the dynamics of market operations. It posits that key market participants engage in price manipulation, thereby complicating the trading landscape for smaller, retail traders.
Under this doctrine, retail traders are advised to tailor their strategies in alignment with the maneuvers of "Smart Money" - essentially, the capital operated by market makers

Course Crystal是一種幫助交易者確定市場趨勢方向的指標。 它使用獨特的演算法來分析價格變動,並將結果顯示在圖表上的彩色區域中。 藍色表示買入機會,紅色表示賣出機會。 使用說明 - https://www.mql5.com/en/blogs/post/757800 手動交易系統:
趨勢確定:Course Crystal 指標分析當前和過去的價格資料以確定趨勢的總體方向。 如果大多數數據顯示價格上漲,則該指標會變成藍色。 如果數據顯示價格下跌,則指示器變為紅色。 進入交易的訊號:當指標的顏色從紅色變為藍色時,這可能是買入訊號。 當指標顏色從藍色變成紅色時,可能是賣出訊號。 風險管理:始終為每筆交易設定停損和獲利來管理風險非常重要。 建議將停損設定在高於(買入)或低於(賣出)最後高點或低點的水平。 退出交易:當達到停盈或停損水準或指標向相反方向改變顏色時,交易關閉。 請記住,沒有任何指標是 100% 準確的,將指標與其他技術分析和風險管理工具結合使用始終很重要。 交易愉快!
FREE

ATR is an important indicator for any financial market. The abbreviation ATR stands for Average True Range. This indicator is a tool to determine the volatility of the market, this is its direct purpose. ATR shows the average price movement for the selected period of time. The initial price of the indicator is 63$. The price will increase every 10 sales up to 179$ The original ATR indicator is present in many trading programs. The ATR indicator is not very informative, so I modified its data a
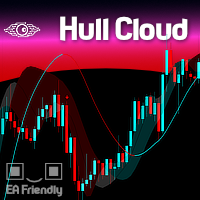
The Hull Moving Average is known for its ability to reduce lag and provide a clearer, more accurate depiction of market trends. By smoothing price data more effectively than traditional moving averages, it helps traders identify trend directions and reversals with greater precision. The Hull Cloud indicator elevates this by using four Hull Moving Averages working together like an orchestra. This combination creates a dynamic system that highlights short, medium, and long-term trends, giving trad

This indicator is the converted Metatrader 5 version of the TradingView indicator "ATR Based Trendlines - JD" by Duyck. This indicator works by automatically and continuously drawing trendlines not based exclusively on price, but also based on the volatility perceived by the ATR. So, the angle of the trendlines is determined by (a percentage of) the ATR. The angle of the trendlines follows the change in price, dictated by the ATR at the moment where the pivot point is detected. The ATR percentag
FREE
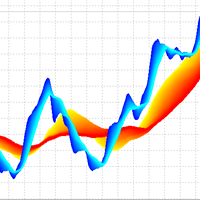
3D Trend Indicator is a non-repaint indicator using multiple moving averages with a 3D surface view. By using this indicator, you can remove uncertainties that can happen using a single and fixed moving average period. You can use a cloud area using a range of moving average periods. Also a wide range of visual settings are added to this indicator to have a better view from the cloud area. Alert and notification system added to the indicator to inform the trader about the action of candles on t

Introducing our state-of-the-art Wave Indicator, meticulously designed for the discerning traders of the MQL5 community! At the core of this innovative tool lies an unmatched sensitivity to capture even the slightest market movements. Our Wave Indicator serves as the foundational element for constructing comprehensive trading strategies, providing you with an unwavering edge in the dynamic world of finance. Whether you're aiming to refine short-term tactics or develop long-term systems, this ind

TMA CG FAST MT4 REPLICADO PARA MT5 Cuenta con todas las caracteristicas del original con la funcion adicional de tener señal al fallo que consiste en que despues de una cantidad de velas establecida por el usuario emita una preseñal para una potencial entrada tiene alerta sonora para la posible entrada y la entrada definitiva tiene la posibilidad de repintar o no , queda a eleccion de usuario
Apresentamos o Indicador de novo grafico - uma ferramenta poderosa para traders que buscam uma análise de preço suave e clara. Este indicador inovador calcula a média simples dos preços, oferecendo uma visão precisa e ajustada dos movimentos do mercado. Como Funciona : O Indicador de Média de Preços Simples (SMA) utiliza uma fórmula simples e eficaz: Ele soma o valor do último preço com o preço anterior. Em seguida, divide essa soma por 2 para obter a média. Fórmula : SMA = U ˊ ltimo Pre c ¸ o +
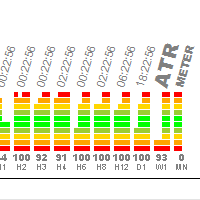
该指标旨在快速确定仪器的波动性。 改变图表是非常方便的,以立即了解哪些工具和时间段有一个活跃的交易,以及哪里有一个平静。 该指标使用转换成百分比的ATR指标的数据。 如果您将ATR放在图表上,大约100-300条将在屏幕上可见,我将此值平均并默认设置为150(您可以自行决定在设置中更改它)。 操作原理:我们取150个ATR值,找到最大和最小,它们之间的距离是100%,基于此我们计算当前位置的百分比。 指标的每一列对应于它自己的时间段,分为4段(3、2、1、0是当前的柱)。 这样做是为了说明ATR指标的行为。
设置: 1)"警报如果信号"组
如果指标超过50%,将显示一个包含工具描述和周期的窗口。
使用警报1TF如果信号-是否使用信号通知
信号时间段1-信号搜索时间段
到目前为止,已经完成了5个时间段。.. (如有必要,您可以添加)
2)ATR设置
ATR周期=14-默认
历史条返回-使用多少条来计算100%百分比
3)查看和警报系统信息-显示有关指示器操作的系统信息
使用建议:
为了实现指标的最佳和快速操作,您应该减少图表上显示的柱线数量:

Ultra-fast recognition of parabolic channels (as well as linear, horizontal and wavy channels) throughout the depth of history, creating a hierarchy of channels. Required setting: Max bars in chart: Unlimited This indicator is designed primarily for algorithmic trading, but can also be used for manual trading. This indicator will have a very active evolution in the near future and detailed descriptions on how to apply to create robots

3 Indicators in 1 indicator
Strategy based on price action
Made specifically for the best forex currency pairs
Can be used in the best time frame of the market
at a very reasonable price This indicator is basically 3 different indicatos . But we have combined these 3 indicators in 1 indicator so that you can use 3 indicators at the lowest price.
All three strategies are based on price action. But based on different trends. Long term, medium term and short term
Attributes : No repaintin

順應潮流。是的,在 15 分鐘的框架上等待進場信號,無論是買入還是賣出,並檢查信號是否出現在 30 分鐘的框架上(有時信號需要一個小時或更長時間才會出現。您可以返回到15分鐘框架並返回到30分鐘框架,重複此操作,直到主要訊號出現在您面前。被記錄,或當相反的訊號出現時它非常簡單並且適用於所有主要貨幣。 金屬、指標和所有框架,但最好的結果是 30 分鐘框架。
始終將止損設置在蠟燭底部下方,資金管理不得超過 資本的10% 順應潮流。是的,在 15 分鐘的框架上等待進場信號,無論是買入還是賣出,並檢查信號是否出現在 30 分鐘的框架上(有時信號需要一個小時或更長時間才會出現。您可以返回到15分鐘框架並返回到30分鐘框架,重複此操作,直到主要訊號出現在您面前。被記錄,或當相反的訊號出現時它非常簡單並且適用於所有主要貨幣。 金屬、指標和所有框架,但最好的結果是 30 分鐘框架。
始終將止損設置在蠟燭底部下方,資金管理不得超過 資本的10%
順應潮流。是的,在 15 分鐘的框架上等待進場信號,無論是買入還是賣出,並檢查信號是否出現在 30 分鐘的框架上(有時信號需要一個小時或更長時

MultiFractal Levels MultiFractal Levels – 這是經過修改的 Bill Williams 分形指標,增加了等級。 分形是根據設定中允許的所有 TF 建構的。
水平僅基於尚未經過價格測試的最新分形構建。 與原廠終端指示器相比的優點: 方便 能見度 資訊性 最新等級 可自訂的分形 可自訂的級別 此指標很方便,因為您在工作時無需切換到不同的時間範圍。
可見度 - 在一張圖表中,您可以看到從小到中、大市場走勢的圖表結構。
資訊內容-從視覺上我們獲得更多有關圖形的資訊。
自訂分形可以從兩側進行更改:可以在設定中指定左側和右側的條形數量。
可變更可自訂的水平:根據極值繪製,或根據訊號陰影(中央蠟燭)繪製為區域。 因此,如果舊 TF 的分形具有較大的陰影,則當前 TF 上的符號將很大。
現在,所有基於或基於多重分形指標的交易策略都將具有附加訊號。 此外,分形可以充當支撐位和阻力位。 並且在一些交易策略中,顯示流動性水準。 為此,引入了層次。
使用多重分形水平指標作為您交易系統的補充
也試試我在市面上的其他產品 https://ww

当然可以!以下是您提供的文本的中文翻译: 引入 MT4 / MT5 天文指标:您的终极天体交易伙伴 您准备好将交易体验提升到天文高度了吗?不用再寻找,就在我们的革命性 MT4 天文指标中。这个创新工具超越了传统的交易指标,利用复杂的算法提供无与伦比的天文洞察力和精确计算。 指尖上的宇宙信息: 瞻仰一个详尽的面板,展示了一宝藏般的天文数据。了解行星的地理/太阳心坐标,太阳/地球距离,亮度,伸长度,星座,黄道和赤道坐标,甚至是水平坐标——每个细节都经过精心计算并呈现得美轮美奂。指标生成的垂直线对应于时间值,为您的交易旅程提供了宇宙的视角。 行星线条与关系: 在您的图表上欣赏行星线条的魔力,具有可自定义的比例和角度。通过直观的控制面板轻松切换每个行星线条的可见性。通过连结、六分、四分、三分、对冲和逆行等指标,发现行星关系的艺术。在您选择的时间范围内探索这些宇宙构造,使您能够识别重要的交易机会。 揭示甘恩的智慧: 通过受甘恩启发的平方垂直线揭示潜在的反转时机。这种创新修改将甘恩历经考验的原则带入现实,帮助您提前了解市场的转向和趋势。 月亮引导: 在您的图表上优雅地导航月相,

Contact me for instruction, any questions!
Introduction The breakout and retest strategy is traded support and resistance levels. it involves price breaking through a previous level. The break and retest strategy is designed to help traders do two main things, the first is to avoid false breakouts. Many false breakouts start with a candlestick that breaks out of a level but ends with an immediate candlestick that brings the price back into the level. The second thing that the breakout and re

Heikin Ashi candlesticks are a powerful tool for traders, offering a clear and smooth visualization of market trends. Unlike traditional candlesticks, they filter out market noise, providing a cleaner view of the market's direction and strength, which helps traders make more informed decisions. The Hull Heikin Ashi Smoothed indicator from Minions Labs takes this a step further by integrating the Hull Moving Average for enhanced smoothing and precision. This indicator not only simplifies trend id
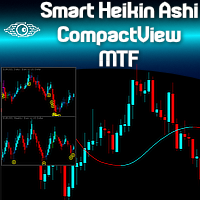
Are you already a fan of the Minions Labs Smart Heikin Ashi chart analysis tool? Or perhaps you're looking for a versatile Heikin Ashi chart capable of operating across multiple timeframes? Want to see the bigger picture before diving into the details, to make smarter ENTRY decisions? Do you want to build your own Dashboard of Symbols in just one chart, without dealing with messy multi-window MT5 stuff? Welcome to the Minions Labs Smart Heikin Ashi CompactView MTF indicator! Please see the power

This is actually just a combination of 3 classic TTM_Squeeze indicators, nothing special. As I know exactly this is implemented in original TTM_Squeeze PRO indicator. It shows strong, middle and weak squeeze. If someone interested, TTM_Squeeze is not completely John Carter's invention. Concept of squeeze is commonly known as well as the method of squeeze search using Bollinger Bands and Kelthner Channels. How to use
As always there is a lot of variations. For example here is simple strategy Us
FREE

Highly configurable Trader Dynamic Index (TDI) indicator.
Features: Highly customizable alert functions (at levels, crosses, direction changes via email, push, sound, popup) Multi timeframe ability (higher and lower timeframes also) Color customization (at levels, crosses, direction changes) Linear interpolation and histogram mode options Works on strategy tester in multi timeframe mode (at weekend without ticks also) Adjustable Levels Parameters:
TDI Timeframe: You can set the lower/higher
FREE

Introduction
The "Smart Money Concept" transcends mere technical trading strategies; it embodies a comprehensive philosophy elucidating market dynamics. Central to this concept is the acknowledgment that influential market participants manipulate price actions, presenting challenges for retail traders.
As a "retail trader", aligning your strategy with the behavior of "Smart Money," primarily market makers, is paramount. Understanding their trading patterns, which revolve around supply

PMax is a brand new indicator developed by KivancOzbilgic in earlier 2020.
It's a combination of two trailing stop loss indicators;
One is Anıl Özekşi's MOST (Moving Stop Loss) Indicator and the other one is well known ATR based SuperTrend. Both MOST and SuperTrend Indicators are very good at trend following systems but conversely their performance is not bright in sideways market conditions like most of the other indicators.
Profit Maximizer - PMax tries to solve this problem. PMax

The indicator determines the ATR value (points) in a classic way (taking into calculation paranormal bars/candles) and more correctly - ignoring paranormal movements of the Instrument. Correctly it is excluding paranormal bars from the calculation, extremely small bars (less than 5%( customizable ) of the standard ATR) and extremely large bars (more than 150% ( customizable ) of the standard ATR) are ignored. This is a Extended version - allows you to set calculation parameters a
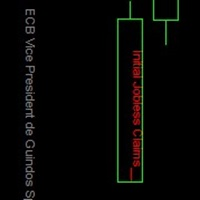
This is one of the most powerful indicators I've ever made.
I was tired of looking at other windows/websites for economical news, and regularly something would happen without me realising.
So I made this indicator which displays all news at the exact time of arrival, directly on the charts!
Now you too can just focus on the charts and know that you won't miss any news events.
There are options:
1. You can choose to display on the price line, or at the bottom of the chart. 2. You can
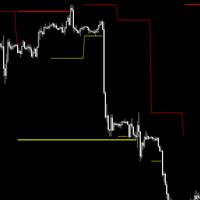
## Check screenshots to see proof that this indictor is a must! ##
Do you hate having to have a Monthly, Weekly, Daily chart when looking at your lower timeframes? I hated it too, so I made this. It will show you the High and Low of other timeframes on your chart, so you will always be aware where some support/resistance may be! Even on the 1 minute chart!
I recommend you use it 3 times, one with Day, Week and Month selected with different line widths.
I use this on every chart I look at
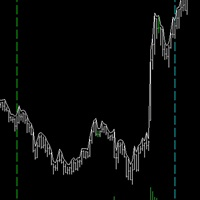
This is one of my most important indicators. Did you ever miss the session open/close? I did, which is why I made this indicator. It took a long time to get this right, since depending on your platform and timezone, it can be incorrect. It should be accurate for everyone now. It takes into account Daylight savings for NY and EU timezones, and should just work like magic on your charts.

The Fat and Slim indicator tracks strong and weak money in the market. It is derived from RSI, MFI and many similar indicators. Input values are closing prices and volumes. The RSI (yellow curve) is in the range -100 ... 100. It is additionally multiplied by a coefficient so that the curve is not compressed to the middle values at higher periods (a problem with the classic RSI with different periods). Strong/Fat red curve is RSI weighted by higher volumes. Weak/Slim blue curve is calculated so t

Overview
In the evolving landscape of trading and investment, the demand for sophisticated and reliable tools is ever-growing. The AI Trend Navigator is an indicator designed to meet this demand, providing valuable insights into market trends and potential future price movements. The AI Trend Navigator indicator is designed to predict market trends using the k-Nearest Neighbors (KNN) classifier.
By intelligently analyzing recent price actions and emphasizing similar values, it help
The Boom300 Spike Indicator is a powerful tool designed to identify significant price spikes in the market.
Key Features: Real-time Spike Detection: The indicator continuously scans the market for sudden spikes in price action, providing timely alerts when significant spikes occur. And recommend to use the 1Min chart Customizable Alerts: Traders can customize alerts to suit their preferences, including audible alerts, email notifications, and push notifications to mobile devices. User-Friend

Description: The Spike Sniper Crash Market Indicator is a sophisticated tool designed to identify and navigate volatile market conditions, often associated with sudden price spikes and market crashes. Leveraging advanced algorithms and technical analysis, this indicator serves as a vigilant guardian, alerting traders to potential market disruptions and providing actionable insights to mitigate risks and capitalize on opportunities. Key Features: Precision Spike Detection: The indicator employs c
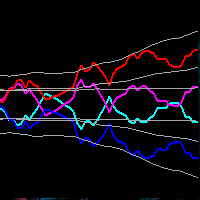
This indicator obeys the popular maxim that: "THE TREND IS YOUR FRIEND" Channel indicators incorporate volatility to capture price action. The Bollinger Bands is widely used, however, there are other options to capture swing action opportunities. Each study you will find here is unique, and reveals different types of price action.
https://www.mql5.com/en/market/product/116256
https://www.mql5.com/en/market/product/115553
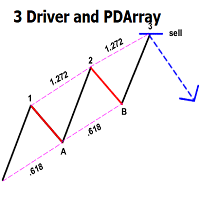
This indicator automatically identifies the SMC 3-Drive pattern and sends notifications to users when the pattern is detected. Additionally, the indicator identifies PDArray (including FVG and OB) and offers an option to combine the 3-Drive pattern with PDArray. This combination provides users with more reliable signals. What is the 3-Drive Pattern? This pattern is formed by three price pushes in one direction, providing a strong reversal signal (Figure 3). The key to identifying this pattern is
With this indicator TheStrat bar numbers can be displayed above and below candles of the chart. The numbers have the following meaning: 1 = Inside Bar 2 = Directional Bar 3 = Outside Bar. In TheStrat-method there are Actionable and In-Force patterns / combos to define entries for trades. These patterns are also displayed by the indicator.
Here are the settings that can be configured: Number of lookbar bars : For how many candles in the past numbers are dislayed Color of inside bar : The color

This is the MT5 version of Ku-Chart.
This is an indicator devised by Ku-chan, a famous Japanese trader, based on the dealings of Lehman Brothers' discretionary traders. Unify the measuring stick of currencies to display the true value of currencies.
Although it is an indicator, it does not use a buffer and is displayed using objects such as trend lines. Also, instead of drawing on the subchart, it is drawn in an area far above the current price of the main chart, so you can switch from the

Introduction
"Smart money" is money invested by knowledgeable individuals at the right time, and this investment can yield the highest returns.
The concept we focus on in this indicator is whether the market is in an uptrend or downtrend. The market briefly takes a weak and reversal trend with "Minor BoS" without being able to break the major pivot.
In the next step, it returns to its main trend with a strong bullish move and continues its trend with a "Major BoS". The "order bloc
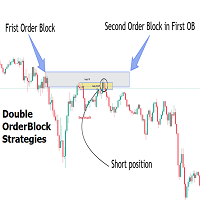
Introduction
The Price Action, styled as the "Smart Money Concept" or "SMC," was introduced by Mr. David J. Crouch in 2000 and is one of the most modern technical styles in the financial world. In financial markets, Smart Money refers to capital controlled by major market players (central banks, funds, etc.), and these traders can accurately predict market trends and achieve the highest profits.
In the "Smart Money" style, various types of "order blocks" can be traded. This indicator

MACD is probably one of the most popular technical indicators out there. When the market is trending, it actually does a pretty good job, but when the market starts consolidating and moving sideways, the MACD performs not so well. SX Impulse MACD for MT4 is available here . Impulse MACD is a modified version of MACD that works very well for trading Forex, stocks, and cryptocurrencies. It has its own unique feature which perfectly filters out the values in a moving average range and enables it

Certainly! Let me introduce you to a powerful tool for MetaTrader 5 (MT5) that can automatically identify and draw support and resistance (S&R) levels on your trading charts. This tool is called the “Support and Resistance Levels Guru” . Support Resistance Levels Guru The Support & Resistance Indicator automatically displays essential S&R levels on your chart. These levels are crucial for technical analysis and are used by many traders. Resistance levels (zones) are shown in R ed , while suppo
FREE

The indicator illustrates the divergence between the price movements of two financial instruments, such as EURUSD and GBPUSD or US500 and US30 or Gold and Silver. These divergences are plotted in the form of segments on the price chart of the dominant instrument. The dominant instrument refers to the one that exhibits a stronger bullish trend in the case of a bullish divergence, or a stronger bearish trend in the case of a bearish divergence. Investors are encouraged to independently seek correl

Liquidity Pro The Liquidity Pro pin points liquidity zones in any financial instrument, including currency pairs, cryptocurrencies, commodities, equities and indices. The Liquidity Pro shows previous and current liquidity zones, down to the present minute, providing essential information about your chosen trading pair, when conducting chart analysis or initiating trades. The Liquidity Pro allows you to observe where price consolidates, retraces, resists, or settles within support areas. It pinp

Do you want to know how an economic event will impact price? What will happen to price after the news? How has an economic news affected price in the past? This indicator can help you with that.
Do you like technical analysis? Do you enjoy studying the tick history to predict the future? But what do you think could be more important than technical analysis, what could improve technical analysis? Of course, it's fundamental analysis! After all, economic events directly impact the market, and t

We proudly introduce the Forex Ballin Remastered trading system, your key to financial freedom. Developed by a team of experienced traders with trading experience of over 13 years . IMPORTANT! After the purchase please send me a private message to receive the installation manual and the setup instructions. Buy Forex Ballin Remastered and you could get Market Breaker, Tinga Tinga EA for free !*** Ask in private for more details.
*Promotional Price: $ 1199 . The price will increase by $ 5

The Ultimate Trend and Reversals Detector The Ultimate Trend and Reversals Detector is a powerful tool designed to identify potential trend reversal zones in the financial markets. Here are the key features: Objective : Detect trend directions and reversals. Signal Colors : Green : Indicates a potential bullish trend reversal. Red : Signals a potential bearish trend reversal. Non-Repainting : The indicator’s signals are not redrawn, providing reliable information. Suitable for All Styles : Scal

Using the Future Trend indicator, you can predict the future price movement a certain number of bars ahead. This indicator creates a line depicting simulated future price values, providing you with valuable information for making decisions about entering or exiting the market, and for setting or adjusting stop losses accompanying your position.
In addition, the Future Trend indicator has several parameters: HistoricBars - determines the number of historical bars that are used for analysis. Fu

The indicator show Higher timeframe candles for ICT technical analisys Higher time frames reduce the 'noise' inherent in lower time frames, providing a clearer, more accurate picture of the market's movements.
By examining higher time frames, you can better identify trends, reversals, and key areas of support and resistance.
The Higher Time Frame Candles indicator overlays higher time frame data directly onto your current chart.
You can easily specify the higher time frame candles yo

FOTSI (Forex Overview True Strength Index) for MT5! FOTSI is an indicator that analyzes the relative strength of currencies in major Forex pairs. It aims to anticipate corrections in currency pairs following strong trends by identifying potential entry signals through overbought and oversold target areas. Theoretical Logic of Construction: Calculation of Individual Currency Momentum: FOTSI starts by calculating the momentum for each currency pair that includes a specific currency, then aggregat
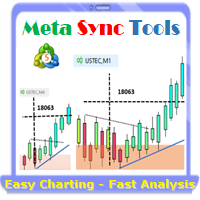
Supercharge Your MetaTrader Analysis and Trading with Meta Sync Tools! Struggling to analyze price action across different timeframes? Meta Sync Tools eliminates the frustration of unsynced crosshairs and charts, allowing seamless multi-timeframe analysis. Missing key correlations between assets and constantly switching between charts? Meta Sync Tools empowers you to visualize relationships between instruments effortlessly. Tired of wasting time on repetitive tasks? With 30+ Customizable Short
Crash500 Spike Detector v1.0 Crash500 spike detector prints Down non repaint Arrow for catching crash spikes. It is suitable for 1M time frame for majorly crash500 When the Red arrow prints, it indicates high probability of crash spikes downwards. Its pretty straight forward since I designed it to follow strong trends. Use default settings, however, you can change the color of your chart background as may be appropriate. The system uses mathematical approach in to display statistical data inf

The product gives optimized entries for 3min ,1 hr and day timeframes
Does well with indices ASIAN- HK50 AND CHINA A50 USA-US30,US100,US500 GER40 ,UK100 For stocks trade with the day timeframes Happy Entry employs advanced algorithms and real-time data analysis to identify optimal entry points with unprecedented accuracy. Its adaptive nature allows it to seamlessly adjust to changing market conditions, ensuring you never miss out on profitable opportunities. Whether you're a beginner or sea

THis indicator is a typical trend following indicator. ION BOT is based on the price position and its trail stop. When the price is above its trail stop the indicator is in an uptrend, and therefore the candles are coloured green, signalling the beginning of a trend with a green arrow.
Here are some of its key functionalities: Trend Analysis: The UT Bot Alert Indicator uses advanced algorithms to analyze market trends and identify key support and resistance levels. This information can help t
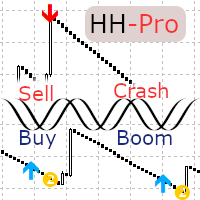
Finally, Harmonic Hybrid Pro is now available with numerous new features. It is highly recommended for utilization with Boom and Crash Synthetics. This tool generates a maximum of two orders per session and is designed to provide buy and sell signals in line with the current trend, effectively filtering out any superfluous signals. Users can optimize settings in the input section of the indicator properties. While the default configuration is suitable for Boon 500, adjustments may be necessary f
您想在外汇市场取得成功吗? 我们创新的 AI Swing Trading 指标是您交易成功并盈利的秘密钥匙。 我们向您展示这个独特的工具:
我们的指标配备了内置神经网络,可让您分析大量数据、识别变化并预测价格走势。 该技术使您能够根据深入的市场分析做出明智的交易决策。 该指标算法基于:斐波那契水平、价格行为和交易量。 这使您可以根据数学模式确定潜在的进入点和市场进入点。 应在 M30 时间范围内对 EURUSD 货币对使用 AI 波段交易! AI Swing Trading 指标不会停滞不前。 在工作过程中,不断优化自身,适应不断变化的市场情况。 这意味着即使市场发生变化,您也将始终领先一步。
AI Swing Trading 不仅分析当前走势,还分析外汇市场的全球趋势。 这使您可以了解发生了什么并做出明智的决定。
该指标是从2009年开始的多年交易经验的成果。它是由交易者为交易者开发的,考虑到了外汇交易的各个方面。
不用担心错误信号。 AI Swing Trading 不会重绘,这意味着您看到的信号保持不变,您可以依靠它们做出已知的交易决策。
我们的
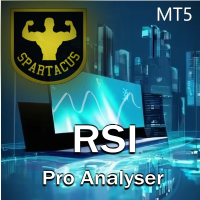
RSI Pro 分析器指标是一款功能强大的工具,专为希望在多个时间范围内同时做出明智决策的交易者而设计。 该指标利用 RSI 提供超买、超卖和趋势信号,更容易识别入市机会。 它的主要优点是易于阅读, 因为它具有清晰而独特的颜色代码来指示不同的市场状况。
该指标显示五个不同时间范围(D、H4、H1、M30、M15) 的 RSI 值和相关信号,使交易者能够获得全面的市场视角并在多个时间范围内做出明智的决策。
使用颜色变化来识别不同时间范围内的趋势和潜在逆转。 寻找超买和超卖区域,以发现反趋势或趋势逆转的交易机会。
红色: RSI 指示下降趋势。
绿色 :RSI 指示上升趋势。
深红色 :RSI 表示超卖区域。
深绿色 :RSI 发出超买区域信号。
您还可以通过弹出、电子邮件和推送通知发送的精确警报来通知购买和销售条目。
RSI Pro 分析器指标是交易者决策过程中的补充工具。 建议将其与其他指标和分析结合使用,以了解市场概况。
MT4版本。
输入参数:
RSI period: 14(默认),可根据您的喜好调整。
Enab

帶輸入訊號平均濾波器的趨勢追蹤指示器
此指標充當趨勢追蹤器和過濾器,使用移動平均線作為入場訊號。 移動平均線是確定不同趨勢範圍的關鍵:
- 標準 200 週期主要平均值顯示長期趨勢。 - 50 週期二級平均線指示中期趨勢。 - 20 週期第三平均值表示最短趨勢。 - 九個週期的平均值可作為立即採取行動的入場觸發因素。
此指標對於交易者來說是一個有價值的工具,它可以提供準確、全面的市場趨勢分析,並根據精心選擇的移動平均線來確定及時的入場點。
使用帶有入場訊號平均過濾器的趨勢追蹤指標增強您的交易策略並做出更明智的決策。 立即下載並提高您的交易結果 _____________________________________________________________________________________________________________________
FREE
MetaTrader市场提供了一个方便,安全的购买MetaTrader平台应用程序的场所。直接从您的程序端免费下载EA交易和指标的试用版在测试策略中进行测试。
在不同模式下测试应用程序来监视性能和为您想要使用MQL5.community支付系统的产品进行付款。
您错过了交易机会:
- 免费交易应用程序
- 8,000+信号可供复制
- 探索金融市场的经济新闻
注册
登录