适用于MetaTrader 5的新技术指标 - 12
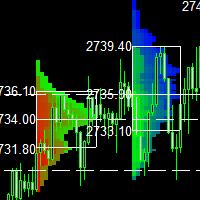
This indicator is a classic implementation of the Market Profile (Volume Profile Visible Range), allowing for the display of price density over time while highlighting the most significant price levels, the value area, and the control price within a specific trading session. MT4-version: https://www.mql5.com/en/market/product/125261
The indicator can be applied across timeframes from M1 to D1, enabling the analysis of market profiles for daily, weekly, monthly, or intraday trading. Utilizing

The Zero-Lag MA Trend Levels indicator combines a Zero-Lag Moving Average (ZLMA) with a standard Exponential Moving Average (EMA) to provide a dynamic view of the market trend. This indicator automatically plots the EMA and ZLMA lines on the chart. The colors of the lines represent the market trend.
With EMA: ++ green (uptrend) when EMA > zlma ++ red (downtrend) when EMA < zlma With ZLMA: ++ green (uptrend) when the line is trending up ++ red (downtrend) when the line is trending down
When th

Range Bar Pro Indicator for MetaTrader 5
Visualize market trends, levels and other features with Range Bar Pro, an innovative indicator that draws a unique, standalone candle on the right side of any MT5 chart. This single candle is generated from an analysis of price over a specified range, providing you with a powerful snapshot of the market. Key Features: Single-Candle Visualization: Gain quick insights with a single, specially derived candle that reflects comprehensive price movement over a
FREE

Introducing Your Ultimate Trading Edge: Dynamic Support & Resistance, Advance Entry Levels Indicator for MT5 platform Unlock the power of precision trading with our cutting-edge Dynamic Support & Resistance Indicator. Designed to give traders unparalleled clarity, this indicator is your roadmap to identifying exactly where to buy and sell, maximizing your potential for consistent, sustainable profits. Why Choose Our Indicator? Crystal Clear Entry and Exit Points : No more guesswork. Our indicat

The ATR (Average True Range) Indicator is a powerful tool designed to measure market volatility. This indicator provides accurate data on price movement ranges, helping traders manage risk more effectively and make well-informed trading decisions. Based on the widely-used ATR indicator, it’s suitable for both professional and beginner traders to analyze market volatility. The ATR Indicator allows you to track the current price movement range and use this information to set stop-losses, select en
FREE
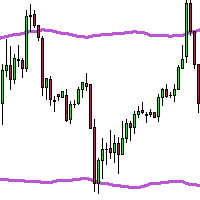
TMA & ATR Adjusted Indicator The TMA & ATR Adjusted indicator for MetaTrader 5 is a powerful tool that combines the Triangular Moving Average (TMA) with the Average True Range (ATR) to provide dynamic market insights. This advanced indicator adapts to market volatility and offers a clear visualization of trends with customizable upper and lower bands. Key Features: Triangular Moving Average (TMA): A smooth moving average that gives more weight to central data points, providing a refined trend an

This indicator is the mql version of the Smoothed Heiken Ashi Candles. Heikin-Ashi charts resemble candlestick charts , but have a smoother appearance as they track a range of price movements, rather than tracking every price movement as with candlesticks.
Because the Heikin Ashi candlesticks are calculated based on averages, the candlesticks will have smaller shadows than a regular Japanese candlestick. Just like with regular Japanese candlesticks, with a Heikin Ashi candlestick, the sm
FREE

Introducing Your Ultimate Trading Edge: Dynamic Support & Resistance, Advance Entry Levels Light Indicator for MT5 platform Unlock the power of precision trading with our cutting-edge Dynamic Support & Resistance Indicator. Designed to give traders unparalleled clarity, this indicator is your roadmap to identifying exactly where to buy and sell, maximizing your potential for consistent, sustainable profits. Why Choose Our Indicator? Crystal Clear Entry and Exit Points : No more guesswork. Our
MrGoldTrend is a sophisticated trend-following indicator designed exclusively for XAUUSD (Gold) traders on the MQL5 platform. With clear, easy-to-interpret visual signals, this indicator helps you quickly identify the prevailing trend and make informed trading decisions on the H1 timeframe. MrGoldTrend’s gold lines indicate an uptrend, while blue lines signify a downtrend, providing immediate visual clarity for trend direction. Key Features: Clear Trend Visualization : Gold lines for uptrends, b
FREE

This SMT (Smart Money Technique) divergence indicator identifies discrepancies in price movement between two different trading symbols, helping traders detect potential market reversals. This tool compares the price action of two correlated assets, such as two currency pairs or indices, to spot divergences where one asset's price moves in the opposite direction of the other. For example, while one symbol may be making higher highs, the other might be making lower highs, signaling a divergence. T
FREE

Superior Boom and Crash Spike Alert: Real-Time Market Intelligence at Your Fingertips
Unlock the power of timely trading decisions with our Superior Spike Alert, a cutting-edge trading tool designed to notify you of potential market spikes. This innovative system sends instant alerts to your phone, audible notifications on your laptop, and displays clear arrows on charts for each currency pair, ensuring you stay ahead of the market.
Key Features:
1. Mobile Notifications: Receive instant ale
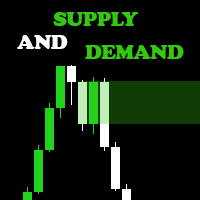
Are you ready to elevate your Forex trading game? Introducing the Supply and Demand Indicator , a powerful tool designed to help traders identify key market zones and make informed decisions with confidence! Key Features: Accurate Zone Identification : Our indicator pinpoints critical supply and demand zones, allowing you to spot potential reversal points and areas of price consolidation. User-Friendly Interface : With an intuitive design, you'll easily navigate through the settings and customiz

This indicator combines session visualization with Volume Weighted Moving Average (VWMA) analysis . It draws vertical lines at session start and horizontal lines spanning each session , providing clear visual c ues for trading sessions. The V WMA is calculated an d displayed as a color -changing line, offering insights into price trends weighte d by volume. Users can customize session times , line colors , VWMA perio d, price type , and volume
FREE

During volatile market conditions brokers tend to increase spread. int OnCalculate ( const int rates_total, const int prev_calculated, const datetime &time[], const double &open[], const double &high[], const double &low[], const double &close[], const long &tick_volume[], const long &volume[], const int &spread[]) { int spread_array[];
FREE

Multi-Timeframe Fractal Indicator Description for MQL5 Introducing the Multi-Timeframe Fractal Indicator! Key Features: Multi-Timeframe Analysis: Analyze Fractals on a timeframe independent of your chart's current timeframe. Gain insights from higher timeframes for informed trading decisions. Customizable Parameters: Timeframe: Choose the timeframe on which Fractals will be calculated (e.g., Daily, H4, etc.). Number of Bars: Specify the number of bars considered around a potential Fractal for c

# Indicador MultiZigZag Pro para MetaTrader 5
O MultiZigZag Pro é um poderoso indicador técnico para a plataforma MetaTrader 5 que identifica, de forma inteligente e flexível, os principais pontos de inflexão e tendências nos gráficos de preços.
## Características principais: - Algoritmo avançado que filtra ruídos e movimentos irrelevantes do mercado - Múltiplos timeframes para análise de tendências de curto a longo prazo - Parâmetros de profundidade e desvio personalizáveis para adaptação a
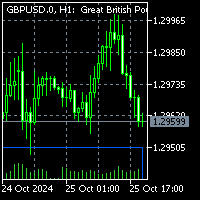
Note 1:To get access to MT4 version please contact via private message. Note 2: Multi time frame option is not available with this indicator. To order multi time frame please contact via private message. This is the exact conversion from TradingView: "Supply and Demand Visible Range by LuxAlgo". The screenshot shows similar results from tradingview and Metatrader when tested on ICMarkets on both platforms. This is a light-load processing. Updates are made based on new candle open and chart updat

# Indicador MultiZigZag Pro para MetaTrader 5
O MultiZigZag Pro é um poderoso indicador técnico para a plataforma MetaTrader 5 que identifica, de forma inteligente e flexível, os principais pontos de inflexão e tendências nos gráficos de preços.
## Características principais: - Algoritmo avançado que filtra ruídos e movimentos irrelevantes do mercado - Múltiplos timeframes para análise de tendências de curto a longo prazo - Parâmetros de profundidade e desvio personalizáveis para adaptação a
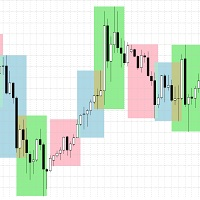
Session Boxes - Advanced Market Sessions Visualization Indicator
Overview The Session Boxes indicator is a powerful and highly customizable tool designed to help traders visualize major trading sessions directly on their charts. By clearly displaying the Asian, London, New York, Sydney, and Frankfurt sessions, traders can easily identify optimal trading times and potential market volatility periods.
Key Features
Multiple Session Support - Asian Session (Default: 00:00-09:00) - London Session

Supply & Demand Visible Range Indicator with Smart Alerts
Master the art of supply and demand trading with this powerful indicator that brings institutional-grade volume analysis to your charts! This sophisticated tool helps you identify key market levels where big players are active.
Key Features: - Dynamic supply and demand zone identification based on volume analysis - Smart alerts at crucial price levels (supply, demand, and mid-point zones) - Volume-weighted average calculations for pr
A buy signal can be seen on the dashboard when the previous signal is red and the next signal is green, then the SAR is green and the RSI is green.
A Sell Signal can be seen on the dashboard when the previous Signal is green and the Signal after it is red, then the SAR is red and the RSI is red.
Line function - shows on the chart the lines of Opening, Stop Loss, Take Profit. With this function, it is easy to create a new order and see its additional characteristics before opening. TP and SL
FREE

介绍 Quantum TrendPulse ,这是一款终极交易工具,它将 SuperTrend 、 RSI 和 Stochastic 的强大功能整合到一个综合指标中,以最大限度地发挥您的交易潜力。该指标专为追求精准和效率的交易者而设计,可帮助您自信地识别市场趋势、动量变化以及最佳进入和退出点。 主要特点: 超级趋势整合: 轻松跟随当前的市场趋势并乘上盈利浪潮。 RSI 精度: 检测超买和超卖水平,非常适合把握市场逆转时机,可用作 SuperTrend 的过滤器 随机精度: 利用随机振荡在波动的市场中寻找隐藏的机会, 用作超级趋势的过滤器 多时间范围分析: 从 M5 到 H1 或 H4,在不同时间范围内关注市场动态。 可定制的警报: 当您的自定义交易条件得到满足时收到通知,这样您就不会错过任何交易。 无论您是新手还是经验丰富的交易员, Quantum TrendPulse 都能为您提供所需的优势,帮助您增强策略并自信地进行交易。借助这一强大的指标,将洞察力转化为利润 — 掌控您的交易!
***购买 Quantum TrendPulse,即可免费获得 Quantum Tr
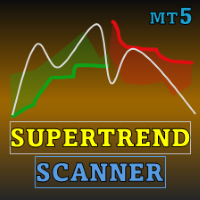
Special offer : ALL TOOLS , just $35 each! New tools will be $30 for the first week or the first 3 purchases ! Trading Tools Channel on MQL5 : Join my MQL5 channel to update the latest news from me 介绍 SuperTrend ATR Multiplier with Scanner for MT5 – 一款多功能且强大的工具,旨在帮助您领先于市场趋势,具备可定制的功能和实时警报。该指标遵循 Kivanc Ozbilgic 的经典 SuperTrend 逻辑,提供精确的趋势信号。 您可以在 ATR 计算方法中选择 RMA (相对移动平均线)或 SMA (简单移动平均线),以实现最大的灵活性。默认设置为 ATR 周期 10 和倍数 3, SuperTrend 有效地识别买卖信号。 内置的扫描器和警报系统监控多个货币对和时间框架,确保您能收到实时通知并立即采取行动。 Se
FREE

这个指标允许您通过在背景中应用两种可自定义颜色之间的平滑过渡来彻底改变图表的外观。通过这种方式,您可以创建出一个引人注目的渐变效果,为您的图表带来一种新鲜、现代的外观,使其在视觉上更加吸引人,增加了交易的乐趣与体验。 当您将该指标附加到图表上时,渐变效果将自动应用于当前图表上所有的指标窗口。这不仅提升了现有窗口的视觉效果,还会影响任何后续添加的新指标窗口,确保每一个窗口都能展现出一致且优雅的外观。 您可以根据自己的喜好选择渐变的颜色,使您的图表独一无二。这个简单而有效的工具使得交易者在进行市场分析时,可以更专注于图表的内容,而不会因为视觉上的繁杂而分散注意力。 快来尝试一下这个指标,给您的图表焕然一新吧!通过改变图表的外观,您将能够提升您的交易体验,让每一次交易都充满活力与灵感。
FREE
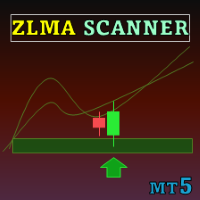
Special offer : ALL TOOLS , just $35 each! New tools will be $30 for the first week or the first 3 purchases ! Trading Tools Channel on MQL5 : Join my MQL5 channel to update the latest news from me Zero Lag MA Trend Levels MT5与扫描仪指标结合了零滞后移动平均线 (ZLMA) 和标准指数移动平均线 (EMA),为交易者提供了市场动量和关键价格水平的全面视图。此外,扫描仪和警报功能使交易者能够轻松跟踪多个货币对和时间框架的信号,从而增强发现交易机会的能力。 See more MT4 version at: Zero Lag MA Trend Levels MT4 with Scanner See more products at: https://www.mql5.com/en/users/ndhsfy/seller
主要特点
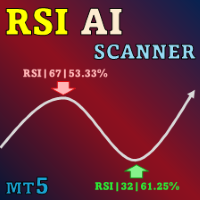
Special offer : ALL TOOLS , just $35 each! New tools will be $30 for the first week or the first 3 purchases ! Trading Tools Channel on MQL5 : Join my MQL5 channel to update the latest news from me 推出革命性的 RSI Kernel Optimized with Scanner for MT5,一款重新定义传统 RSI 分析的尖端工具,集成了强大的核密度估计(KDE)算法。这款先进的指标不仅提供实时市场趋势的见解,还包括一个仪表板,可同时扫描多个货币对和时间框架。让我们深入了解为什么这款工具是您交易工具箱中的重要补充。 See more MT4 version at: RSI Kernel Optimized MT4 with Scanner See more products at: https://www.mql5.com/en/users/ndhsfy

Golden Spikes Detector Acknowledgement and Dedications: The name of this indicator was Inspired by an Original; Mr Grant Koopman; a Knowledgeable and experienced Synthetics trader. I dedicate this indicator to Mr Grant. Overview: The Golden Spikes Premium is a groundbreaking trading indicator meticulously crafted for the Boom and Crash indices on the Deriv market. Tailored to meet the needs of discerning traders, this powerful tool operates exclusively on the one-minute timeframe, providing
This indicator helps you monitor multiple currency pairs and timeframes all at once. It displays the occurrence of divergences between price and the MACD indicator in a clear and easy-to-read table. Monitoring multiple timeframes and currency pairs in one place helps traders identify a divergence without needing to switch between charts. Divergences can be bullish or bearish. For example, if the price forms a higher high while the MACD forms a lower high, this indicates bearish divergence. On th
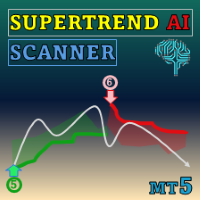
Special offer : ALL TOOLS , just $35 each! New tools will be $30 for the first week or the first 3 purchases ! Trading Tools Channel on MQL5 : Join my MQL5 channel to update the latest news from me 通过 SuperTrend AI Clustering MT5 with Scanner ,体验人工智能的强大力量。这款革命性的交易工具适用于 MetaTrader 5 (MT5),结合了 K-means 聚类和广受欢迎的 SuperTrend 指标,帮助交易者在趋势和信号中掌握主动。 See more MT4 version at: SuperTrend AI Clustering MT4 with Scanner See more products at: https://www.mql5.com/en/users/ndhsfy/seller
为何此工具独

MT5 CCI仪表板扫描器 MT5 CCI仪表板扫描器是一种工具,帮助跟踪不同时间框架和工具的商品渠道指数(CCI)水平,并在检测到新信号时提供实时警报。它用户友好,计算能力要求低,确保在任何计算机上都能平稳运行。 主要特点 自动仪器分组 :扫描器从您的市场观察列表中收集所有仪器,并将其分类(主要、次要、外来、其他)。使用设置中的简单复选框界面,轻松选择要扫描的仪器。 可自定义时间框架选择 :选择21种不同的时间框架进行扫描。所有选定的时间框架在仪表板上显示,并为每个时间框架发送新的信号通知。 简单的CCI设置 :调整CCI设置,包括周期和应用价格,并设置买入/卖出水平。您还可以决定是根据当前蜡烛还是最近关闭的蜡烛进行扫描。 颜色自定义 :个性化仪表板的主要背景、前景和信号箭头的颜色。扫描器将确保一切看起来整洁,并且容易辨认。 灵活的信号显示 :选择仪表板显示CCI值、信号年龄或不同设计的方向箭头。
如果您觉得这个扫描器有帮助,快速的评分或评论将不胜感激!如果您希望为其他指标创建类似的扫描器,随时联系我们——我很乐意提供帮助 ️
FREE

MetaTrader 5 (MT5) 终极趋势狙击手指标 通过我们最先进的指标实现精准入场并最大化您的收益 使用 趋势狙击手指标 将您的交易提升到新水平。这是一款为追求精确和深度分析的交易者设计的先进工具。该强大的指标利用 独特的数学算法 识别市场中的强劲趋势,为您提供狙击手般精准的入场点,让您以最小的风险把握市场关键走势。 主要特点 : 狙击手精准入场 告别猜测 : 趋势狙击手指标以无与伦比的精确度检测并确认趋势方向,让您在最佳时刻进入市场。 数学优势 : 通过专有数学计算,指标过滤市场噪音,提供明确的买卖信号,确保您进入高概率的交易设置。 集成的回测功能和详细结果 做出明智的决策 : 我们的指标不仅帮助您交易,还提供了 深入的回测能力 。您可以立即查看该指标在历史上的表现,从而优化您的策略并在实际交易前做好准备。 可调参数 : 输入您想要的 手数 、回测的 蜡烛数 以及 趋势时间框架 ,实现灵活和个性化的回测体验。 动态盈利区和止损区 视觉清晰 : 指标会在您的图表上自动绘制盈利区和止损区,帮助您实时可视化风险和收益潜力。 区域详细信息 : 对于每笔交易,您可以看
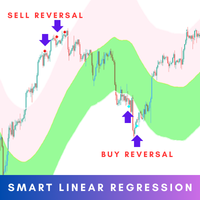
The Smart Linear Regression indicator is a powerful, non-repainting tool designed for traders looking for enhanced accuracy in market analysis. Unlike the typical linear regression channels that often repaint, this indicator provides reliable insights without changing past values, making it more trustworthy for forecasting future price movements. MT4 Version - https://www.mql5.com/en/market/product/124893/ Overview: The Smart Linear Regression Indicator goes beyond the basic linear regr

Automatic Trendline Indicator The Automatic Trendline Indicator is a powerful tool designed to simplify technical analysis by automatically identifying and drawing trendlines on a price chart. It analyzes price movements to detect key support and resistance levels, plotting ascending and descending trendlines based on historical price action. This indicator helps traders identify market trends, potential breakout points, and reversal areas with minimal effort. Key features: Automatic Detection
FREE

Antabod Genius Indicator—an advanced trading tool designed to give you accurate buy and sell signals directly on your MetaTrader 5 platform. Harnessing the combined power of Moving Averages (MA) and the Stochastic Oscillator, this indicator helps you identify optimal entry and exit points with ease. Key Features: • Precision with Dual Moving Averages: The Genius Indicator uses a fast and slow MA to detect key market momentum shifts. Crossovers between the MAs serve as reliable indicators for pot

Antabod Multiplier , the ultimate trading indicator designed to simplify your decision-making process and maximize your trading potential. Built with a robust combination of moving averages and stochastic oscillators, this tool provides clear, actionable signals for both buy and sell opportunities. The Antabod Multiplier stands out with its dynamic trend detection and precision filtering, giving you real-time visual signals to catch trend reversals and optimal entry/exit points with ease. Whethe

Description : In the world of trading, candlestick patterns are a popular technical analysis tool used by many traders. There are numerous candlestick patterns, ranging from reversal patterns to continuation patterns. However, remembering all these patterns can be challenging, especially for novice traders. This often leads to traders having to manually memorize and identify candlestick patterns, which can be time-consuming and prone to errors. Candle Pattern Pro is a powerful indicator desig

Automatic Fibonacci Levels Indicator The Automatic Fibonacci Levels Indicator is an essential tool for traders seeking to incorporate Fibonacci retracement and extension levels into their technical analysis seamlessly. This innovative indicator automatically identifies significant price movements and calculates key Fibonacci levels, providing traders with valuable insights into potential support and resistance areas. Key features: Automatic Calculation : Effortlessly plots Fibonacci levels base
FREE

Tyr Bands Indicator (IC MARKETS GOLD). Just drag and drop. This indicators gets you entry points for the market. it is for gold, but you can configure for any other currency. Tyr Band works with BB and 3 different deviations, plus the Stochastic confirmation. So when the price closes below/above the BB Reversal Band (Red) and the Stochcastic is in the confirmation zone, then the arrow (buy/sell) appears. This arrow indicates that we can entry to the market up/down on the next opening. Since it i
FREE
A Renko Tick chart based on continuously adjusting percentage.
Live Renko bricks formed by tick data
Adjustable brick width expert for indicator attached Scalp with a Renko, get weird.
The settings can and will break the script if you turn them up too high. Turning off outline mode will not look as nice, but can potentially allow for a larger number of bricks.
FREE
This indicator is the mql version of the SSLHybrid indicator. Description of TradingView version: This script is designed for the NNFX Method, so it is recommended for Daily charts only.
Tried to implement a few VP NNFX Rules
This script has a SSL / Baseline (you can choose between the SSL or MA), a secondary SSL for continiuation trades and a third SSL for exit trades.
Alerts added for Baseline entries, SSL2 continuations, Exits.
Baseline has a Keltner Channel setting for "in zone" Gra

This is a very simple multiple moving average indicator.
It can display 12 moving averages. The time axis of the moving averages can be changed in the input field of the indicator. The process is faster than the 12 moving averages included with MT5.
We also have a buffer set up so you can access it from an Expert Advisor. *For advanced users.
If you have any questions or requests, please message me.
Thank you.
MT4 Version: https://www.mql5.com/en/market/product/122857
FREE
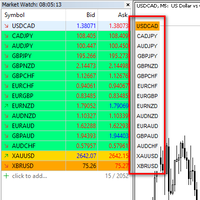
I want to quickly view the chart, so I created a small tool. I hope it can help you. Functions:
Use up/down arrow keys or mouse clicks to quickly open charts for currency pairs. Use left/right arrow keys to change the timeframe of the current chart. Automatically update the order based on the Market Watch
If you have any request or errors please tell me to help it better.
Donate us , Thank u!
Telegram: 0388894014
FREE
MT5 Drawdown Tracker – Track Your EA’s Performance with Precision! Take your trading analysis to the next level with our MT5 indicator designed to monitor, record, and report the drawdown of any Expert Advisor. Whether you’re fine-tuning your strategies or optimizing risk management, this tool gives you the insights you need. Key Features: Effortless Tracking: Automatically monitors the drawdown levels of your EAs with precision. Comprehensive Data Storage: Accurately logs each drawdown event,
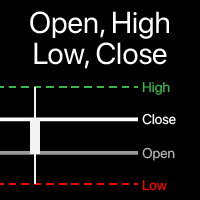
Visualization of Open, High, Low, Close levels on the chart You can choose any timeframe , not just the current one. The offset of the calculated bar can be adjusted : the current (floating) bar , or a set number of bars back . My #1 Utility : includes 65+ functions | Contact me if you have any questions | MT4 version In the settings of the indicator, you can configure: Offset of the calculated bar: 0 = current bar, 1 = previous bar, 2 = 2 bars back... "Include multiple bars " opti

The indicator is a very simple oscillator based on T3
Green and red bars shows bullish or bearish direction
Also above and below the zero line can show sentiment
The T3 value and price can be adjusted according to your trading style
The colors can also be changed as preferred
Please test in tester before purchase
Enjoy!!! ---------------------------------
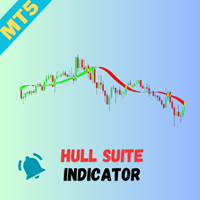
Overview
The Hull Suite is a highly responsive and smooth moving average indicator based on the Hull Moving Average (HMA), developed by Alan Hull in 2005. Known for its minimal lag and clear curves, the HMA has become a widely used technical analysis tool. This script brings together multiple Hull variations into one flexible and customizable indicator, ideal for traders looking for enhanced visual representation and trend analysis. Key Features
The Hull Suite offers three variations of the Hu

The first 100 units are gone for FREE! Now, grab the next 50 units at just $30 each. Act fast, because once they're gone, the price will jump to $99. Don’t wait
The *Rich Scalping* indicator is a powerful tool designed for traders who seek to maximize profits through fast-paced, short-term trading. Specifically tailored for scalping, it accurately identifies entry and exit points by detecting quick price movements and market trends.
With user-friendly signals and real-time alerts, Rich

Special Fair Value Gap (SFVG) Indicator
Unlock your trading potential with the Special Fair Value Gap (SFVG) Indicator! This innovative tool identifies critical price imbalances in the market, helping you pinpoint potential buying and selling opportunities with precision.
Key Features: - Multi Timeframe - Smart Money Tool - Identifies Key Price Levels: Automatically detects STRONG HIGH PROBABILITY gaps in price action where retracements are likely to occur, allowing you to make informed tra

The "Profit and Fee" indicator was developed in MQL5 to help traders clearly visualize the fees involved in operations on the stock exchange (B3). It calculates and displays, in real time, the fees for emoluments and registration, allowing traders to understand the impact of these fees on their profit or loss.
Advantages and Features:
1. Financial Transparency: The indicator shows exactly how much you are paying in fees, providing a clear view of the real value of your operations. This helps

The Simple Market Sessions Indicator helps traders visualize the current status of major forex market sessions: Asian , London , New York , and Sydney . It shows whether each market is Open , Active (based on volume) , or Closed directly on the chart. With customizable session times and a volume threshold, this tool helps traders monitor session activity and volume strength, making it easier to decide the best times to trade.
Key features: Displays status: Open, Active (High Volume), or Closed

你有一个交易的想法或内部人士,但不断错过切入点? EasyEntry,最佳入口点的信号指示器,将帮助您正确打开。 运动开始时的高精度信号。 该指标是由独特的人工智能ForexAI创建的。 打开位置的原理是基于一个独特的自适应算法来识别蜡烛模式. 同时分析来自7个主要货币对的数据。 使用全球市场模式。 灵活的设置智能过滤调整-调整干扰,使您不会错过输入准确。 注意! 该指标在H1时间帧(1小时)上配置和测试货币对:欧元兑美元,英镑兑美元,澳元兑美元,纽元兑美元,美元兑瑞郎,美元兑日元,美元兑加元。 该指标将适用于任何工具,但统计优势已经在这些货币对上进行了测试。 该指标不会重写或重画其信号在形成的酒吧. 当已经有一个信号出现的机会,但酒吧还没有关闭,箭头是灰色的。 在H4(4小时)以上的时间范围内,ForexAI干预被禁用。 专家参数: PeriodEE - 查找枢轴点的锯齿形周期。 值越高,信号越全局。 ForexAI - 算法的效果百分比。 更少的价值意味着更多的信号。 BarsCalculate - 指标将根据历史的多少条柱。 PushMessage - 启用警报。
FREE
这 FVG 区域指标 MT5 是一款功能强大的工具,旨在识别市场中的公允价值差距 (FVG),突出公允价值与市场价格之间的价格不平衡。这种对差距的精确识别使交易者能够发现潜在的市场进入和退出点,从而大大提高他们做出明智交易决策的能力。 FVG 区域指标具有直观且用户友好的界面,可自动扫描图表以查找公允价值缺口,并在价格图表上实时标记这些区域。这使交易者能够快速轻松地识别可能预示即将出现价格调整或趋势延续的潜在价格不平衡。 主要特点包括: 实时间隙检测: 自动识别并标记出现的 FVG。 显示间隙大小(点数): 该指标以点数显示每个已识别差距的大小,帮助交易者了解差距的重要性。 与当前价格的点差: 立即计算并显示当前价格与已确定的公平价值差距有多少点。 清晰的可视化: 视觉上不同的 FVG 区域采用颜色编码以便快速参考,帮助交易者专注于关键市场区域。 无论您是经验丰富的交易员还是技术分析新手, FVG 区域指标 提供有关市场价格不平衡的重要见解,帮助您准确、自信地完善交易策略。
参数 间隙参数 间隙填充检测百分比 -

这 支撑阻力耳语 MT5 是一款功能强大的工具,旨在帮助交易者识别市场中的关键支撑位和阻力位。该指标利用价格行为在图表上动态绘制红色阻力线和绿色支撑线,清晰直观地表示可能发生市场逆转或突破的关键价格区域。与依赖分形的传统方法不同,该指标通过根据可自定义的回溯期内的最高价和最低价计算支撑位和阻力位来避免滞后。 主要特点: 回顾期: 自定义指标,使用以下工具分析特定数量蜡烛的价格数据: 回顾期 参数。这允许交易者微调支撑位和阻力位的敏感度。 历史数据分析: 该指标最多可以扫描 500 个历史条形图(可通过 历史 我们使用一个实用工具(例如,Analytics(分析)工具箱来跟踪市场价格走势)来确保对市场价格走势进行全面的分析。 SR 连续滤波器: 启用或禁用 SRContinuationFilter 优化线条的绘制方式。此过滤器可确保仅当当前蜡烛的最高价格与前一个蜡烛的最高价格匹配时才绘制支撑线或阻力线,从而创建虚线效果,以便更好地显示关键区域。 警报系统: 使用多功能警报系统随时掌握市场动向。每当价格触及支撑

日内价格范围指标 日内价格范围指标 是一个强大的工具,旨在显示每个交易日的关键价格水平,帮助交易者根据市场动态做出明智的决策。该指标会自动在图表上绘制矩形,直观地突出三个关键价格点: 开盘价 :以独特的颜色标记,方便识别市场每天的开盘位置。 日内最高价(当日最高价格) :用另一种颜色的矩形显示当天的最高点。 日内最低价(当日最低价格) :用独特的颜色矩形标记当天的最低价格水平。 除了显示当前交易日的价格走势外,指标还会显示 过去30天的开盘、最高和最低价格 ,提供近期市场行为的全面视图。这个历史数据能够帮助交易者分析过去的价格范围,发现重复的模式,并更有效地预测未来走势。 关键功能: 自动绘制每个交易日的开盘价、最高价和最低价。 显示 过去30天 的价格水平,提供历史见解。 可自定义矩形颜色,方便视觉识别。 适用于所有时间框架和交易品种,适合各种交易策略(日内交易、波段交易等)。 帮助识别关键的支撑和阻力位价格水平。 用户友好的界面,图表简洁,减少混乱。 此指标非常适合希望增强技术分析、跟踪价格动态,并深入理解日内市场趋势的交易者。

MT5狙击入场指标 通过我们创新的MT5(MetaTrader 5)狙击入场指标,释放多时间框架分析的潜力。这个强大的工具旨在帮助交易者根据高时间框架的主要趋势识别最佳入场点,从而确保交易策略的合理性。 关键特性: 多时间框架分析:
无缝分析高时间框架的趋势,以确定整体市场方向。该指标利用这些信息在低时间框架上精确定位入场机会。 可视化趋势表示:
指标通过图表上的清晰矩形视觉突出当前趋势。该矩形表示高时间框架的趋势,让您能够快速评估市场状况。 入场点突出:
自信地寻找狙击入场!指标通过向上或向下的箭头标记入场点,指示基于既定高时间框架趋势的买入或卖出机会。 用户友好界面:
该指标考虑到易用性,平滑地集成到您的MT5平台,使其对所有经验水平的交易者都能轻松使用。 可定制设置:
根据您的交易风格定制指标,具有可调参数,允许您根据个人偏好优化其性能。 为什么选择这个指标? 无论您是希望提高技能的新手交易者,还是想要完善策略的经验丰富的专业人士,狙击入场指标都可以成为您交易工具箱中的宝贵补充。它不仅简化了决策过程,还帮助您保持与更广泛市场趋势的一致性。 有问题吗? 我在这里帮助您!如
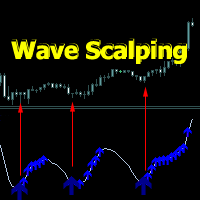
Wave Scalping indicator is a short-term trading strategy based on a wave system. It includes a wave line, entry points and position tracking.
Signal arrows appear when a candle closes.
It consists of a wave line along which signal arrows are built, and arrows - confirmation of directions after the signal arrows.
Signal arrows are built taking into account the direction of the trend direction. When confirming signal arrows, there are several types of alerts.
To configure the parameters, you can
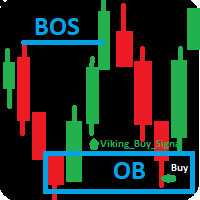
Product Name: Viking Strategy Signal indicator Overview:
The Viking Strategy Signal indicator is designed to give traders an edge in identifying market trends and entry signals with precision and efficiency. MY SCALPING ROBOT: https://www.mql5.com/fr/market/product/133191 Bonus:
One EA gift who can trade automatically this signals ,send the real-time Screenshot for you if Opportunity detected and many things...,additionnnal tools give for free to improve your profitability . what are you wa

YOU CAN NOW DOWNLOAD FREE VERSIONS OF OUR PAID INDICATORS . IT'S OUR WAY OF GIVING BACK TO THE COMMUNITY ! >>> GO HERE TO DOWNLOAD
This system is an Heiken Ashi system based on RSI calculations . The system is a free open source script originally published on TradingView by JayRogers . We have taken the liberty of converting the pine script to Mq4 indicator . We have also added a new feature which enables to filter signals and reduces noise on the arrow signals.
Background
HEIKEN ASHI
Th
FREE

----------------------------------------------------------------------------------------------------------- 適用於EurTrendSniper的趨勢指標,請下載並放置於MT5的Indicators資料夾內。
交易中的一個關鍵要素是做出買賣交易工具決定的區域或水平。儘管主要參與者試圖隱藏他們在市場中的存在,但他們不可避免地會留下痕跡。我們的任務是學習如何識別這些痕跡並正確解釋它們。 指標說明:
看漲訊號: 價格 (K線) 處於帶狀色塊上方 、 帶狀色塊 為紅色(或從綠變紅) 、 延展線處於看漲狀態 、 快慢線黃金交叉。 看跌訊號: 價格 (K線) 處於 帶狀色塊 下方 帶狀色塊 為綠色 (或從紅變綠) 、 延展線處於看跌狀態、快慢線死亡交叉。
FREE

The Accumulation/Distribution (AD) Technical Indicator is a tool used in technical analysis to determine whether an asset is being accumulated (bought) or distributed (sold) in the market. Key Characteristics of the AD Indicator: Purpose: The AD indicator is used to assess the balance between buying (accumulation) and selling (distribution) of an asset. This helps traders and investors evaluate the strength of the current trend and potential reversals. Interpretation: Rising Indicator: Whe

The Accelerator Oscillator (AC) technical indicator measures the acceleration or deceleration of the current market strength. It is designed to identify potential trend reversal points and is used to determine the moment of buying or selling assets. The indicator helps traders make decisions based on changes in market dynamics. This implementation of the indicator is its creative version. Since the standard version is very limited by its built-in settings, this implementation has significantly

The AO (Accumulation/Distribution) technical indicator is a successful indicator for measuring market dynamics, which reflects specific changes in the market's driving force, which helps determine the strength of a trend, including its formation and reversal points. The AO indicator is a technical analysis tool that will help you trade more effectively. Main characteristics of the AO indicator: Purpose: The AO indicator is used to assess the balance between purchases (accumulation) and sales (di

Advanced Dynamic RSI – The Evolution of the Classic RSI Advanced Dynamic RSI is based on the work of technical analyst J. Welles Wilder and has been further developed. This improved indicator combines Wilder's proven RSI calculation with modern features and a dynamic smoothing method, which delivers more precise and flexibly adjustable signals, allowing traders to analyze market volatility and price movements with greater accuracy.
Features and Key Characteristics Dynamic Levels: The Advanced D
FREE

MT5 Enveloping Pattern Detector: Your competitive advantage in trading Are you looking for a tool to help you accurately identify the best trading opportunities in the forex market? Our Engulfing Pattern Detector provides you with a highly reliable buy or sell signal, based on one of the most recognized and effective Japanese candlestick patterns: the engulfing pattern. With an average success rate of 70%, this indicator will allow you to make safer and more profitable investment decisions. Don'
FREE

MT5 Hammer Pattern Detector: Your guide to more profitable operations
Tired of searching for the best trading opportunities? Our innovative indicator gives you a competitive advantage by automatically identifying hammer patterns on your charts. Known for its high probability of success, the hammer pattern has been a fundamental tool in the arsenal of experienced traders for decades. Our indicator, designed to accurately detect this key pattern, will allow you to:
Identify trend reversals earl
FREE

Trading Session Indicator for MT5 This Session Indicator for MT5 visually highlights key trading sessions directly on your chart with customized colors, making it easier to track market movements during different time zones. The indicator automatically detects and displays the Asian, European, and US trading sessions, offering clear visual separation for each session using user-defined color schemes. Key Features: Automatically plots the major trading sessions (Asian, European, and US) on the ch
FREE
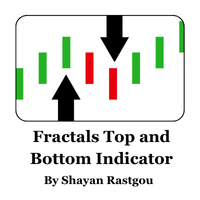
Discover the power of fractals to uncover significant market reversals! This custom Fractals Indicator for MetaTrader 5 is designed to help traders quickly and effectively spot potential swing highs and lows, providing visual cues that make trading decisions easier. Key Features: Clear Buy & Sell Signals: Green and red arrows highlight bullish and bearish fractals, helping you effortlessly identify significant price pivots. Customizable Analysis Depth: Choose the number of bars to evaluate for f
FREE
This non-repainting indicator, inspired by Larry Williams’ renowned "VIX Fix", replicates the power of the VIX (Volatility Index) but works across all asset classes—making it a versatile tool for traders. Originally designed for stock indices, this version adapts to any market, including forex, commodities, and crypto, providing valuable insights into potential market bottoms.
For more details, check out this pdf: https://www.ireallytrade.com/newsletters/VIXFix.pdf
Key Features: Based on the w
FREE

Overview The Time Trading Indicator AWT is designed for traders who often miss or overlook their trading opportunities. This tool helps users stay on top of their trading windows by providing timely alerts. Key Features User-friendly interface: Simple and intuitive design for easy navigation. Easy to use: Set it up quickly and start receiving notifications instantly. Alert and Push Notifications: Stay informed with real-time alerts and push notifications. Customizable Objects: Adjust the i
FREE
MetaTrader市场是一个简单方便的网站,在这里开发者可以出售自己的交易应用程序。
我们将帮助您发布您的产品,并向您解释如何为市场准备您的产品描述。市场上所有的应用程序都是加密保护并且只能在买家的电脑上运行。非法拷贝是不可能的。
您错过了交易机会:
- 免费交易应用程序
- 8,000+信号可供复制
- 探索金融市场的经济新闻
注册
登录