Neue technische Indikatoren für den MetaTrader 5

CVD SmoothFlow - Vereinfachen Sie die Volumenanalyse mit Präzision für BTCUSD! CVD SmoothFlow ist ein technischer Indikator, der speziell für Trader entwickelt wurde, die das Paar BTCUSD handeln. Durch die Nutzung der Berechnung von Cumulative Volume Delta (CVD) wird eine fortschrittliche Rauschfilterung angewendet, um eine klare und präzise Marktanalyse zu bieten. Was bietet CVD SmoothFlow? Klare Analyse: Filtert Marktrauschen heraus, damit Sie sich auf die relevantesten und bedeutendsten
FREE

CVD SmoothFlow Pro - Unbegrenzte Volumenanalyse für jedes Asset! CVD SmoothFlow Pro ist die ultimative Lösung für Trader, die eine präzise und unbegrenzte Volumenanalyse suchen. Mit der Berechnung des Cumulative Volume Delta (CVD) und fortschrittlicher Rauschfilterung bietet die Pro-Version die Flexibilität und Genauigkeit, die für den Handel mit jedem Finanzinstrument erforderlich sind. Was bietet CVD SmoothFlow Pro? Klarer Analyse : Filtert Marktrauschen und hebt signifikante Volumenbewe

Der Super Indicator ist eine umfassende Handelslösung, die auf neue und erfahrene Händler zugeschnitten ist. Es kombiniert über 5 Indikatoren, um Alarm zu geben
Signalklarheit: Bietet Pfeilsignale für klare Ein- und Ausstiegspunkte. Echtzeitwarnungen: Hält Händler mit Handelsein- und -ausstiegswarnungen auf dem Laufenden. Merkmale:
Kein Nachlackieren Maximale Aktivierungen 7+ Strategien 5 Indikatoren in einem Ein- und Ausstiegspunkte und Pfeile Benachrichtigungen per Telefon und E-Ma
Kostenloser Spread-Indikator für MetaTrader 5 Dieser Indikator bietet eine detaillierte Analyse des Spreads auf MetaTrader 5, einem der wichtigsten Parameter für Trader, da er die Differenz zwischen dem Kaufpreis (Ask) und dem Verkaufspreis (Bid) eines Vermögenswerts darstellt. Der Indikator umfasst: Durchschnittlicher Spread : Berechnet als Durchschnitt zwischen dem höchsten und niedrigsten Spread, der während des Tages beobachtet wurde. Aktueller Spread : Zeigt den aktuellen Marktspread an. Mi
FREE

"Fair Value Gap" (FVG) Indikator - Entdecken Sie die Kraft von Marktungleichgewichten Die Welt des Tradings ist voller versteckter Chancen, aber nur diejenigen, die die richtigen Werkzeuge besitzen, können sie effektiv erkennen und nutzen. Unser FVG Indikator wurde entwickelt, um Ihnen dabei zu helfen. Wenn Sie ein Trader sind, der seine Fähigkeit zur Marktanalyse verbessern und die besten Ein- und Ausstiegspunkte identifizieren möchte, ist der FVG Indikator Ihr perfekter Begleiter. Was ist das
Was ist der "Schaff RSX"? Der "Schaff RSX" kombiniert die Effizienz des Relative Strength Index (RSX) mit der Präzision des Schaff-Zyklus und schafft so einen einzigartigen Indikator, der Ihnen hilft, die besten Zeitpunkte für den Ein- und Ausstieg in den Markt mühelos zu identifizieren. Es ist, als hätten Sie ein Radar, das versteckte Handelsmöglichkeiten erkennt und Ihnen einen Wettbewerbsvorteil verschafft, den andere Trader einfach nicht ignorieren können. Warum den "Schaff RSX" wählen? Klar

The Omega Trend Indicator is an advanced tool that has been specifically designed to detect market trends early, and follow them efficiently. The indicator draws two lines. The main (thicker) Trend Line represents the presumed lower or upper volatility limits of the current market trend. A break in the main Trend Line indicates a potential reversal or shift in the movement of the trend. The Trend Line also indicates the best point to place a stop loss order. In Omega Trend Indicator, the Trend L
FREE

ATLogic Indicator: A Versatile Tool for All Trading Instruments
ATLogic is a comprehensive and user-friendly technical analysis tool designed for a wide range of financial instruments, including all currency pairs, indices, and cryptocurrencies. This versatile indicator offers traders powerful insights across various markets:
Leave a massage after purchase and receive a special bonus gift. 4 copies left for 30$ price "DM me to connect with my AI tutor and learn how to use this indicator mo

YOU CAN NOW DOWNLOAD FREE VERSIONS OF OUR PAID INDICATORS . IT'S OUR WAY OF GIVING BACK TO THE COMMUNITY ! >>> GO HERE TO DOWNLOAD
The Volatility Ratio was developed by Jack D. Schwager to identify trading range and signal potential breakouts. The volatility ratio is defined as the current day's true range divided by the true range over a certain number of days N (i.e. N periods). The following formula is used to calculate the volatility ratio: Volatility Ratio (VR) = Today's True Rang
FREE
BBTrend is a powerful trend analysis tool designed to provide a clear overview of market volatility and trends at a glance.
This indicator calculates the difference between two Bollinger Bands of different periods,
visually indicating the strength of upward or downward trends to traders. Clear Trend Visualization: The upward trend is represented in green, and the downward trend in red,
allowing traders to intuitively grasp the direction and strength of the trend. Standardized Percentage D
FREE
Entry Confirmation Indicator for MT5: Precision Trading for Volatility Indices The Entry Confirmation Indicator for MetaTrader 5 (MT5) is a powerful and versatile tool tailored specifically for traders who focus on volatility indices. Whether you're looking to capitalize on trend continuations or identify key reversal points, this indicator is designed to provide clear and actionable signals that enhance your trading strategy. Targeted Instruments: A Focus on Volatility This indicator is optimiz
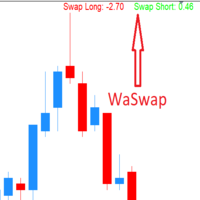
WaSwap MT5 Indicator shows the current Swap Long and current Swap Short with color.
* Set the Swap Threshold and the color to identify when the current swap is below or above the Spread Threshold.
* Set X axis and Y axis and chose the Corner and the Anchor to position the Swap Label on the chart.
* Write the font and the font size for more confort.
* Activate alert if the current Swap Long or the current Swap Short is below the swap threshold.
* The user will never swing with a negati
FREE

!!!This Free Version just works on EURUSD!!! Wa Previous Candle Levels MT5 shows the previous candle levels, it shows the previous candle Open High Low Close levels (OHLC Levels) in different time frame. It's designed to help the trader to analyse the market and pay attention to the previous candle levels in different time frame. We all know that the OHLC Levels in Monthly, Weekly and Daily are really strong and must of the time, the price strongly reacts at those levels. In the technical anal
FREE

Previous Candle Levels MT5 shows the previous candle levels, it shows the previous candle Open High Low Close levels (OHLC Levels) in different time frame. It's designed to help the trader to analyse the market and pay attention to the previous candle levels in different time frame. We all know that the OHLC Levels in Monthly, Weekly and Daily are really strong and must of the time, the price strongly reacts at those levels. In the technical analysis, the user can use them as a support and res
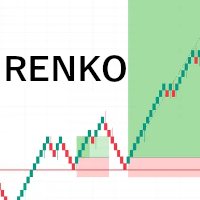
HiperCube RENKO is ready!
Definition
Renko charts are a type of financial chart that measures and plots price changes, using bricks (or bars) to represent price movements . Unlike traditional candlestick charts, Renko charts do not display time-based information, focusing solely on price fluctuations.
Features
Easy to configure only drag on any chart, select size of bricks, and ready! Custom Colors of Candels Separated windows to keep main chart clear
FREE
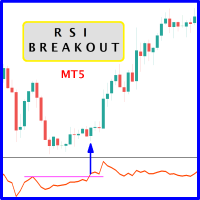
The likelihood of farther price movement increases when Relative Strength Index oscillator "RSI" breaks through its historical resistance levels in conjunction with prices breakout of resistance levels. It's strongly encouraged to confirm price breakout with oscillator breakout since they have comparable effects to price breaking support and resistance levels; similar perception is applied to short trades. Concept is based on find swing levels which based on number of bars by each side to confir
FREE
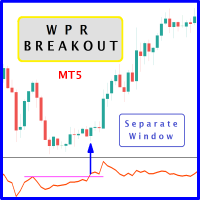
The likelihood of farther price movement increases when Larry Williams Percentage Range oscillator "WPR" breaks through its historical resistance levels in conjunction with prices breakout of resistance levels. It's strongly encouraged to confirm price breakout with oscillator breakout since they have comparable effects to price breaking support and resistance levels; similar perception is applied to short trades. Concept is based on find swing levels which based on number of bars by each side t
FREE
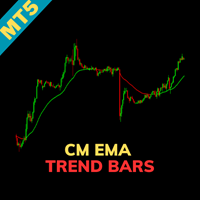
Indicator Name: CM EMA Trend Bars Overview: The CM EMA Trend Bars indicator is a straightforward yet effective tool that changes the color of price bars based on their relationship to the Exponential Moving Average (EMA). This visual cue helps traders quickly identify trend direction and potential trading opportunities. Key Features: Dynamic Bar Coloring: The indicator changes the color of the bars depending on whether they are above or below the EMA, providing a clear visual representation of t
FREE
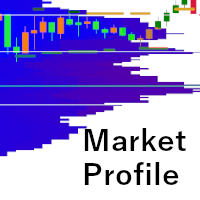
HiperCube Market Profile ! A Market Profile is a graphical representation that combines price and time information in the form of a distribution . It displays price information on the vertical scale (y-axis) and volume information on the horizontal scale (x-axis). This chart type provides insights into market activity, allowing traders to visualize and evaluate fair market value in real-time.
Features: Custom Colors Custom Chart Clearly info on Chart Graph and attractive interface Setting t
FREE
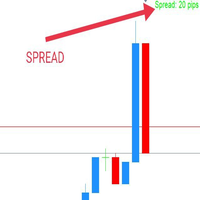
WaSpread MT5 Indicator shows the current spread in pips with color.
* Set the Spread Threshold and the color to identify when the current spread is below or above the Spread Threshold.
* Set X axis and Y axis and chose the Corner and the Anchor to position the Spread Label on the chart.
* Write the font and the font size for more confort.
* Activate alert if the current spread is above the spread threshold.
* For more precision, the user can choose to show the decimal numbers.
* The
FREE
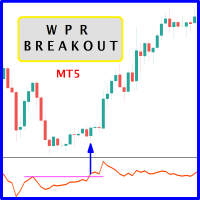
The likelihood of farther price movement increases when Larry Williams Percentage Range oscillator "WPR" breaks through its historical resistance levels in conjunction with prices breakout of resistance levels. It's strongly encouraged to confirm price breakout with oscillator breakout since they have comparable effects to price breaking support and resistance levels; similar perception is applied to short trades. Concept is based on find swing levels which based on number of bars by each side t
FREE
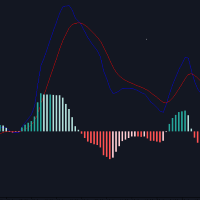
Overview : Introducing the Custom MACD Indicator for MetaTrader 5, inspired by the popular TradingView MACD but enhanced with additional features. This indicator provides traders with more flexibility and better visual cues for decision-making. Key Features : Custom Histogram Colors : Set your preferred color scheme for the MACD histogram to improve visibility and match your trading chart style. Recalculated Histogram Values : Get more accurate signals with our recalculated histogram values, des
FREE

DYJ SmoothedMA Strategy is a very simple but powerful system to get forex and s ynthetic market trend direction. This indicator is actually a moving average indicator containing 10 smoothing algorithms in a file . The indicator can help you to see the whole trend break out/rebound signal. And these BUY and SELL signals are sent out. You can use DYJ GameDevice follow-up software to receive these signals and realize automatic opening and closing of positions. And can use the game strategy fu
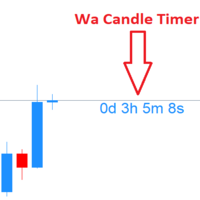
Wa Candle Timer MT5 is an indicator which shows the user how much time is remaining until the next candle will form. When it remains less than 5% before the current candle will be closed, the color of the time changed. These are the settings: 1- Color of Candle Timer when it remains MORE than 5% percentage of current bar to be closed. 2- Color of Candle Timer when it remains LESS than 5% percentage of current bar to be closed. 3- Candle Timer Font Size. 4- Candle Timer font (e.g.: "Arial").
FREE
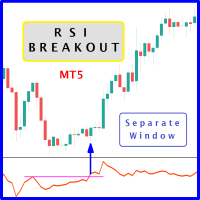
The likelihood of farther price movement increases when Relative Strength Index oscillator "RSI" breaks through its historical resistance levels in conjunction with prices breakout of resistance levels. It's strongly encouraged to confirm price breakout with oscillator breakout since they have comparable effects to price breaking support and resistance levels; similar perception is applied to short trades. Concept is based on find swing levels which based on number of bars by each side to confir
FREE
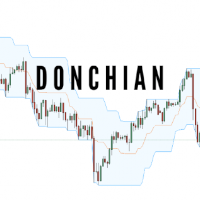
HiperCube DonChain is here!
This indicators helps you to know when one active will be a oppossite moviment.
FEATURES: Custom Period Custom Color to Bands
Price Off Set Custom Your Chart !
For Developers: If you are developer and want use this is your code here you have a guide to integrate HiperCube DonChain to your code
Read Guide
Feel free to ask me any question after purchase
FREE

Adjustable Consecutive Fractals looks for 2 or more fractals in one direction and sends out a on screen alert, sound alert and push notification, for strong reversal points .
Adjustable Consecutive Fractals, shows the fractals on chart along with a color changing text for buy and sell signals when one or more fractals appear on one side of price.
Adjustable Consecutive Fractals is based Bill Williams Fractals . The standard Bill Williams fractals are set at a non adjustable 5 bars, BUT withe
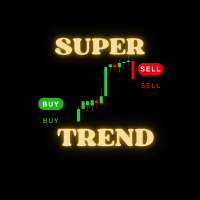
Welcome to Super Trend System. The system has a track record of 18 months with a consistence performance in a live account. It is designed with a great trend base determination algorithm that performs over 88% of forex pairs positively. The algorithm is also populated by multi-time frames to find an overall market trend direction. Kindly find the images for trades management. How to use the System? When the signal line turns red, that is Sell signal, wait until the new red line creates and edg
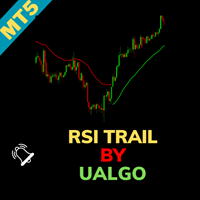
RSI Trail [UAlgo] Indicator for MetaTrader 5 The RSI Trail [UAlgo] indicator is a sophisticated technical analysis tool designed to enhance trading strategies by leveraging the Relative Strength Index (RSI) in conjunction with various moving average calculations. This indicator dynamically plots support and resistance levels based on RSI values, offering clear visual signals for potential bullish and bearish market conditions. Key Features:
Dynamic Support and Resistance Levels: The indicator
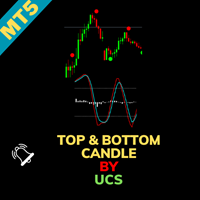
UCS_Top & Bottom Candle Indicator for MetaTrader 5 The UCS_Top & Bottom Candle is an innovative experimental indicator designed for MetaTrader 5. Based on momentum, this indicator identifies the top and bottom candles for most swing movements, assisting traders in making precise market entries and exits. Key Features: Momentum-Based Analysis: Utilizes momentum to detect the top and bottom candles for swing trading opportunities. Customizable Settings: Percent K: Set the Percent K value (default
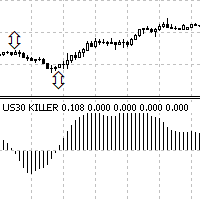
Us30 killer non repaint non repaint (means that the arrows that appear on the chart will not disappear or redraw). Us30 killer consists of 2 black arrows and a histogram. if black arrow appears above the current price look for selling opportunities ( See figure 3) if black arrow appears below current price look for buying opportunities. (See figure 3) The indicator works on all timeframes recommended is M5 TO Monthly Timeframe.
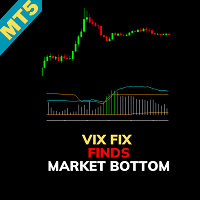
Indicator Name: CM_Williams_Vix_Fix Finds Market Bottoms Overview: The CM_Williams_Vix_Fix Finds Market Bottoms indicator is an advanced tool designed to identify market reversal points across various asset classes. Inspired by the original work of Larry Williams, this indicator provides similar insights to the VIX for stock indices but with the added flexibility of functioning effectively across all asset types. Key Features: Versatility Across Asset Classes: Unlike traditional indicators that
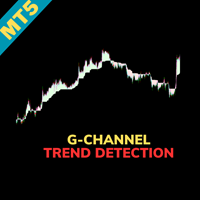
Indicator Name: G-Channel Trend Detection Overview: The G-Channel Trend Detection indicator offers a unique approach to trend analysis, leveraging AlexGrover's G-Channel methodology. This indicator provides a clear and simplified view of market trends by identifying bullish and bearish conditions based on price interactions with the G-Channel boundaries. Key Features: Trend-Based Market Analysis: The indicator determines trend direction by monitoring price action relative to the G-Channel bounda

Crash 1000 Scalping Indicator for the Crash 1000 Deriv Synthetic Index. Introduction The Crash 1000 Scalping Indicator is a specialized tool designed for the Crash 1000 index on the Deriv Synthetic market. This indicator is particularly useful for scalping on the M1 timeframe, helping traders to identify precise entry and exit points for buy positions. It is designed to be non-repainting, providing clear signals with audible alerts and push notifications, and is compatible with mobile devices th

Looking to boost your trading performance on MT5? Introducing the signal indicator that will become your reliable ally on the path to success! This unique indicator utilizes arrows and a color-changing moving average to simplify your trading decisions. When the trend shifts upwards, the indicator turns the line blue, alerting you to potential price increases. If the trend reverses downwards, the line turns red, signaling a potential price drop. Additionally, arrows precisely indicate the optimal
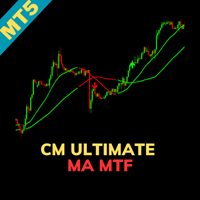
Indicator Name: CM_Ultimate_MA_MTF_V2 - Added Tilson T3 Overview: The CM_Ultimate_MA_MTF_V2 is a powerful moving average indicator that offers a high degree of customization and flexibility for traders. It supports multiple types of moving averages, including the advanced Tilson T3, and provides features such as multi-timeframe analysis, cross detection, and visual highlights. Key Features: Multi-Timeframe Flexibility: The indicator defaults to the current timeframe on the chart but allows users
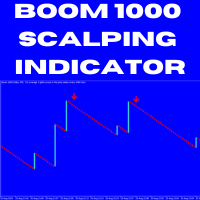
DC Boom 1000 Scalping Strategy Guide **Price**: $30 **Contact**: WhatsApp/Telegram: +27683229304 WhatsApp/Telegram: +27671192993 1. Understanding the Boom 1000 Index Boom 1000 Index: A synthetic index known for generating upward spikes. This strategy focuses on capturing the brief downward movements between spikes by selling when specific signals appear. 2. Timeframe M1 Timeframe: This strategy is exclusively designed for the 1-minute (M1) chart, allowing you to make quick trades and capture sma
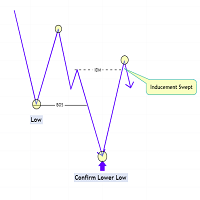
The Market Structure with Inducements & Sweeps indicator is a unique take on Smart Money Concepts related market structure labels that aims to give traders a more precise interpretation considering various factors.
Compared to traditional market structure scripts that include Change of Character (CHoCH) & Break of Structures (BOS) -- this script also includes the detection of Inducements (IDM) & Sweeps which are major components of determining other structures labeled on the chart.
SMC &

The Period Breakout Indicator is a versatile tool designed for traders seeking to identify breakout opportunities based on customizable time periods. This indicator automatically determines the highest and lowest prices within a user-defined period, allowing you to tailor it precisely to your trading strategy. Key Features: Customizable Time Periods: Define the start and end times based on your preferred trading hours or any specific period. The indicator will then calculate the highest and lo
FREE
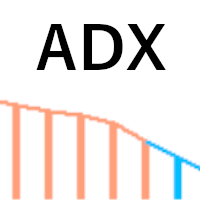
HiperCube ADX Histogram is here!
This indicators helps you to know if could be a strong trend in the market .
ADX is a very popular and usefull indicator, so many top traders reccomends use it as filter to bad trades, or in combinations of other analysis.
With HiperCube ADX you will be a premium exoerience using a beautifula and great indicator for your trading.
FEATURES: Fully Customizable Custom Your Chart! Custom Color to Histogram In Sub Windows for have a clear main chart
HiperCube VIX is here! HiperCube VIX known as the CBOE Volatility Index, is a widely recognized measure of market fear or stress . It signals the level of uncertainty and volatility in the stock market, using the S&P 500 index as a proxy for the broad market. The VIX Index is calculated based on the prices of options contracts on the S&P 500 index.
Features: Custom Colors Custom Chart Colors Indicator display in subwindows to keep main graph clear Easy to interpretate Fully Customize

The "HiperCube USD INDEX" is a financial benchmark representing the performance of a specific group of assets, like stocks, bonds, or commodities, with values denominated in U.S. dollars. These indices help investors track and compare the performance of particular sectors or markets over time. By being expressed in USD, the index provides a consistent measure for evaluating investments, regardless of the assets' native currency or geographical location.
Performance
Indicator to separate w

HiperCube AutoTrend Lines
This indicator helps you to identify easly supports and resistance, draw lines in chart and know where is a importnat point in the market.
FEATURES Easy to use Ready with usefull options Custom your Resistance and Support Lines
Recommendation
Combine this with others indicators and analysis this is only a basic tool to confirm a good pattern of market

The Spike Forecaster SFD is a system that was developed to catch spikes, it simple to use, its just plug and play.
It will give both Buy Alerts and Sell Alerts through arrows white and red respectively.
The system was designed to make it easier for those traders who might be busy to analyse the market hence it will just give you simple alerts to know the direction of the market. Regards
Spike Forecaster

This is a early support and resistance indicator. It will allow you to choose how many candles back. You can use it on all timeframes. Change the color as you like. You can use it with other indicators for better entry prediction it will give you trend for bear market and bull market. It will help you predict sideways market trending market and falling market. Save trading
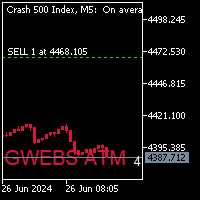
The Kijun Sen is a component of Ichimoku Kinko Hyo indicator. The Ichimoku Kinko Hyo is a technical analysis indicator that measures the direction, momentum, and strength of trends in the market , effectively helping traders point out trade signals where possible. Its lines also serve as support and resistance lines that give traders further insight into the market dynamics.
The Entry criteria used ensures that sniper entries are the norm. Indicator directs the trader to take the entry b

Enjoy the Free Candle Color indicator. It is in support of the GWEBS ATM EA for seamless automatic Entries and trade management with Stop Loss , T railing Stop and Take Profit all fully customizable to your risk appetite and trade Horizon !!!!!!!!
I shows visual representation of the Ichimoku Kinko Hyo indicator. Kijun Sen as the color change parameter. Great for beginners and
FREE
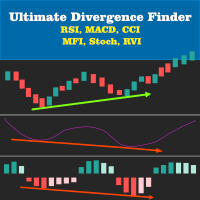
Multi Indicator Divergence Finder Enhance your trading strategy with the Multi Indicator Divergence Finder! This versatile tool is engineered to help traders quickly and accurately identify both regular and hidden divergences across multiple popular indicators simultaneously, including RSI, MACD, CCI, Stochastic, MFI, and RVI. Experience real-time divergence detection with signals plotted directly on your charts. Key Features: Simultaneous Multi-Indicator Divergence Detection : Detect regular an

ATREND: How It Works and How to Use It How It Works The " ATREND " indicator for the MT5 platform is designed to provide traders with robust buy and sell signals by utilizing a combination of technical analysis methodologies. This indicator primarily leverages the Average True Range (ATR) for volatility measurement, alongside trend detection algorithms to identify potential market movements. Leave a massage after purchase and receive a special bonus gift. 8 copies left for 39$ price
Key Fe
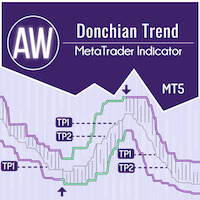
AW Donchian Trend ist ein Trendindikator, der auf dem Donchian-Kanal basiert. Der Indikator kann TakeProfit- und StopLoss-Niveaus berechnen, verfügt über erweiterte Statistiken zum Erfolg von Signalen sowie drei Arten von Benachrichtigungen über das empfangene Signal. Installationshandbuch und Anweisungen - Hier / MT4 Version - Hier So handeln Sie mit dem Indikator: Der Handel mit AW Donchian Trend erfolgt in nur drei einfachen Schritten: Schritt 1 - Eine Position eröffnen Ein Kaufsig

Heiken Ashi MT5 Indikator Verbessern Sie Ihre Marktanalyse mit dem Heiken Ashi MT5 Indikator. Dieses leistungsstarke Tool verwandelt Standard-Preisdaten in glattere, trendorientierte Kerzen, wodurch die Identifizierung von Markttrends und potenziellen Umkehrpunkten erleichtert wird. Hauptmerkmale: Klare Trendidentifikation: Unterscheiden Sie visuell zwischen Aufwärts- und Abwärtstrends durch unterschiedliche Kerzenfarben. Rauschreduktion: Filtern Sie Preisschwankungen heraus und erhalten Sie ei
FREE

The Market Structure Analyzer is a powerful tool designed for traders who follow market structure and smart money concepts. This comprehensive indicator provides a suite of features to assist in identifying key market levels, potential entry points, and areas of liquidity. Here's what it offers:
1. Swing High/Low Detection : Accurately identifies and marks swing highs and lows, providing a clear view of market structure.
2. Dynamic Supply and Demand Zones: Draws precise supply and demand zo

Adaptive Volatility Range [AVR] - is a powerful tool for identifying key trend reversals. AVR - accurately displays the Average True Volatility Range taking into account the Volume Weighted Average price. The indicator allows you to adapt to absolutely any market volatility by calculating the average volatility over a certain period of time - this provides a stable indicator of positive transactions. Thanks to this , Adaptive Volatility Range has a high Winrate of 95% There are two ways t

SolarTrade Suite 金融指標: Comet 市場指標 - 金融市場の世界で信頼できるガイド!
これは、特別な革新的で高度なアルゴリズムを使用して値を計算する期間指標であり、デザインも魅力的です。
この指標の読み取りは非常に理解しやすいです。緑の縦線は新しい期間の始まりです。
説明の下部にある SolarTrade Suite シリーズの他の製品をご覧ください。
投資と金融市場の世界を自信を持ってナビゲートしたいですか? SolarTrade Suite 金融指標: Comet 市場指標は、情報に基づいた投資決定を行い、利益を増やすのに役立つように設計された革新的なソフトウェアです。
SolarTrade Suite 金融指標: Comet 市場指標の利点:
- 正確な予測: 当社の指標は、高度なアルゴリズムと分析方法を使用して、市場の動きを正確に予測します。
資産を売買するのに最適なタイミングに関するシグナルを受け取ります。 - ユーザーフレンドリーなインターフェース: 直感的なインターフェースにより、プログラムを簡単にマスターし、インストー

Eine Reihe von Indikatoren, die Wendepunkte erkennen. Erkennt Höchst- und Tiefststände von Candlestick-Kombinationen, nachdem sie von zwei MAs abgezogen wurden. Gilt für Handelssysteme bei Verwendung von Early Entrys. Kann entlang des Trends für Scalping und Intraday-Handel sowie zur frühzeitigen Erkennung von Trendumkehrungen verwendet werden.
Möglichkeiten
Die Parameter bieten flexible Einstellungen für beliebige Zeitrahmen und Handelsinstrumente. Es gibt verschiedene Arten von Alarmen

Aufgrund technischer und logischer Manipulationen durch Brokerage habe ich einen langen Weg zurückgelegt, um diesen Indikator zu entwickeln, der zahlreiche Strategien mit den folgenden Fähigkeiten kombiniert:
Identifizierung von Markttrends: Verstehen Sie den allgemeinen Trend des Marktes.
Umkehrpunkte: Identifizieren Sie potenzielle Punkte, an denen der Markt die Richtung ändern könnte.
Einstiegs- und Ausstiegspunkte: Bestimmen Sie optimale Zeitpunkte für den Einstieg und Ausstieg aus Tr

Überblick SwingVolumePro ist ein fortschrittlicher und vielseitiger Indikator, der für eine breite Palette von Finanzinstrumenten entwickelt wurde und verschiedene Handelsstile unterstützt. Basierend auf strengen Analysen von Volumen und Preis bietet er klare und präzise Signale, die es Händlern aller Erfahrungsstufen ermöglichen, informierte Entscheidungen auf Grundlage hochwertiger Daten zu treffen. Hauptmerkmale Vielseitigkeit: SwingVolumePro kann auf verschiedenen Assets angewendet

Währungsstärke-Index (Currency Strength Index - CSI) Indikator BEVOR SIE DEN INDIKATOR AKTIVIEREN, DENKEN SIE DARAN, "TRUE" EINZUSTELLEN, UM DIE PAARE ANZUZEIGEN Der Währungsstärke-Index (Currency Strength Index - CSI) Indikator ist ein leistungsstarkes Werkzeug, das im Forex-Handel verwendet wird, um die relative Stärke der wichtigsten Währungen zu messen. Dieser Indikator hilft Tradern, die stärksten und schwächsten Währungen zu identifizieren, was es ihnen ermöglicht, fundiertere Handelsents

Der SuperTrend ist einer der effektivsten und am weitesten verbreiteten technischen Indikatoren im Trading, ideal zur Identifizierung der Trendrichtung und zur Generierung von Ein- und Ausstiegssignalen. Basierend auf Volatilität und Trend passt sich dieser Indikator dynamisch den Marktbedingungen an und bietet Händlern eine klare visuelle Orientierung. Hauptmerkmale: Trend-Erkennung: Der SuperTrend folgt dem Markttrend und zeichnet eine Linie, die bei einem Abwärtstrend über dem Preis und bei e

Neues Kombi-Indikator - 3 in 1 Suchen Sie nach Trading-Tools, die Ihre Marktanalyse und Anlagestrategien verbessern können? Wir haben drei unserer besten Indikatoren zu einer leistungsstarken und praktischen Lösung kombiniert, mit der Sie das Beste aus Ihrem Handel herausholen können. 1. Orderblock-Indikator (ehemals für 32,90$ verkauft) Der Orderblock-Indikator ist ein wesentliches Werkzeug zur Identifizierung von Bereichen von institutionellem Interesse im Markt. Dieser Indikator markiert die

Enhance Your Trading with Buraq Bars Indicator! Take your trading to the next level with Buraq Bars ! This easy-to-use indicator draws bars on your chart whenever the RSI (Relative Strength Index) crosses above or below the levels you choose, giving you clear signals to help you trade better. Key Features: Set Your Own RSI Levels: Choose the levels for overbought and oversold that work best for you. Clear Visual Signals: Bars appear on your chart when the RSI crosses your levels, making it easy
Verbessere Deine Handelsstrategien mit dem "Order Block" Indikator für MT4 Entdecke den "Order Block" Indikator: Der "Order Block" Indikator für MT4 ist darauf ausgelegt, Orderblöcke im Markt präzise zu identifizieren, indem er die Hochs und Tiefs der Orderblock-Kerzen markiert. Dieses leistungsstarke Tool ermöglicht es dir, zu verstehen, wo große Institutionen ihre Aufträge platzieren und so deine Fähigkeit zur Vorhersage von Marktbewegungen zu verbessern. Hauptmerkmale: Präzise Orderblock-Erke
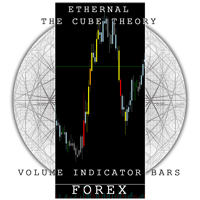
Der Cube Bars Forex ist ein Indikator für Meta Trader 5, der von mir Tomas Lekim erstellt wurde, um die Kerzen basierend auf den Volumenspitzen der Großinvestoren auf dem Forex-Markt zu färben. Es verfolgt die Kauf- und Verkaufsspitzen und malt die Kerzen entsprechend dem Geldbetrag, der von den anderen Robotern investiert wurde. Es ist ein mächtiges Werkzeug gegen große Roboter, weil es die Momente identifiziert, in denen sie Entscheidungen treffen müssen. Es kann entsprechend dem Währungspaar

Der Indikator zeichnet Pivot-Ebenen für den ausgewählten Zeitrahmen in der klassischen Methode Pivot = (high + close + low) / 3 R1 = ( 2 * Pivot) - low S1 = ( 2 * Pivot) - high R2 = Pivot + ( high - low ) R3 = high + ( 2 * (Pivot - low)) S2 = Pivot - (high - low) S3 = low - ( 2 * (high - Pivot)) Du kanst den Timframe die Farbe und die Textgröße anpassen. Du kannst auch den Hiweistext der Levels ändern.
Viel Spass, und Feedback ist erwünscht!
FREE

This indicator identifies and highlights market inefficiencies, known as Fair Value Gaps (FVG), on price charts. Using a custom algorithm, the indicator detects these areas of imbalance where the price moves sharply, creating potential trading opportunities. Indicator Parameters: Bullish FVG Color (clrBlue) : Color used to highlight bullish inefficiencies. The default value is blue. Bearish FVG Color (clrRed) : Color used to highlight bearish inefficiencies. The default value is red. Bullish FVG
FREE

Aristotle Market Profile SMC Indicator: Overview: The Aristotle Market Profile SMC Indicator, is a comprehensive and highly customizable tool designed for traders seeking to integrate Market Profile analysis into their trading strategies. This advanced indicator is built to display the Market Profile across various trading sessions, including intraday, daily, weekly, and monthly periods, offering deep insights into market behavior and price levels over different timeframes. Key Features: Mult
FREE

Im Trading-Bereich ist der Schlüssel zum Erfolg, die richtigen Werkzeuge zur richtigen Zeit zu haben. Unser innovativer Volumenprofil-Indikator wurde mit einem einzigen Ziel entwickelt: Tradern einen beispiellosen Zugang zu wichtigen Marktaktivitätsinformationen zu bieten. Dieses hochmoderne Werkzeug ermöglicht es Ihnen nicht nur zu sehen, wo und wann Volumen gehandelt wird, sondern auch die Markttiefe mit einer nie dagewesenen Klarheit zu verstehen. Hauptmerkmale: Zeitliche Flexibilität: Stelle

Maximiere deine Trading-Chancen mit dem "Auto Trendlines" Indikator Entdecke den "Auto Trendlines" Indikator: "Auto Trendlines" ist das essentielle Werkzeug für jeden technischen Trader. Dieser Indikator zeichnet automatisch Trendlinien und identifiziert Unterstützungs- und Widerstandsniveaus mit chirurgischer Präzision. Ideal für diejenigen, die Marktausbrüche und Umkehrungen nutzen möchten. Hauptmerkmale: Automatisches Zeichnen von Trendlinien: Identifiziert und zeichnet wichtige Trendlinien o

Optimiere deine Handelsentscheidungen mit dem "autoFibo" Indikator Entdecke den "autoFibo" Indikator: "autoFibo" ist das essenzielle Analysewerkzeug für Trader, die Fibonacci-Niveaus voll ausnutzen möchten, ohne manuell zeichnen zu müssen. Dieser Indikator automatisiert den Fibonacci-Retracement-Prozess und bietet sofortigen visuellen Zugang zu wichtigen Unterstützungs- und Widerstandszonen. Hauptmerkmale: Automatisches Fibonacci-Retracement: Zeichnet automatisch Fibonacci-Niveaus, was die Ident

Verbessere deine Trading-Leistung mit dem "Better Volume" Indikator Entdecke den "Better Volume" Indikator: Der "Better Volume" ist das essenzielle Werkzeug zur Analyse des Marktvolumens für Trader, die sich abheben möchten. Es analysiert Tick-Volumen mit beispielloser Genauigkeit und bietet eine fortgeschrittene Gleitende-Durchschnitt-Funktion (PERIOD_MA) sowie anpassbare Kauf- und Verkaufsalarme. Hauptmerkmale: Fortgeschrittene Volumenanalyse: Erkenne Volumenspitzen, die wichtige Preisbewegung
MetaTrader Market bietet jedem Entwickler eine einfache und bequeme Plattform für den Verkauf von Programmen.
Wir unterstützen Sie bei der Veröffentlichung des Produkts und beraten Sie gerne, wie man eine Beschreibung für den Market vorbereitet. Alle Produkte, die im Market verkauft werden, sind durch eine zusätzliche Verschlüsselung geschützt und können nur auf dem Rechner des Kunden gestartet werden. Illegales Kopieren ist ausgeschlossen.
Sie verpassen Handelsmöglichkeiten:
- Freie Handelsapplikationen
- Über 8.000 Signale zum Kopieren
- Wirtschaftsnachrichten für die Lage an den Finanzmärkte
Registrierung
Einloggen
Wenn Sie kein Benutzerkonto haben, registrieren Sie sich
Erlauben Sie die Verwendung von Cookies, um sich auf der Website MQL5.com anzumelden.
Bitte aktivieren Sie die notwendige Einstellung in Ihrem Browser, da Sie sich sonst nicht einloggen können.