Conheça o Mercado MQL5 no YouTube, assista aos vídeos tutoriais
Como comprar um robô de negociação ou indicador?
Execute seu EA na
hospedagem virtual
hospedagem virtual
Teste indicadores/robôs de negociação antes de comprá-los
Quer ganhar dinheiro no Mercado?
Como apresentar um produto para o consumidor final?
Novos Indicadores Técnicos para MetaTrader 5

O FX Levels é um indicador de suporte e resistência excecionalmente preciso que funde o método tradicional do Lighthouse com uma abordagem dinâmica inovadora, funcionando sem falhas em todos os símbolos de negociação. Isto inclui pares de moedas, índices, acções ou mercadorias. O FX Levels identifica pontos de inversão e apresenta-os no gráfico, que podem ser utilizados de forma ideal como objectivos de lucro nas suas actividades de negociação. Ao desenvolver o FX Levels, usámos a nossa vasta e
Quanto lucro é perdido por causa de um TakeProfit instalado incorretamente. E quantos padrões de velas se recusaram a funcionar devido ao fato de que no local de sua formação não havia uma área de interesse para os licitantes. Lucros perdidos e entradas perdidas com a escolha certa da direção Global-é sempre uma pena em trigêmeos. A negociação traz muita dor e caos quando tentamos negociar sem objetivos claros. Normalmente, em manuais de negociação ou em previsões de analistas, desenhar o canal

The "Power of Three" (PO3) is a concept developed by the Inner Circle Trader (ICT) to illustrate a three-stage approach used by smart money in the markets: Accumulation, Manipulation, and Distribution . ICT traders view this as a foundational pattern that can explain the formation of any candle on a price chart. In simple terms, this concept is effective for any time frame, as long as there's a defined start, highest point, lowest point, and end. MT4 - https://www.mql5.com/en/market/product/1
FREE
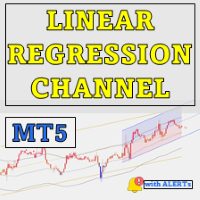
Somente 5 cópias disponíveis por $49 – Garanta a sua antes que o preço suba para $149! O Indicador de Canal de Regressão Linear é uma poderosa ferramenta de análise técnica que ajuda os traders a capturar tendências de preços e pontos de reversão potenciais. Calculando e exibindo canais de regressão linear, bandas e projeções futuras, este indicador oferece uma perspectiva aprofundada sobre a dinâmica do mercado. Auxilia na identificação de condições de sobrecompra e sobrevenda, direção da tend
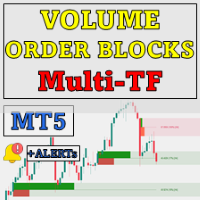
Apenas 5 cópias disponíveis por $49 – Garanta a sua antes que o preço suba para $149! O indicador Volumetric Order Blocks Multi Timeframe é uma ferramenta poderosa projetada para traders que buscam insights mais profundos sobre o comportamento do mercado, identificando áreas de preço chave onde participantes significativos do mercado acumulam ordens. Essas áreas, conhecidas como blocos de ordens volumétricos, podem servir como zonas potenciais de suporte e resistência, proporcionando uma vantag
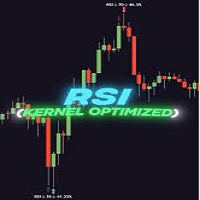
GENERAL OVERVIEW
Introducing our new KDE Optimized RSI Indicator! This indicator adds a new aspect to the well-known RSI indicator, with the help of the KDE (Kernel Density Estimation) algorithm, estimates the probability of a candlestick will be a pivot or not. For more information about the process, please check the "HOW DOES IT WORK ?" section. Features of the new KDE Optimized RSI Indicator :
A New Approach To Pivot Detection
Customizable KDE Algorithm
Realtime RSI & KDE Dashboard

# Indicador Daily High - Danilo Monteiro - MT5
## Descrição O Daily High/Low Labels é um indicador personalizado para MetaTrader 5 que exibe automaticamente as máximas e mínimas diárias no gráfico, facilitando a identificação rápida dos níveis importantes de preço. O indicador marca os preços com etiquetas e linhas horizontais, permitindo uma visualização clara dos níveis críticos do dia atual e anterior.
## Principais Características
### 1. Marcação Automática - Exibe automaticamente as m
FREE

Real Spread Monitor is a powerful indicator that is designed to accurately measure and analyze real spreads, giving traders the ability to compare trading conditions of different brokers. This product is also available for MetaTrader 4 => https://www.mql5.com/en/market/product/125769 Key Features of Real Spread Monitor:
1. Two modes of operation: Write mode : In this mode the indicator collects data on real spreads of the selected trading instrument and records them in a file. The spread is

This indicator is the mql version of the Smoothed Heiken Ashi Candles. Heikin-Ashi charts resemble candlestick charts , but have a smoother appearance as they track a range of price movements, rather than tracking every price movement as with candlesticks.
Because the Heikin Ashi candlesticks are calculated based on averages, the candlesticks will have smaller shadows than a regular Japanese candlestick. Just like with regular Japanese candlesticks, with a Heikin Ashi candlestick, the s
FREE

SuperTrend Indicator Code Description This code defines a custom indicator for the MetaTrader 5 platform called SuperTrend. The indicator is based on the Average True Range (ATR) to identify upward and downward trends in the market. Code Sections: Indicator Information: Defines the indicator's name, copyright, link, version, etc. Configures the indicator to be displayed in a separate window and have 9 internal buffers and 2 visible plots. Sets the properties of the plots (name, drawing type, col
FREE

This indicator is based on Bollinger Bands and moving averages, and uses ADX to get the turning point of the market trend and display a sign.
It is basically intended for use with currency pairs and futures with high volatility. In our tests we use it on XAUUSD, 5m and 15m. Win rate is more than 80% with 50 pips stop loss and 50 pips gain or more.
The indicator is also a simple indicator that allows you to enable or disable alerts and change the color of the arrows from the indicator settin
FREE

This indicator will help you track performance of your trades, even scalping trades. You can use it with the Arab, and many other traders.
This indicator displays essential trading account information directly on your chart. It positions itself in one of the four corners of the screen and showcases details such as: Symbol: The symbol of the asset currently displayed on the chart. Profit/Loss: The total profit or loss in dollars for the current symbol. Pips: The total number of pips gained or
FREE

Overview The Smart Money Structure Markup Indicator for MetaTrader 5 is a powerful tool designed to help traders identify key market structures based on popular Smart Money Concepts (SMC) strategies. This indicator detects micro-market structures, providing insights into price movements and potential trend changes. It highlights important elements such as valid Break of Structure (BOS), Change of Character (CHoCH), and Inducement (IDM), helping traders to make informed decisions. Key Features Ma
FREE

Alligator Window Indicator : Potencialize suas análises no MetaTrader com o Alligator Window. Este indicador coloca o clássico Alligator de Bill Williams em uma janela separada, permitindo uma visualização mais clara e organizada. Ideal para traders que buscam precisão e eficiência em suas operações, o Alligator Window proporciona insights nítidos e facilita a identificação de tendências sem poluir o gráfico principal. Experimente agora e leve suas estratégias de trading a um novo patamar!
FREE

Introducing Your Ultimate Trading Edge: Dynamic Support & Resistance, Advance Entry Levels Light Indicator for MT5 platform Unlock the power of precision trading with our cutting-edge Dynamic Support & Resistance Indicator. Designed to give traders unparalleled clarity, this indicator is your roadmap to identifying exactly where to buy and sell, maximizing your potential for consistent, sustainable profits. Why Choose Our Indicator? Crystal Clear Entry and Exit Points : No more guesswork. Our

CumulativeDeltaVolume indicator Description CumulativeDeltaVolume (CDV) is a technical indicator that combines volume analysis with modified Heiken Ashi candlesticks to determine the direction of the trend and the strength of the price movement. The indicator is displayed in a separate window and uses color coding to improve the user's visual experience. Main Features - Calculation of the cumulative volume delta based on the candle structure - Modified Heiken Ashi candlesticks to smooth out pri

This is an advanced trend indicator designed to accurately identify reversals and the beginning of trend movements. With this tool, you will be able to receive high-quality signals for entering and exiting the market, minimizing false entry points and increasing the profitability of transactions. The indicator is suitable for any assets (currency pairs, stocks, indices) and time intervals, from minute to daily charts.

Range Bar Pro Indicator for MetaTrader 5
Visualize market trends, levels and other features with Range Bar Pro, an innovative indicator that draws a unique, standalone candle on the right side of any MT5 chart. This single candle is generated from an analysis of price over a specified range, providing you with a powerful snapshot of the market. Key Features: Single-Candle Visualization: Gain quick insights with a single, specially derived candle that reflects comprehensive price movement over
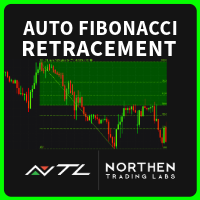
Discover Precision with the AutoFib Precision Tool – Your Ultimate Fibonacci Trading Solution! The AutoFib Precision Tool brings Fibonacci analysis to new heights, making it ideal for both novice traders seeking understanding and advanced traders refining strategies. This tool identifies key Fibonacci levels automatically, making the analysis process straightforward and efficient. Fully customizable, the AutoFib Precision Tool adapts seamlessly to your trading style and provides clear, actionabl

Indicador de Razão - Guia do Usuário
Este indicador de Razão entre ativos permite monitorar e operar a relação de preço entre dois ativos selecionados pelo usuário. Ele calcula a razão entre os preços de dois ativos, conhecidos como Ativo1 e Ativo2 (por exemplo, "PRIO3" e "PETR3"), e plota uma média móvel da razão, junto com bandas de Bollinger . Essas bandas são usadas para identificar momentos ideais de entrada e saída, especialmente em ativos correlacionados, permitindo uma abordagem de arbi
FREE

The "NBank Levels MT5 Indicator" is an essential tool for traders looking to refine their market strategies with precision. This indicator identifies and displays the key price levels for both the current day and the previous day, allowing traders to pinpoint exact entry points. By focusing on these specific levels, traders can enhance their decision-making process, leading to more accurate trade executions.
This indicator is designed to simplify the trading experience. It presents data clear

Automatically plots Fibo levels, based on the High & Low prices from the specified time frame Multiple bars may be united: e.g. you can get a Fibo based on the 10-days Highs and Lows My #1 Utility : 65+ features, including this indicator | Contact me for any questions | MT4 version Helps to see potential reversal levels; Patterns formed at the Fibo levels tend to be stronger; Significantly reduces the time spent on manual plotting ; Settings: Timeframe to calculate the
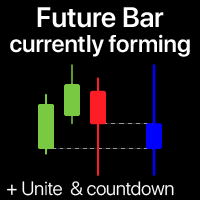
The indicator shows the currently forming candle of the selected time frame Multiple bars may be optionally united into a single candle: helps to see the bigger picture My #1 Utility : 65+ features, including this indicator | Contact me for any questions | MT4 version In the input settings, select the timeframe that will be used for the future bar: To the right of the current price, you will see a bar forming on the specified interval. If activated in the settings, the Co
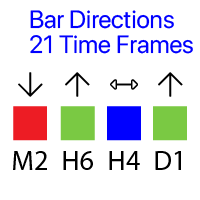
Shows the direction of the bars on all 21 timeframes. My #1 Utility : 65+ features | Contact me for any questions
The meaning of the visual signals ( squares):
Red : Close price is lower than the Open price: Close < Open; Green : Close price is higher than the Open price: Close > Open; Blue : Close price is equal to the Open price: Close = Open; You can set the Shift of the calculated bar, relative to the current bar: Shift = 0: the direction of the currentt
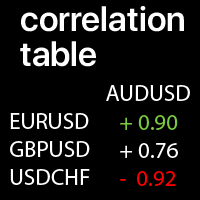
Correlation values between the selected Symbols: compare the current market trends A value of +1: means a complete positive correlation; A value of -1: means a complete inverse correlation; A value of 0: means there is no explicit correlation (prices do not depend on each other, or the correlation is random ); My #1 Utility : 65+ features | Contact me for any questions | MT4 version Each Symbol can be customized: removed / replaced. You can add up to 10 Symbols per Row / Co

# Indicador MultiZigZag Pro para MetaTrader 5
O MultiZigZag Pro é um poderoso indicador técnico para a plataforma MetaTrader 5 que identifica, de forma inteligente e flexível, os principais pontos de inflexão e tendências nos gráficos de preços.
## Características principais: - Algoritmo avançado que filtra ruídos e movimentos irrelevantes do mercado - Múltiplos timeframes para análise de tendências de curto a longo prazo - Parâmetros de profundidade e desvio personalizáveis para adaptação
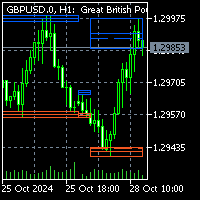
To get access to MT4 version please click here . Note: Multi time frame option is not available with this indicator. To order multi time frame please contact via private message. This is the exact conversion from TradingView: "Supply and Demand Daily byLuxAlgo". This is a light-load processing. All input options are available except multi time frame option. Buffers are available for processing in EAs. Only the latest bar of every new day(rightmost) holds the valid value. You can message in priv
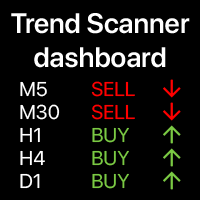
Trend dashboard: multi timeframe indicator, shows you the summary of the current trend This tool is based on the 3 major indicators: RSI, Stochastic and Commodity Channel Index. The alerts option will help you not to miss the beginning of the trend. My #1 Utility : includes 65+ features | Contact me if you have any questions | MT4 version A variety of options will allow you to customize the indicator according to your needs. Settings: Calculated bar: either the cu

Hey there! If you are using Moving Average indicator into RSI indicator's window and always wondering if there could be a way to get alerts on your smartphone when those two indicators get a crossover that would be great, right!? Then you have found the right tool for that. This indicator is nothing but a mix of MA indicator and RSI indicator into one indicator window as well as it will give you alerts for crossovers on your smartphone app, email and also on your trading terminal's (desktop) cha
Loud Key Levels MT5 Indicator The "Loud Key Levels" indicator for MetaTrader 5 is an innovative trading tool designed to enhance your market analysis by identifying critical support and resistance levels. This indicator simplifies the decision-making process for traders by providing a visual representation of average key levels, as well as upper and lower close key levels, facilitating a clearer understanding of potential price action. Key Features Average Key Levels : The core function of the
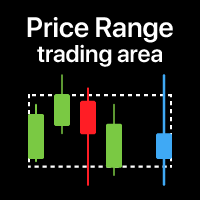
Price zone: v isualization of the trading range for the selected time period E specially useful when trading on low timeframes , so that you can see the range from a higher TF . My #1 Utility : 65+ features, including this indicator | Contact me for any questions | MT4 version When it might be useful: When using multiple time frames To see the overall picture from a different period To see the entire range for the selected period Settings: Zone color Fill zone: if ' false ' , then on
OVERVIEW
A Lorentzian Distance Classifier (LDC) is a Machine Learning classification algorithm capable of categorizing historical data from a multi-dimensional feature space. This indicator demonstrates how Lorentzian Classification can also be used to predict the direction of future price movements when used as the distance metric for a novel implementation of an Approximate Nearest Neighbors (ANN) algorithm. This indicator provide signal as buffer, so very easy for create EA from this in
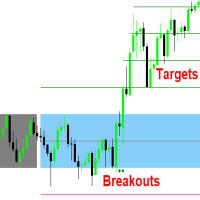
This indicator measures and displays the price range created from the first period within a new trading session, along with price breakouts from that range and targets associated with the range width. The Opening Range can be a powerful tool for making a clear distinction between ranging and trending trading days. Using a rigid structure for drawing a range, provides a consistent basis to make judgments and comparisons that will better assist the user in determining a hypothesis for the day's pr
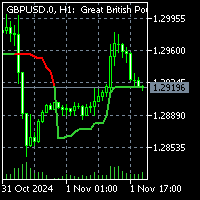
To get access to MT4 version please contact via private message. This is the exact conversion from TradingView:"ATR Trailing Stoploss" by "ceyhun" This is a light-load processing indicator. It is a non-repaint indicator. Colored Candle option is not available. Buffers are available for processing in EAs. You can message in private chat for further changes you need.

This indicator automatically draws trendlines, Fibonacci levels, support and resistance zones, and identifies BOS (Break of Structure) and CHOCH (Change of Character) patterns on the chart. Just by placing it on the graph, it handles the essential technical analysis tasks for traders, providing a streamlined, effective trading tool this tools is alway make every one easy for trading.

Supply & Demand Visible Range Indicator with Smart Alerts
Master the art of supply and demand trading with this powerful indicator that brings institutional-grade volume analysis to your charts! This sophisticated tool helps you identify key market levels where big players are active.
Key Features: - Dynamic supply and demand zone identification based on volume analysis - Smart alerts at crucial price levels (supply, demand, and mid-point zones) - Volume-weighted average calculations for

Smart Trend Suite Pro – Advanced Trend Indicator with Dashboard & Alerts Overview: Smart Trend Suite Pro is a powerful trend-detection indicator that offers traders a complete set of tools for accurate trend analysis and actionable insights. Designed for versatility and precision, Smart Trend Suite Pro adapts seamlessly to multiple timeframes and market conditions, making it suitable for various trading styles, including scalping and swing trading. Key Features: Real-Time Trend Detection: Identi
FREE

TrendFusionXplorer consists of three powerful trend-analyzing indicators — TRP , PMax and OTT — developed by Kivanc Ozbilgic. Each indicator displays the trend's support and resistance levels based on its unique properties and methodology. TrendFusionXplorer assists in determining entry and exit points for markets and can also be used for setting trailing stop-loss (SL) and take-profit (TP) levels on open positions.
Specifications
1. Trend Reversal Predictor (TRP): TRP follows Thomas R. DeM

Golden Spikes Detector Notice: Limited-Time 50% Discount on All Products Due to high interest, only a few (about 8) discounted spots remain for Golden Spikes Premium . For those interested, all my trading tools, including Golden Spikes Premium, are currently available at a 50% discount until October 30, 2024 . Feel free to take advantage while it lasts. Acknowledgement and Dedications: The name of this indicator was Inspired by an Original; Mr Grant Koopman; a Knowledgeable and experienced
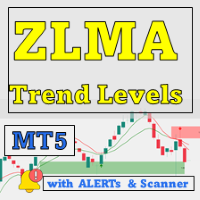
Apenas 5 cópias disponíveis por $49 – Garanta a sua antes que o preço suba para $149! O indicador Zero Lag MA Trend Levels MT5 com Scanner combina a Média Móvel de Atraso Zero (ZLMA) com uma Média Móvel Exponencial (EMA) padrão, proporcionando aos traders uma visão completa do impulso do mercado e dos níveis de preços chave. Além disso, as funcionalidades de scanner e alertas permitem aos traders acompanhar facilmente os sinais em vários pares e períodos de tempo, aumentando a capacidade de ide

Este indicador permite que você transforme a aparência do seu gráfico aplicando uma transição suave entre duas cores personalizáveis para o fundo. Esse efeito de gradiente chamativo dá ao seu gráfico uma aparência nova e moderna, tornando-o mais visualmente atraente. O gradiente é aplicado a todas as janelas de indicadores atualmente no seu gráfico quando o indicador é anexado e também afetará quaisquer novas janelas de indicadores adicionadas posteriormente. Experimente e dê um novo visual aos
FREE

O Preditor Híbrido Boltzmann-Hopfield é um indicador MetaTrader avançado que combina previsão por rede neural com análise de volatilidade para prever movimentos de preços. Exibe setas verdes para movimentos de alta previstos e setas vermelhas para movimentos de baixa. O indicador só gera sinais quando condições específicas de volatilidade são atendidas, usando ATR, volatilidade histórica e reconhecimento de padrões para filtrar previsões. Características principais: Setas preditivas para direção

Times and Sales Pro: Potencialize Suas Operações com o Fluxo de Negociações Oportunidades em Pequenos Movimentos de Preço
O Times and Sales Pro é uma ferramenta essencial para analistas que operam o fluxo de ordens a partir do Times and Trades . Ideal para scalpers, ele foi desenvolvido para quem busca aproveitar pequenas oscilações de preço com alta precisão. Com um cálculo avançado, o indicador identifica desequilíbrios nas negociações, fornecendo sinais valiosos para entradas e saíd

Apresentando o Indicador Sniper de Tendências para MetaTrader 5 (MT5) Alcance entradas precisas e maximize seus lucros com nosso indicador avançado Eleve seu trading a um novo nível com o Indicador Sniper de Tendências , uma ferramenta avançada projetada para traders que buscam precisão e profundidade em suas análises. Este poderoso indicador utiliza algoritmos matemáticos únicos para identificar as tendências mais fortes do mercado, oferecendo pontos de entrada com precisão cirúrgica que permit
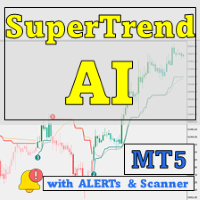
Somente 4 cópias disponíveis por $49 – Garanta a sua antes que o preço suba para $149! Descubra o poder da IA com o SuperTrend AI Clustering MT5 com Scanner , uma ferramenta revolucionária de negociação para MetaTrader 5 (MT5). Este indicador redefine a análise de mercado ao combinar o agrupamento K-means com o amplamente popular indicador SuperTrend, dando aos traders uma vantagem ao navegar por tendências e sinais. See more MT4 version at: SuperTrend AI Clustering MT4 with Scanner See more
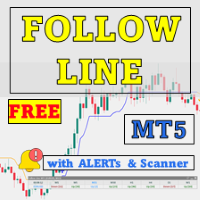
Maximize sua vantagem de negociação com o Follow Line MT5 com Scanner, um indicador avançado baseado em volatilidade, projetado para traders sérios. Esta ferramenta combina o poder das Bandas de Bollinger com configurações personalizáveis, oferecendo insights precisos sobre os movimentos de preço. See more MT4 version at: Follow Line MT4 with Scanner See more products at: https://www.mql5.com/en/users/ndhsfy/seller A chave do Follow Line é sua capacidade de detectar quando o preço ultrapassa
FREE
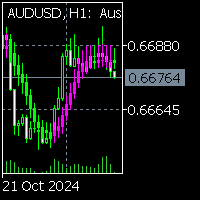
Apresentamos o Indicador de Velas de Regressão Linear para MQL5 - uma ferramenta poderosa projetada para funcionar perfeitamente em todos os instrumentos e períodos de tempo.
Este indicador avançado usa regressão linear para fornecer visualização precisa de tendências diretamente no seu gráfico de velas, ajudando os traders a identificar a direção do preço e possíveis reversões com precisão.
Quer esteja a negociar Forex, acções ou mercadorias, esta ferramenta versátil melhora a sua tomada
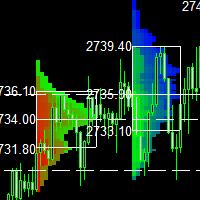
This indicator is a classic implementation of the Market Profile (Volume Profile Visible Range), allowing for the display of price density over time while highlighting the most significant price levels, the value area, and the control price within a specific trading session. MT4-version: https://www.mql5.com/en/market/product/125261
The indicator can be applied across timeframes from M1 to D1, enabling the analysis of market profiles for daily, weekly, monthly, or intraday trading. Utilizing
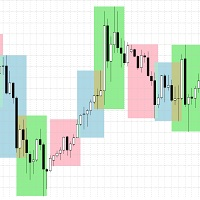
Session Boxes - Advanced Market Sessions Visualization Indicator
Overview The Session Boxes indicator is a powerful and highly customizable tool designed to help traders visualize major trading sessions directly on their charts. By clearly displaying the Asian, London, New York, Sydney, and Frankfurt sessions, traders can easily identify optimal trading times and potential market volatility periods.
Key Features
Multiple Session Support - Asian Session (Default: 00:00-09:00) - London Sess
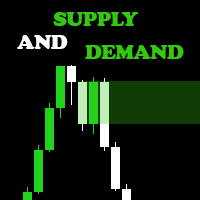
Are you ready to elevate your Forex trading game? Introducing the Supply and Demand Indicator , a powerful tool designed to help traders identify key market zones and make informed decisions with confidence! Key Features: Accurate Zone Identification : Our indicator pinpoints critical supply and demand zones, allowing you to spot potential reversal points and areas of price consolidation. User-Friendly Interface : With an intuitive design, you'll easily navigate through the settings and customiz

Description : In the world of trading, candlestick patterns are a popular technical analysis tool used by many traders. There are numerous candlestick patterns, ranging from reversal patterns to continuation patterns. However, remembering all these patterns can be challenging, especially for novice traders. This often leads to traders having to manually memorize and identify candlestick patterns, which can be time-consuming and prone to errors. Candle Pattern Pro is a powerful indicator desig

The Zero-Lag MA Trend Levels indicator combines a Zero-Lag Moving Average (ZLMA) with a standard Exponential Moving Average (EMA) to provide a dynamic view of the market trend. This indicator automatically plots the EMA and ZLMA lines on the chart. The colors of the lines represent the market trend.
With EMA: ++ green (uptrend) when EMA > zlma ++ red (downtrend) when EMA < zlma With ZLMA: ++ green (uptrend) when the line is trending up ++ red (downtrend) when the line is trending down
When
The ATR (Average True Range) Indicator is a powerful tool designed to measure market volatility. This indicator provides accurate data on price movement ranges, helping traders manage risk more effectively and make well-informed trading decisions. Based on the widely-used ATR indicator, it’s suitable for both professional and beginner traders to analyze market volatility. The ATR Indicator allows you to track the current price movement range and use this information to set stop-losses, select en
FREE
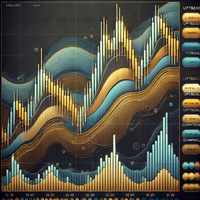
MrGoldTrend is a sophisticated trend-following indicator designed exclusively for XAUUSD (Gold) traders on the MQL5 platform. With clear, easy-to-interpret visual signals, this indicator helps you quickly identify the prevailing trend and make informed trading decisions on the H1 timeframe. MrGoldTrend’s gold lines indicate an uptrend, while blue lines signify a downtrend, providing immediate visual clarity for trend direction. Key Features: Clear Trend Visualization : Gold lines for uptrends, b
FREE

This SMT (Smart Money Technique) divergence indicator identifies discrepancies in price movement between two different trading symbols, helping traders detect potential market reversals. This tool compares the price action of two correlated assets, such as two currency pairs or indices, to spot divergences where one asset's price moves in the opposite direction of the other. For example, while one symbol may be making higher highs, the other might be making lower highs, signaling a divergence. T
FREE

Introducing Your Ultimate Trading Edge: Dynamic Support & Resistance, Advance Entry Levels Indicator for MT5 platform Unlock the power of precision trading with our cutting-edge Dynamic Support & Resistance Indicator. Designed to give traders unparalleled clarity, this indicator is your roadmap to identifying exactly where to buy and sell, maximizing your potential for consistent, sustainable profits. Why Choose Our Indicator? Crystal Clear Entry and Exit Points : No more guesswork. Our indicat

Line function - shows on the chart the lines of Opening, Stop Loss, Take Profit. With this function, it is easy to create a new order and see its additional characteristics before opening. TP and SL - sets the relationship of Take Profit to Stop Loss. This allows you to set the size of the profit relative to the loss in pips.
the opening line will appear when all conditions are met TP1, TP2, TP3, TP4 and SL are manually specified in pips. buying or selling is done at the closing price of th
FREE

This indicator combines weekly session visualization with Volume Weighted Moving Average (VWMA) analysis . It draws vertical lines at session start and horizontal lines spanning each weekly starting session , providing clear visual c ues for trading sessions. The V WMA is calculated an d displayed as a color -changing line, offering insights into price trends weighte d by volume. Users can customize session times , line colors , VWMA perio d, price
FREE
This indicator helps you monitor multiple currency pairs and timeframes all at once. It displays the occurrence of divergences between price and the MACD indicator in a clear and easy-to-read table. Monitoring multiple timeframes and currency pairs in one place helps traders identify a divergence without needing to switch between charts. Divergences can be bullish or bearish. For example, if the price forms a higher high while the MACD forms a lower high, this indicates bearish divergence. On th

The Mr. Anderson indicator was created based on the original indicators for searching for extremes, the indicator is well suited for determining a reversal or a large sharp jerk in one direction, thanks to it you will know when this happens, it will notify you by the appearance of a blue dot for buying, red for selling.
It uses the process of identifying the rate of change in price growth and allows you to find entry and exit points from the market.
a fundamental technical indicator that al

This indicator combines session visualization with Volume Weighted Moving Average (VWMA) analysis . It draws vertical lines at session start and horizontal lines spanning each session , providing clear visual c ues for trading sessions. The V WMA is calculated an d displayed as a color -changing line, offering insights into price trends weighte d by volume. Users can customize session times , line colors , VWMA perio d, price type , and volume
FREE

During volatile market conditions brokers tend to increase spread. int OnCalculate ( const int rates_total, const int prev_calculated, const datetime &time[], const double &open[], const double &high[], const double &low[], const double &close[], const long &tick_volume[], const long &volume[], const int &spread[]) { int spread_array[];
FREE
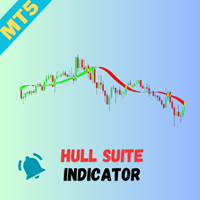
Overview
The Hull Suite is a highly responsive and smooth moving average indicator based on the Hull Moving Average (HMA), developed by Alan Hull in 2005. Known for its minimal lag and clear curves, the HMA has become a widely used technical analysis tool. This script brings together multiple Hull variations into one flexible and customizable indicator, ideal for traders looking for enhanced visual representation and trend analysis. Key Features
The Hull Suite offers three variations of the

Multi-Timeframe Fractal Indicator Description for MQL5 Introducing the Multi-Timeframe Fractal Indicator! Key Features: Multi-Timeframe Analysis: Analyze Fractals on a timeframe independent of your chart's current timeframe. Gain insights from higher timeframes for informed trading decisions. Customizable Parameters: Timeframe: Choose the timeframe on which Fractals will be calculated (e.g., Daily, H4, etc.). Number of Bars: Specify the number of bars considered around a potential Fractal for c

# Indicador MultiZigZag Pro para MetaTrader 5
O MultiZigZag Pro é um poderoso indicador técnico para a plataforma MetaTrader 5 que identifica, de forma inteligente e flexível, os principais pontos de inflexão e tendências nos gráficos de preços.
## Características principais: - Algoritmo avançado que filtra ruídos e movimentos irrelevantes do mercado - Múltiplos timeframes para análise de tendências de curto a longo prazo - Parâmetros de profundidade e desvio personalizáveis para adaptação
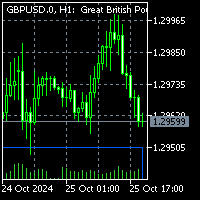
Note 1:To get access to MT4 version please contact via private message. Note 2: Multi time frame option is not available with this indicator. To order multi time frame please contact via private message. This is the exact conversion from TradingView: "Supply and Demand Visible Range by LuxAlgo". This is a light-load processing. Updates are made based on new candle open and chart updates. All input options are available except multi time frame option. Buffers are available for processing in EAs.

The first 100 units are gone for FREE! Now, grab the next 50 units at just $30 each. Act fast, because once they're gone, the price will jump to $99. Don’t wait
The *Rich Scalping* indicator is a powerful tool designed for traders who seek to maximize profits through fast-paced, short-term trading. Specifically tailored for scalping, it accurately identifies entry and exit points by detecting quick price movements and market trends.
With user-friendly signals and real-time alerts, Ric

The Simple Market Sessions Indicator helps traders visualize the current status of major forex market sessions: Asian , London , New York , and Sydney . It shows whether each market is Open , Active (based on volume) , or Closed directly on the chart. With customizable session times and a volume threshold, this tool helps traders monitor session activity and volume strength, making it easier to decide the best times to trade.
Key features: Displays status: Open, Active (High Volume), or Clos
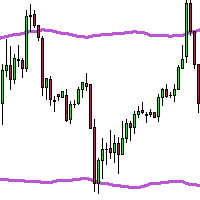
TMA & ATR Adjusted Indicator The TMA & ATR Adjusted indicator for MetaTrader 5 is a powerful tool that combines the Triangular Moving Average (TMA) with the Average True Range (ATR) to provide dynamic market insights. This advanced indicator adapts to market volatility and offers a clear visualization of trends with customizable upper and lower bands. Key Features: Triangular Moving Average (TMA): A smooth moving average that gives more weight to central data points, providing a refined trend an
O Mercado MetaTrader contém robôs de negociação e indicadores técnicos para traders, disponíveis diretamente no terminal.
O sistema de pagamento MQL5.community está disponível para todos os usuários registrados do site do MQL5.com para transações em todos os Serviços MetaTrader. Você pode depositar e sacar dinheiro usando WebMoney, PayPal ou um cartão de banco.
Você está perdendo oportunidades de negociação:
- Aplicativos de negociação gratuitos
- 8 000+ sinais para cópia
- Notícias econômicas para análise dos mercados financeiros
Registro
Login
Se você não tem uma conta, por favor registre-se
Para login e uso do site MQL5.com, você deve ativar o uso de cookies.
Ative esta opção no seu navegador, caso contrário você não poderá fazer login.