适用于MetaTrader 5的新技术指标 - 64

Классический индикатор фракталов является запаздывающим, т.к. для подтверждения образования фрактала необходимо ждать 2 бара. Если этого избежать, то индикатор будет перерисовывающим, т.е. при обновлении максимума/минимума в течении 2-х баров фрактал будет менять своё положение на более позднее. В данном продукте максимально нивелированы оба этих недостатка, при этом совмещены достоинства обоих подходов! Индикатор показывает фрактал сразу в момент его образования, а в случае его обновления показ
FREE

The VMA is an exponential moving average that adjusts its smoothing constant on the basis of market volatility. Its sensitivity grows as long as the volatility of the data increases. Based on the Chande's Momentum Oscillator, the VMA can automatically adjust its smoothing period as market conditions change, helping you to detect trend reversals and retracements much quicker and more reliable when compared to traditional moving averages.
引入 Awesome Oscillator Alert ,这是一个强大的技术指标,可为交易者提供有关市场动态和交易机会的宝贵见解。凭借其全面的功能和用户友好的界面,该指标是希望在市场上获得优势的交易者的必备工具。
Awesome Oscillator Alert 的突出特点之一是它与所有货币对和时间框架的兼容性。无论您是交易主要货币对还是外来货币,该指标都可以无缝集成到您的交易策略中。此外,用户友好的界面允许轻松自定义参数,确保您可以定制指标以满足您的个人交易偏好。
实时警报是成功交易的一个重要方面,而 Awesome Oscillator Alert 可以精确地提供它们。您将通过弹出窗口、声音和移动警报接收即时通知,让您随时了解重要的进入和退出信号。这种实时反馈使您能够及时做出交易决策并利用市场机会。
该指标提供两种可靠的交易策略:飞碟策略和零线交叉策略。飞碟策略识别直方图列中的模式,根据特定条件提供清晰的买入和卖出信号。另一方面,零线交叉策略着重于震荡指标与零线之间的相互作用,指导交易者何时进场或出场。
借助 Awesome Oscillator Ale
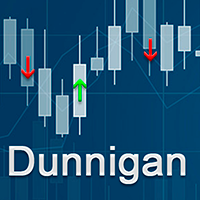
This is a trend indicator based on a strategy created by William Dunnigan that emit signals to buy or sell on any timeframe and can assist in decision making for trading on stock market or Forex. The signals are fired according to the following rules: Buy Signal = Fired at the first candlestick in which close price is higher than the higher price of the last candlestick. The higher and lower prices of the current candlestick must be higher than the corresponding ones of the last candlestick as w
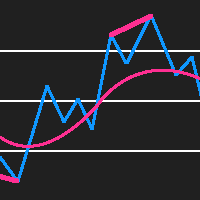
RSI Divergence Detector is an RSI indicator which also detects divergences and plots arrows and trend lines on the chart where you should buy and sell. Please note that this indicator provides 5 buffers and doesn't repaint making it an exceptional indicator for Expert Advisors. The indicator also provides alerts. Buffer 0 = RSI Buffer 1 = Buy Buffer 2 = Sell Buffer 3 = RSIGradient Buffer 4 = PriceGradient
NON REPAINTING
DIVERGENCE DETECTION

Produto Teste para testar chaves e validações. Ao instalar entre em contato. Mais informações entrar comunicação Instalando por favor revisar os testes querendo mais informações leia as instruções podendo estar errado entrar em contato Espero que este indicador auxilie nos trades dos usuários. O indicador será avaliado em outras metodologias para melhor atender
FREE

This product contains following indicators: (Lines + LineSAR + Channels + BTL + Ladder) Phi Lines - special EMAs, similar to MIMAs from Phicube; Phi LineSAR - erase and highlight Phi Lines in support or resistance. Similart to MIMASAR from Phicube; Phi Channels - show support and resistance, similar to Phibo from Phicube (Green and Read Lines); Phi BTL - candles color following Phi Lines alignment; Phi LADDER - Indicator that allow you to visualize possible targets.
FUTURO Tool Future to

PACK 2 do Phi Cubic Fractals com opção para extender os indicadores no FUTURO, para o lado direito do gráfico Este produto contem os indicadores do PACK 2 (ROC full / SAINT 8 / SAINT 17 / SAINT 34 / SAINT 72 ) + MODO FUTURO Phi ROC - indicador do tipo oscilador, semelhante ao MIMAROC, que é capaz de mostrar a direção e a força do mercado, bem como determinar o ponto de entrada ótimo; Phi SAINT - indicador do tipo oscilador, semelhante ao SANTO do Phicube, que é capaz de mostrar a direção e a
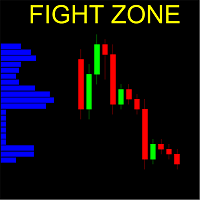
Vertical bar chart of candles!
What is it
This indicator creates a vertical bar chart of all visible candles corresponding to the amount of candles that the bars cross. The goal of this indicator is to easily check the places or regions where the candles concentrate. Those regions are a good place to place positions because they have a increased chance of staying more time there again.
It's hard to explain in words the exactly working of this indicator, we suggest you watch the video, it i

The Trade by levels for mt5 indicator is designed to automatically determine the formation of a model for entering the market on the chart of the selected instrument.
Definitions: ⦁ BFl is the bar that formed the level. ⦁ BCL1 and BCL2 bars, confirming the level.
The graphical model: ⦁ levels high\low the bars BFL and BCL1 must match the accuracy to the point ⦁ there can be any number of bars between BFL and BCL1. ⦁ between BCL1 and BCL2 interme
FREE
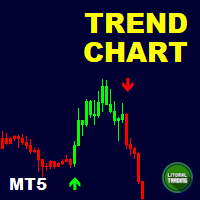
Are you the trend surfing type? Do you like to follow the big sharks? Nope? So you are the type that trades reversion? Awaiting the trend exhaustion and entering on trade?
So this indicator is for you ! With it is extremely easy to identify the trend and when it reverses because the chart is automatically colored according to a defined moving average. You can change it settings and make it your own (or hide it).
In addition it is possible to have indicative arrows on chart and also popup and
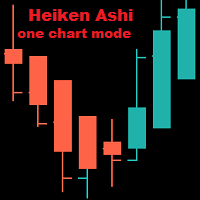
Heiken Ashi On One Chart Mode The indicator is displayed only on one of the chart modes: Bars, Candles, Line. The default is Bars. When switching the chart mode, the indicator is displayed or disappears depending on the chart mode. Input parameters: iChartMode: on what chart mode should the indicator be displayed mBars mCandles mLine Colors: LightSeaGreen: bull candle Tomato: bear candle
ZoneFinder is an indicator panel that presents an interactive, multi-timeframe visualisation of trend direction and strength. Trend strength and direction is measured using a modified ADX indicator based on smoothed DI+ and DI- values. High probability trading zones are identified using Fibonacci retracements. Where such zones are found, they are marked on the chart together with a proposed Fibonacci targets.

Candlestick Patterns MT5 is a simple and convenient indicator able to define 29 candle patterns.
Advantages Defines and highlights 29 candle patterns; Estimated trading direction is shown as an arrow; Each candlestick pattern can be disabled in the settings; The indicator can be used as an arrow indicator in EAs.
Parameters TextSize - chart text size; TextColor - chart text color; Alert - enable/disable alerts; ---------- Candlestick Patterns ------------- - settings separator; AdvanceB

Easily get all relevant economic events of the current day right into your chart, as markers. Filter what kind of markers do you want: by country (selected individually) and by Importance (High relevance, Medium, Low or any combination of these). Configure the visual cues to your liking. Additionaly you have the ability to add up to 5 personal markers of your own agenda. With Alerts and/or with blackout periods, if you are using it within an Expert Advisor! All in one Economic Calendar indicator

This indicator determines the short-term and long-term trend. The analysis is based on the selected timeframe. Indicator shows the points of opening deals for sale or purchase, and also indicates the direction of the trend at: Short term Long term
This indicator not only signals an immediate purchase or sale. It indicates short term and long term trend. The indicator allows you to examine in more detail the real and historical market trends!

Totally linked to the result of a movement and the duration he had. Its height records how many ticks the asset walked during a given movement, its width shows us the duration that movement had. Its configuration must be in line with the Weis Wave Indicator configuration to observe the movement force and can indicate a possible accumulation or distribution of the movement;
FREE
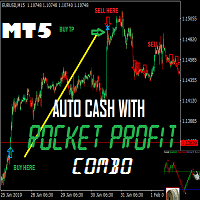
This is a great Metatrader5 Tool , which you can use Daily for your profitable Trading. The Accuracy is the best system you need to succeed in trading without stress. The signals doesn't repaint at all, alerts on bar close, and stays glued. The system works on MT5 and another version for MT4 also available.
What you get upon purchase:
-Lifetime support for the use of the system - Easy to use, clean user friendly interface with no single settings required - Arrow Signals showing where t

RSI 交叉警报 是一个功能强大的通知系统,专为在其交易策略中使用 相对强度指数 (RSI) 的交易者而设计。该指标侧重于识别 RSI 交叉,当快速 RSI 线穿过慢速 RSI 线上方或下方时发生。通过结合这些交叉点,该指标可以有效地过滤掉错误信号,让交易者做出更准确的交易决策。 RSI 交叉警报提供了几个增强其功能和可用性的关键功能。它适用于任何时间框架和交易品种,为交易者提供灵活的交易方式。该指标还拥有用户友好的参数,允许交易者根据自己的喜好和交易策略轻松定制其设置。此外,该指标可以在图表上绘制之前的信号,使交易者能够分析历史交叉模式。 为确保交易者不错过重要的交易机会,RSI Crossover Alert 包含一个快速通知系统。该系统提供及时的弹出消息提醒,让交易者了解潜在的 RSI 交叉和信号机会。通过及时收到这些警报,交易者可以立即采取行动并利用有利的市场条件。 该指标的参数设置包括调整快速RSI周期、慢速RSI周期、RSI应用价格、起始蜡烛指数、历史计算周期、箭头距离、买入箭头字符、卖出箭头字符、买入颜色、卖出颜色和警报重置周期的选项.交易者可以微调这些参数以符合他们个

Ez 通道 指标是趋势跟踪交易者的重要工具,因为它会自动识别图表中的真实趋势通道。使用此指标,您不再需要花费数小时在图表上手动绘制趋势线。它可以为任何交易品种和时间框架快速绘制趋势通道,从而节省您的时间和精力。 Ez Channel 的主要功能之一是其迷你控制面板,可让您根据自己的喜好轻松调整时间段。此控制面板还使您能够在新的市场变动发生变化之前保存已识别的渠道。此功能确保您可以轻松跟踪和分析市场趋势,而无需重新绘制趋势线。 Ez Channel适用于所有交易品种和时间范围,使其用途广泛,适用于各种交易策略。它为您提供了保存已识别频道以供将来使用的便利,并且您可以在任何时间范围内查看这些已保存的频道。此功能允许您比较和分析不同时间范围内的趋势,从而增强您的交易决策过程。 无论您是经验丰富的交易员还是新手,Ez Channel 都提供用户友好的界面和易于调整的参数。它旨在简化趋势跟踪策略,让您轻松跟踪趋势并做出明智的交易决策。该指标在识别趋势通道方面的准确性和可靠性有助于其作为交易工具的有效性。 凭借其强大的功能和用户友好的设计,Ez Channel 是任何想要最大化其趋势跟踪策略的交易
Smart Breakout Indicator determines support and resistance levels and also shows the breakout points of the levels in the form of a histogram.
The program contains two indicators in one: 1-support and resistance lines, 2-histogram indicator based on high price fluctuations. The indicator autonomously calculates the best support and resistance levels and also in the form of a histogram shows the best moments of the breakdown of the lines.
The histogram indicator is based on the action of p

我们的目标是提供无障碍和高质量的服务,使市场参与者、交易员和分析师都能获得及时的市场行情的交易决策所需的市场观察指标。 这是最优化,高度稳健和易于使用的动态趋势分析指标。 DYJ市场观察指标试图用两种不同的方法来衡量市场的看涨和看跌力量,每种方法都有一种。
该指标的熊市指数尝试衡量市场对价格下降趋势。
该指标的牛市指数尝试衡量市场对价格上涨趋势。
Pivot是市场观察指标的额外指标。Pivot含有6种策略:经典,卡玛瑞拉,无敌,斐波纳奇,网络布局,黄金分割. 另外点评里,采用多个辅助指标RSI,MACD,MA,布林带等过滤假信号. 我们的Pivot指标是基于先进的算法计算支点和支持和阻力水平。
它们对未来重要的价格水平和可能的市场逆转做出难以置信的准确预测。
适用于所有市场(外汇、大宗商品、股票、指数和其他)和时间框架。
特点: 同时监视所有对。 默认情况下,指标监视报价窗口的全部货币对。 它只从一个图(m1到mn)运行。 参数: inplanguage=english -- 英语或中文 inEntryPercent=Mid_70 -- 趋势百分比要求70%或

The indicator monitors the market trend, ignoring sharp fluctuations in the market and noise around the average price. Shows points for entering the market, points of potential market reversal. The indicator implements a kind of technical analysis based on the idea that the market is cyclical in nature. The indicator can be used both for pipsing on small periods, and for long-term trading.

Hello, pleasure to welcome you here, my name is Guilherme Santos. QB Indicator is the best indicator with easy to setup built-in RSI, truly a powerful tool! Basically its concept is to indicate entries in regions of market exhaustion. Just attach it with the default settings on any currency pair and watch the magic happen. Also try and other timeframes like M1 and M15. Some settings available: RSI Period RSI Overbought Limit RSI Oversold Limit when to buy When the indicator sets a green arrow on

Despite the popularity of inside bar pattern among the traders, using it as a standalone signal doesn't provide any edge in the market.
KT Inside Bar Advanced indicator solves this problem by combining the classic inside bar pattern with the "ECE" cycle and Fibonacci extensions. Using this indicator in place of our classic inside bar indicator will provide a tremendous advantage and edge in the market.
What is the ECE cycle?
In financial markets, the price never moves in a straight line bu

Divergence is one of the vital signals that depicts the upcoming price reversal in the market. KT Stoch Divergence shows the regular and hidden divergences build between the price and stochastic oscillator.
Limitations of KT Stoch Divergence
Using the Stochastic divergence as a standalone entry signal can be risky. Every divergence can't be interpreted as a strong reversal signal. For better results, try to combine it with price action and trend direction.
Features
Marks regular and hidde

The indicator displays volume clusters or volume profiles to choose from. For trading symbols which contain the tape of deals, the indicator can perform calculations based on the tape of deals.
Input variables
StepPoint - cluster step in points, if the value is zero, the step is assigned automatically. HistoryTicks - size of tick history (for VolumeType in the mode TimeAndSales). AssociatedTimeframe - binding the indicator to the specified timeframe of the chart, if the value is equal to

缠中说禅 MACD 指标 四色双线MACD 显示柱子的面积的和 InpFastMA=12; // Fast EMA period InpSlowMA=26; // Slow EMA period InpSignalMA=9; // Signal SMA period InpAppliedPrice=PRICE_CLOSE;// Applied price InpMaMethod=MODE_EMA; //Ma_Method input bool ChArea= false; //chzhshch Area Fast EMA period 快线参数 Slow EMA period 慢线参数 Signal SMA period 信号线参数 应用价格 可选
缠论里面定义的趋势力度的对比,2段趋势进行对比,对比柱子面积的和 本指标计算了相应面积的和方便对比
该指标属于“随机”类别。我试图尽可能地简化指标控制,因此输入参数中显示了最小设置:这是信号箭头图标的选择。 “Buy”信号用' Buy Arrow code '参数编码,“Sell”信号用' Sell Arrow code '参数编码。信号的信号箭头代码(请使用 32 到 255 的值)取自 Wingdings 字体。 该指标适用于每个价格变动并在当前柱上搜索信号(当前柱是图表上最右边的柱),因此当信号在当前柱上出现和消失时可能出现这种情况。了解此属性后,如果您想接收早期信号,您可以使用来自当前柱线的信号。但与此同时,这将是一个风险更大的交易。如果您使用来自前一根柱线的信号,则此类交易将更加安全。 在版本 2 中,信号搜索算法已更改 - 版本 2 切断了一些错误信号。

Индикатор Coefficient Of Determination (COD) представляет собой значение коэффициента детерминации или квадрат коэффициента корреляции между зависимой переменной — ценой и объясняющей переменной — тиковым объемом. Что это дает нам на практике? COD отлично распознает кульминацию трендовых движений, что позволяет подбирать оптимальные точки и ловить развороты рынка. Как использовать индикатор: Наиболее популярная торговая стратегия строится совместно с трендовым индикатором Moving Average (MA), пе

O GRIDBOT WIM robô de investimento para Mini Índice.
Parametrizado com grade linear ou zona de expansão (FIMATHE).
CONFIGURAÇÕES: Ponto de entrada Pivot dia anterior double r1 = pivot + distance; double r2 = r1 + distance; double r3 = r2 + distance; double r4 = r3 + distance; double r5 = r4 + distance; double r6 = r5 + distance; double r7 = r6 + distance; double r8 = r7 + distance; double r9 = r8 + distance; double r10 = r9 + distance; double s1 = pivot

For any trader, the result of market analysis is the correct determination of entry and exit points from the market. The ClearArrows indicator does not display any unnecessary information that may distract or mislead the trader, but only the most important thing. The indicator is very easy to use, when a down arrow appears, you need to open a SELL deal, when an up arrow appears you need to open a BUY deal.
The ClearArrows indicator, despite its outward simplicity, has a large analytical algor

MOON 4 TREND COLORS: is a Tren indicator. I s a powerful indicator of TREND for any par and any timeframe. It doesn't requires any additional indicators for the trading setup.The indicator gives clear signals about opening and closing trades, PAINTING THE CANDLES OF COLOR IN FUNCTION OF THE SENSE OF TREND .This Indicator is a unique, high quality and affordable trading tool.
Perfect For New Traders And Expert Traders Low risk entries. For MT5 Only Great For Scalping Great For Swing Trad

Candlestick patterns
The candlestick Pattern Indicator and Scanner is designed to be a complete aid tool for discretionary traders to find and analyze charts from powerful candle patterns. Recognized Patterns:
Hammer Shooting star Bearish Engulfing Bullish Engulfing Doji Marubozu
Scanner Imagine if you could look at all the market assets in all timeframes looking for candlestick signals.

Using this indicator is very simple, since the simplest is to look at the chart and act according to the color arrows.
When calculating this indicator, the logarithmic gains are first calculated at the closing price, which allows you to filter out the trend, seasonality and other inclusions that spoil the volatility picture, then the standard square deviation is constructed from the data obtained.
Such a calculation option takes into account intraday price fluctuations and focuses on measur
This is an indicator that highlights the price range, specifically in the morning. So it is very easy to identify when these zones are broken, giving you an excellent entry opportunity! Range Breakout works on all symbols and timeframes. It displays past price regions and projects the current one. If you find any bug or have any suggestion, please, contact us. Enjoy!
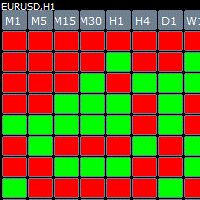
Cube indicator represents the original candle stick chart but in a top down cube form in order to see previous patterns in the markets more easy. The indicator has build in alert once there is a consecutive 3,4,5 bars in a row you get an message.
Parameters Bars_Limit = total visible cubes
TF_M1 = true; TF_M2 = false; TF_M3 = false; TF_M4 = false; TF_M5 = true; TF_M6 = false; TF_M10 = false; TF_M12 = false; TF_M15 = true; TF_M20 = false; TF_M30 = true; TF_H1 = true; TF_H2 = false; TF_H
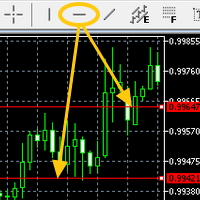
Attach the indicator on the chart and draw the red line from the button on MT5's built-in menu bar then the alert will be sent to you(push,email,popup and sound)
Hi You all know the red line (the MT5 built-in red line) drawn from the menu bar on MT5. It is often used to check the resistance etc.....It is very useful but it is little troublesome to get an alert(sound, push, email and popup) when the red line is touched by the price. Here is Price Touch Alert indication, just use the button t

Consolidation Finder An indicator that allows you to find consolidation. To work on the breakdown of the channel. Easy to use, there are only three settings: Minimum number of bars to analyze Tunnel Consolidation Indicator color It works on all timeframes , by default, approximate settings for the H1 timeframe are set. Works on all currency pairs. The indicator is not redrawn or recalculated. All screenshots are real!
Candle Pattern Alert indicator alerts when the last price closed candle matches the set input parameters. You can choose to scan through all the symbols in Market Watch or enter your favorite symbols and also you can enter time frames you need to scan. ---------Main settings-------- Select all symbols from Market Watch? - if Yes the program scans through all the symbols displayed in Market Watch, if No - only selected in next input symbols are scanned
Enter symbols separated by commas - enter s

Вертикальная гистограмма объема - отображает распределение объема по уровням. Гистограмма рассчитывается от объема ( реального или тикового), при этом объем соответствующий бару переносится на уровень H-L бара.
Таким образом, при распределении объема за сутки по вертикали - формируются максимумы гистограммы показывающие области проторговки. Настройки индикатора: Timeframe Set - период в пределах которого производится расчет. (рекомендуется D1) Step's - количество отображаемых периодов. Amplit
KT Round Numbers plots the round number levels which are also commonly known as psychological levels in the Forex world. In the context of Forex trading, round number levels are those levels in which there are two or more zeroes at the end. They are named as 00 levels on the chart.
Some traders also consider the halfway points as a valid round number level. They are named as 50 levels on the chart.
Use of round number levels in trading Round number levels work as strong support and resistan

Best Scalper Oscillator is an indicator for MetaTrader 5 based on mathematical calculations on the price chart. This is one of the most common and useful indicators for finding the trend reversal points. Best Scalper Oscillator is equipped with multiple types of notification (push notifications, emails, alerts), which allows opening trades in time.
Distinctive features Generates minimum false signals. Excellent for identifying trend reversals. Perfect for scalping. Suitable for working on t

Indicator designed to give investors the advantage of identifying strong candlestick patterns in real time by staining candlesticks representing these patterns, using possible buy or sell performance. The color for each pattern identified by the parameter indicator according to your taste. The candlestick patterns identified by this indicator are: Inside Bar Closing Price Reverse Top (PFRA)
Closing Price Reverse Bottom (PFRB) Dave Landry Bullish Engulf Bearish Engulf Advantages: Real Time At ea

This indicator draws regular bullish and bearish divergences in real-time onto the charts. The algorithm to detect those divergences is based on my 10+ years experience of detecting divergences visually. The divergences are drawn as green and red rectangles on the charts. You can even do forward testing in the visual mode of the strategy tester. This FREE Version is restricted to EURUSD and GBPUSD. The full version without restrictions is here: https://www.mql5.com/en/market/product/42758
Par
FREE

This indicator draws regular bullish and bearish divergences in real-time onto the charts. The algorithm to detect those divergences is based on my 10+ years experience of detecting divergences visually. The divergences are drawn as green and red rectangles on the charts. You can even do forward testing in the visual mode of the strategy tester.
Parameters Fast EMA Period: The period of the fast EMA of the MACD. Default value is 12.
Slow EMA Period: The period of the slow EMA of the MACD. Def

This is a multicurrency and multitimeframe indicator that calculates the angle between two points. Points for measuring the angle can be taken from the ZigZag (the last two points), or from the Moving Average (between two given bars), or it can be the closing prices of bars.
Angle measurement is possible in degrees or in radians. You can select the scale for the calculation. For a better understanding of the indicator, you can study the free Angle High Low indicator. In the parameters you can

Trailing Uses Standard Deviation.
A daptive_Trailing_uses_StdDev_Indicator is an indicator of directional movement that allows you to identify a trend at the time of its inception and set the levels of a protective stop.
Unlike trailing with a constant distance, the indicator uses the distance to the price proportional to the current standard deviation of StdDev. The distance is equal to the product of the standard deviation and the constant coefficient set by the user.
Thus, the traili

Navigators is a great tool for detecting peaks and valleys on a chart. This indicator uses a modified peak and trough detection algorithm. This algorithm includes the Fractals indicator and the ZigZag indicator.
This tool should be used to analyze peaks and valleys, as well as to detect patterns, or for other purposes. You can use this powerful tool for your own purposes at your own risk.
Using this indicator, you can anticipate the future price behavior of a certain number of bars. The indicator draws a line showing simulated future price values. You can use this information both for entering / exiting the market. So for the installation / correction of stops accompanying the position.
The indicator has several parameters. HistoricBars - The number of historical bars to analyze. FutureBars - The number of bars to predict the price. Prediction - prediction depth coefficient.
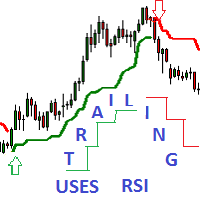
Adaptive Trailing uses RSI Indicator - an indicator of directional movement that allows you to determine the trend at the time of its inception and set the levels of a protective stop.
Trailing can be carried out both from below, when the stop level is below the current price and is pulled up behind the price if it increases, and above, when stop levels are above the current price.
There are two modes for calculating the stop level. Simple trailing is done with a constant distance of Npoint

KT MA Crossover draws the buy and sell arrows based on the crossover of chosen moving averages. Moreover, it also generates the appropriate alerts and displays the MFE (Most Favorable Excursion) for each successive signal. The moving average crossover is one of the primary strategies followed by traders around the world. Usually, it consists of a fast and slow moving average to find a buy and sell entry signal according to the crossover direction. Buy signal - when fast MA crosses above the slo

Появилось желание торговать движение, пробой на самой высокой волатильности, или запустить советника-усреднителя торговать боковик в тихой низковолатильной гавани тогда этот продукт для Вас! Индикатор анализирует 28 валютных пар (основные и кроссы) и в зависимости от выбранных настроек покажет самые высоковолатильные (max) или наоборот (min). Как измерить волатильность? Существует 2 способа. Первый это измерить рендж заданного количества последних баров (bar). Второй замерить

KT CCI Divergence shows the regular and hidden divergence created between the price and CCI oscillator. Divergence is one of the vital signals that depicts the upcoming price reversal in the market. Manually spotting the divergence between price and CCI can be a hectic and ambiguous task.
Limitations of KT CCI Divergence
Using the CCI divergence as a standalone entry signal can be risky. Every divergence can't be interpreted as a strong reversal signal. For better results, try to combine it

KT Heiken Ashi Smoothed is a smoothed version of the standard Heiken Ashi. Moreover, it also plots buy/sell arrows on a trend change. A buy arrow is plotted when it change to a bullish state from bearish state. A sell arrow is plotted when it change to a bearish state from bullish state. Mobile notifications, Email, Sound and Pop-up alerts included.
What exactly is Heiken Ashi Smoothed? It filters out the false signals and noise in the standard Heiken Ashi. It applies the set of two moving a

趋势线PRO指标是一个独立的交易策略。 它显示趋势变化,交易的入口点,以及自动计算三个级别的止盈和止损保护 Trend Line PRO非常适合所有元交易者符号:货币,金属,加密货币,股票和指数 趋势线专业的优点 永远不要重绘它的信号; 将其作为独立策略的可能性; 它有三个自动水平止盈和止损水平 该指标具有iCustom信号缓冲区,允许您基于它创建交易机器人 具有通知功能 该指标已证明其在真实账户交易中的有效性
如何设置和优化趋势线PRO指标: 我有振幅参数和TP和SL水平专注于指标面板上的利润 详细说明(ENG): 这里
趋势线PRO指标如何工作: 在指示信号以向上或向下箭头的形式出现后,等待信号形成的当前蜡烛的结束 在同一方向开仓(最多可以同时开3个订单,不同级别的止盈保护) 设置指标建议的止损和止盈水平 在价格达到第一个保护级别TP1后,关闭第一个订单,并在进入价格(盈亏平衡)的水平移动止损, 将利润部分或全部固定在TP2或TP3上 使用趋势线专业的专家顾问. 金鹰,趋势线革命,趋势线EA你可以在这里找到: https://www.mql5.com/zh/users/n
FREE

在做出交易决策时,不仅要依赖历史数据,而且还要依赖当前的市场状况,这很有用。为了使监视市场趋势的当前趋势更加方便,可以使用AIS Current Price Filter指示器。 该指标仅考虑一个方向或另一个方向上最重要的价格变化。因此,可以预测近期内的短期趋势-无论当前市场形势如何发展,当前价格迟早都会越过该指标的界限。从交易者的角度来看,最有趣的是价格已经尽可能远离指标水平的情况。这些时刻对于打开新的交易头寸可能是最理想的。 指标的操作不取决于所选的时间范围,而是使用两个参数进行配置。 FS -可以用来设置灵敏度阈值的参数。它越大,价格移动就应该越强,以便在指标中将其考虑在内。其可接受的值在0-255的范围内。如果选择零值,则灵敏度阈值将等于电流范围。 LB -设置在指标计算中使用的背景深度。此参数的有效值也在0到255的范围内。如果它等于零,则将考虑所有具有自学习控制的历史数据。并且,如果此参数等于1,则指标将仅标记FS参数指定的价格偏差。 其余参数使您可以配置图表上指标的显示。 Width -设置单个指示器线的粗细。 Color -指标线的颜色。 Style -指标显示样式。

指标MTF Qristalium箭头是一个半自动交易系统。 它适用于所有货币对。
该指标使用三条规则:1)我们只交易趋势,2)"当每个人都卖出卖出,当每个人都买入卖出",3)价格总是违背人群。
指标MTF使用内置指标在多个时间范围内使用Qristalium箭头过滤规则。 如果趋势与所选时间间隔匹配,则指标将显示一个进入市场的箭头。 然后你自己做决定。 买-绿箭,卖-红箭头。 在指标中,您可以更改批次,设置EA的交易时间和关闭时间。 您还可以更改工作时间段和时间筛选器。 有一个蜂鸣声。 建议的工作周期D1。 滤波器H1和H4。 设置: TF-工作期间(建议D1) CCI_Period CCI等级提升 CCI级别Dn CCI价格 SAR步骤 SAR最大值 TF Filter1-(推荐H1) TF Filter2-(推荐H4) 工作时间 声音使用 MaxBars

This indicator will show a vertical representation of the volume distribution within a selected user range.
This is a free version of the full product. It is limited to use on a week old data or older. Find the full product at https://www.mql5.com/en/market/product/42234 .
Main features: This Indicator will create an image that will allow viewing the tick volume per price level in a graphical form. The indicator will work on any range size in any time-frame, limited only by your computer m
FREE

Indicator SR levels true in small time frames is very useful for scalping while in bigger ones it is good for day or position trading.
SR levels true can draw 4 support/resistance levels based on defined maximum rebouds from price level. Indicator scans defined number of bars in time axis and defined number of pips in price axis (both sides - up and down) and calculates how much times price was rejected from scanned price levels. At the price levels where maximum rebounds are counted, support
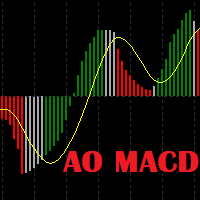
Awesome Oscillator Moving Average Convergence/Divergence Indicator. Not late as AO and not noisy as MACD. The basic version of the indicator is presented. The "PRO" version is under development with such features as sending signals to e-mail and plotting divergence and convergence lines on the chart.
Input parameters: Fast: short EMA Slow: long EMA Signal: signal line Colors: Red: MACD < Signal Green: MACD > Signal Gray: MACD above Signal, but lower than the previous MACD MACD below Signal, bu

The Relative Strength Index (RSI), developed by J. Welles Wilder, is a momentum oscillator that measures the speed and change of price movements. The RSI oscillates between zero and 100. We have added to the reputable RSI indicator several types of alerts and a signal interval filter to be incorporated in your Expert Advisors. It works in ALL Timeframes ans instruments.
Product Features Email Alert Sound alert Push Notification (Alerts can be sent to your mobile phone) Signs on chart Aler

Shadow Height mt5 阴影指示器。
将烛台阴影的大小(以点为单位)显示为直方图。在两种模式下工作,用户可选择。 指标设置说明 Mode - 指标操作模式,两种模式:第一种高度 - 上下烛台阴影的显示模式;第二个区别是显示烛台阴影差异的模式,上下烛台阴影之间的差异。 Shadow Height mt5 阴影指示器。
将烛台阴影的大小(以点为单位)显示为直方图。在两种模式下工作,用户可选择。 指标设置说明 Mode - 指标操作模式,两种模式:第一种高度 - 上下烛台阴影的显示模式;第二个区别是显示烛台阴影差异的模式,上下烛台阴影之间的差异。 阴影指示器。
将烛台阴影的大小(以点为单位)显示为直方图。在两种模式下工作,用户可选择。 指标设置说明 Mode - 指标操作模式,两种模式:第一种高度 - 上下烛台阴影的显示模式;第二个区别是显示烛台阴影差异的模式,上下烛台阴影之间的差异。
FREE

可持续的分配可用于平滑财务系列。由于可以使用相当深的历史来计算分布参数,因此在某些情况下,与其他方法相比,这种平滑甚至更有效。
该图显示了H1时间框架内EUR-USD货币对的开盘价分布十年的示例(图1)。看起来很迷人,不是吗?
该指标的主要思想是通过价格分散来确定可持续分配的参数,然后使用这些数据来平滑财务序列。由于这种方法,在给定的市场情况下,平滑后的值将趋于最可能的价格值。
使用参数LB组态指示器的操作。它的值确定平滑序列的长度,以巴表示。允许值在1-255的范围内。
蓝线表示平滑的高价,红线表示低价,绿线表示收盘价。
该指标的主要缺点是无法设置平滑窗口的宽度,因此指标在历史记录的所有部分中均保持稳定。因此,交易者必须根据其特定要求选择参数。

This indicator will show a vertical representation of the volume distribution within a selected user range. For a free demo version go to https://www.mql5.com/en/market/product/42482 . Main features: This Indicator will create an image that will allow viewing the tick volume per price level in a graphical form. The indicator will work on any range size in any time-frame, limited only by your computer memory and performance. Recommended time-frames are: M1 to H1.
Inputs:
Price Calculated -

Moon 3 is a Trend indicator. I s a powerful indicator of TREND for any par and any timeframe. It doesn't requires any additional indicators for the trading setup.The indicator gives clear signals about opening and closing trades.This Indicator is a unique, high quality and affordable trading tool.
Perfect For New Traders And Expert Traders Low risk entries. Never repaints signal. Never backpaints signal. Never recalculates signal. For MT5 Only Great For Scalping Great For Swing Trading Arro

Several assets in several markets have the behavior of using specific numbers as Force Numbers, where support, resistance and price thrust is created. Let this indicator draw those levels of support and resistance for you. You can also stack it to show different level of Prices! This technique is being used by Tape Readers and Order Flow traders all over the world for a long time. Give it a try. Challenge yourself to study new ways of Price Action!
SETTINGS
What Price reference to use in th
FREE

Простой индикатор, показывающий цены Bid и Ask. Есть настройки отображения информации и возможность перетаскивать панель. Индикатор используется для наглядного отображения цен покупки и продажи актива.
Входные параметры : Support - Ссылка, на помощь проекту heigth - Высота формы width - Ширина формы size - Размер текста bidcol - Цвет текста bid askcol - Цвет текста
FREE

Easily get all relevant economic events of the current day right into your chart, as markers. Filter what kind of markers do you want: by country (selected individually) and by Importance (High relevance, Medium, Low or any combination of these). Configure the visual cues to your liking. If there is more than one event set to the very same time, their Names will be stacked and you will see the messages merged with the plus (+) sign on the marker. Obviously that long or too much events on the sam
FREE
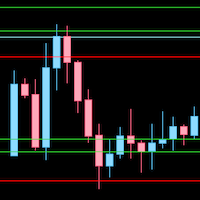
Draw levels of support and resistance based on highs/lows or closes from daily, weekly or monthly. This indicator uses the highs, lows or closes to draw horizontal lines on the graph. By observing those lines you can identify trend (gaining or losing levels of resistence/support) and find good levels where price can bounce. For those who trade price action, this is a very useful indicator.
MetaTrader市场提供了一个方便,安全的购买MetaTrader平台应用程序的场所。直接从您的程序端免费下载EA交易和指标的试用版在测试策略中进行测试。
在不同模式下测试应用程序来监视性能和为您想要使用MQL5.community支付系统的产品进行付款。
您错过了交易机会:
- 免费交易应用程序
- 8,000+信号可供复制
- 探索金融市场的经济新闻
注册
登录