适用于MetaTrader 5的新技术指标 - 22
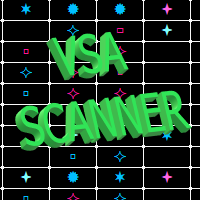
The VSA Scanner Dashboard is a multi-symbol, multi-timeframe scanner that displays VSA signals. It is based on the Volume Plus and VSA Signals indicator. Features Displays the VSA signal of the last closed candle. Monitors 28 customizable instruments (symbols) and up to 21 timeframes at the same time. Easily arrange symbols in any order. Each signal has a tooltip that displays the name and time of appearance. Click on each signal to open a new chart. All types of alerts (sound, pop-up, email,
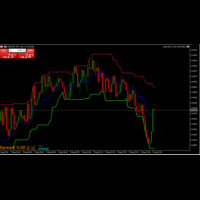
The Donchian Channel Indicator I created is a powerful tool for analyzing price trends and volatility. By plotting the highest high and lowest low over a specified period, it helps identify potential breakout opportunities and trend reversals. This indicator is valuable for traders seeking to understand market dynamics and make informed decisions based on price movements. Its simplicity and effectiveness make it an essential addition to any trading strategy.
FREE
您可以在趨勢跟隨中使用該指標來檢測趨勢變化。每個顏色變化都是交易信號。至少應在 1 小時圖表上使用。建議在 1 天圖表上使用。但是,應該注意的是,您的圖表上有意義的蠟燭(無缺口)數量至少應為 80。
計算方法基於 ATR、MA 和 CCI 指標。但是,對於計算的重要部分,我開發了一種基於標準偏差和回歸分析的算法。
您可以在外匯和期貨交易中使用該指標。我建議不要在預設設定以外的任何設定下使用它。
它可以與交易策略中的其他趨勢指標和動力指標一起使用。它可以單獨用作信號提供者,但也可以用作其他指標所提供信號的確認。
商品市場絕對不應在小於 4 小時圖的時間框架上使用。不應在極度波動的市場中使用. Thanks for your....

Fractals Aydmaxx 2024 Overview: Fractals Aydmaxx 2024 is a custom indicator designed for the MQL5 trading platform, developed by Aydmaxx. This indicator identifies and displays fractal patterns on your trading chart, which are essential for recognizing potential market reversals. The indicator highlights both bull and bear fractals, making it easier for traders to spot key levels of support and resistance. Features: Customizable Fractals: Allows the user to set the number of bars on the left and
FREE
Darvas Flow Indicator is a revolutionary trading indicator that combines the classic Darvas Box method with modern market flow analysis. Developed for serious traders, Darvas Flow offers a powerful and intuitive tool for identifying trading opportunities. Key Features:
Darvas Box Method Implementation: Darvas Flow automatically identifies Darvas boxes, allowing you to see crucial support and resistance levels. This helps in pinpointing optimal entry and exit points in your trades. Dynamic Flow
FREE
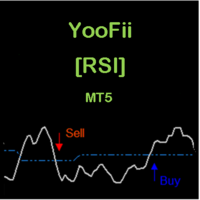
CONSTITUTION YooFii [RSI] is an indicator consisting of an oscillator and three dynamic levels. The oscillator, dynamic levels and warning signals can be adjusted via the inputs. It is designed for the MT5 platform only. APPLICATION This indicator should be used with a trend filter [for FOREX you can use the Currency Strength Meter; for CDF's you can use two moving averages (MA 200 and MA 55)]. With the trend already determined, through Yoofii [RSI] we detect points of exhaustion of correction m
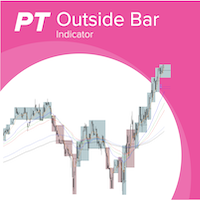
Outside bars (Außenstäbe) are important in professional price action trading and were made popular by Michael Voigt. Highs and lows of outside bars ( Aussenstäbe ) can be utilized as entry and exit for trades following different strategies. With combining different timeframes you can more easily detect the overall trend of the market, see potential resistance and support levels and also detect change in trend and framing of the market. Examples for strategies with inside bars (Innenstäbe) an

Average Session Range: Calculate and Average the Sessions High-Low Range of Specific Time Sessions Over Multiple Days. The Session Average Range is a sophisticated and precise tool designed to calculate the volatility of specific time sessions within the trading day. By meticulously analyzing the range between the high and low prices of a defined trading session over multiple days, this tool provides traders with a clear and actionable average range. **Note:** When the trading platform is closed
FREE
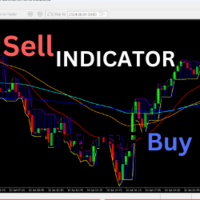
Welcome to a highly versatile and customizable trading indicator designed to elevate your trading strategy. This indicator integrates four moving averages (MAs) and order blocks, providing you with a powerful tool for market analysis and decision-making. Key Features: Four Moving Averages (MAs): This indicator allows you to utilize up to four different moving averages simultaneously. You can adjust each MA's period, color, and style to tailor the indicator to your specific trading needs. Whether
FREE
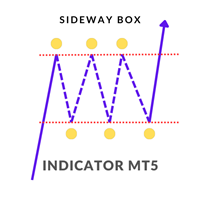
Sideway Box Indicator
The Sideway Box Indicator is an advanced trading tool designed to help traders identify and capitalize on sideways market conditions. This powerful indicator detects periods when the market is in a sideways (ranging) phase, providing traders with clear visual cues. Key Features
Sideways Market Detection : The Sideway Box Indicator accurately identifies sideways market conditions, allowing traders to recognize when the price is consolidating within a specific range. Buy/Sel

DTFX Algo Zones are auto-generated Fibonacci Retracements based on market structure shifts.
These retracement levels are intended to be used as support and resistance levels to look for price to bounce off of to confirm direction.
USAGE Figure 1 Due to the retracement levels only being generated from identified market structure shifts, the retracements are confined to only draw from areas considered more important due to the technical Break of Structure (BOS) or Change of Character (CHo

This indicator/dashboard , is place on a single symbol. It shows the percentage of movement withing all time frames from M1 to W1.The text will change green if all % are in the positive for a buy signal.The text will change red if all % are below zero and in negative for a sell signal. There are audible notifications, as well as on screen notifications along with push notifications that can be turned on and ON/OFF in the settings.
This is a sure way to Find trends quickly and efficiently, with

Introducing the BOOM CRASH MASTER Indicator: Unleash the Power of Precision Trading! Step into the world of unparalleled trading with the BOOM CRASH Master Indicator, exclusively designed for the Boom and Crash indices offered by Deriv broker. This cutting-edge tool is your gateway to mastering the art of spike detection and anti-spike entries, ensuring you stay ahead of the market’s every move. Recommendations: Symbols: Any Boom or Crash Index
Timeframe: 1 minute / 5 minutes
Stop Loss: Recent

This MQL5 Speed Indicator script calculates the average speed of price movements for a selected financial instrument over a specified period. It uses the arithmetic mean to determine the average speed, which is computed by dividing the distance (change in price) by the time interval. The indicator then displays this value as a histogram in a separate window. Average Speed Calculation : The speed is calculated using the formula v = d t v = \frac{d}{t} v = t d , where d d d is the price differen
The "Order Block Indicator for MetaTrader 5" is an advanced trading tool designed to help traders identify key order block zones in the financial markets. Order blocks are areas of institutional buying and selling, often marking significant price levels where market reversals or continuations are likely to occur. This indicator provides a visual representation of these zones directly on the chart, enabling traders to make more informed trading decisions. Key Features: Accurate Order Block Identi
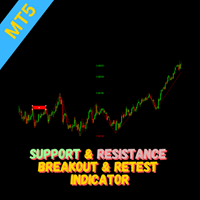
Overview The Breakout and Retest indicator is designed to identify potential trading opportunities by detecting price breakouts from significant support and resistance levels followed by a retest of the broken level. How it Works The indicator analyzes price data to determine key support and resistance areas. When the price decisively breaks through one of these levels and then retest it, then a potential breakout is signaled when it breakout again. To increase the probability of a successful t

Price and Spread Indicator
Version: 1.0 Developer: Creative Tech Solutions Website: https://www.creativetechsolutions.co.uk
Overview The Price and Spread Indicator is a great tool for MetaTrader 5 that displays the Ask and Bid prices along with the spread directly on the chart. This indicator provides real-time updates and allows traders to make informed decisions based on accurate price information.
Features - Real-time Price Updates: Continuously updates Ask and Bid prices. - Spread Disp
FREE

MT5用 サブウィンドウにスプレッドとBUY SWAP(BS)とSELL SWAP(SS)を表示するインジケーターです。
表示の文字フォントの大きさと色の設定、スプレッドの表示をPIPS表示もしくはPOINTS表示切替が可能ですので、チャートの色設定などに合わせて、お好みでご利用いただけます。 サブウィンドウの表示サイズに合わせて、その中央に表示するようになっています。
(ご協力お願いします!) こちらは無料でご利用いただけます。どうぞご自由にご利用ください。 もしよければ MS High Low indicator も紹介していますので、どうぞご参照の上、DEMO版のダウンロードをお試しください!
Happy Trading :)
FREE
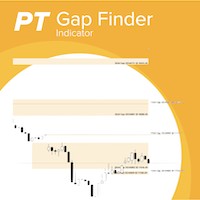
With the gaps finder indicator gaps between trading session are automatically added to you chart and you will never miss a gap which you can use in your trading strategies. Gaps often act as a magnet where the markets returns to or when a gap is closed often constitutes a reversal point.You don't have to draw manually gaps anymore. Key Features: Support for multiple trading sessions in a single chart, e.g market session and future session Configurable number of days to look back for gaps Highly

Elder Impulse Indicator Overview: The Elder Impulse Indicator is a powerful tool designed for traders who want to combine the strengths of trend-following and momentum strategies. Developed by Dr. Alexander Elder, this indicator helps traders identify potential entry and exit points by analyzing both price direction and momentum. It’s an essential tool for making informed decisions in various market conditions, whether you're trend-trading, swing trading, or looking for momentum shifts. Key Fea
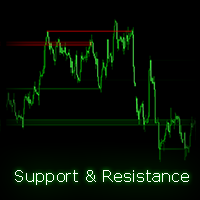
自动在您的图表上找到并绘制支撑和阻力通道(S/R),使识别关键水平变得容易。该指标支持多种时间框架,允许您在当前图表上显示来自不同时间框架的通道。此外,它还提供透明颜色以增强视觉清晰度,并让您根据自己的喜好自定义通道颜色。 该指标如何工作? 该指标在由bars lookback参数定义的范围内找到转折点(高点和低点)。转折点是价格图表上的峰值(高点)和谷值(低点),价格在这些点改变方向。它使用swing length参数来确定向前和向后查看多少个柱以识别这些点。从这些转折点中形成S/R通道,确保通道高度小于maximum channel height参数。最后,指标应用各种复杂的过滤器来选择最佳的S/R通道并将其绘制在图表上。 该指标有一个名为“Use auto value for the maximum channel height”的设置,只需将此选项设置为true(强烈推荐),您无需担心自己调整最大通道高度,指标会为您处理。 参数说明: Timeframe: 允许在当前时间框架上绘制来自不同时间框架的S/R通道。 Source : 选择是否使用收盘价或高/低价来确定摆动点。
S

The MS High Low Lines indicator is a tool designed to enhance trend visualization for MT5. It displays high and low prices as lines, using your preferred Moving Average (MA) settings (either SMA or EMA, with customizable periods). The indicator shows configured signals when prices break above or below these MAs. By setting it up with highly functional MAs, traders can better understand market trends and make trades with a statistical edge. You can modify settings and place multiple indicators o

SolarTrade Suite 金融指标:木星市场指标 - 您在金融市场世界中的可靠指南!
这是一个趋势指标,使用特殊的创新和高级算法来计算其值,并且具有令人赏心悦目的设计。
很容易理解此指标的读数:蓝色 - 买入,红色 - 卖出。
在说明底部查看我们来自 SolarTrade Suite 系列的其他产品。
您想自信地驾驭投资和金融市场的世界吗? SolarTrade Suite 金融指标:木星市场指标是一款创新软件,旨在帮助您做出明智的投资决策并增加您的利润。
SolarTrade Suite 金融指标:木星市场指标的优势:
- 准确预测:我们的指标使用先进的算法和分析方法来准确预测市场走势。
接收有关买卖资产最佳时机的信号。
- 用户友好界面:直观的界面将使您能够轻松掌握该程序并在安装后立即开始享受其好处。 您可以从设置中更改点的大小和颜色、灵敏度和速度,所有其他设置都是自动完成的。 - 专家支持:我们的专业团队随时准备为您解答任何问题并提供有关使用该程序的建议。
为什么选择 SolarTrade Suite 财务指标:木星市场指标?
- 可靠性和准确性:该

SolarTrade Suite 金融指标:土星市场指标 - 您在金融市场世界中的可靠指南!
这是一个价格通道指标,使用特殊的创新和高级算法来计算其价值,并且具有令人愉悦的设计。
理解这个指标的读数非常简单:在突破和反弹时从边界进行交易。
在描述底部查看我们来自 SolarTrade Suite 系列的其他产品。
想要自信地驾驭投资和金融市场的世界吗? SolarTrade Suite 金融指标:土星市场指标是一款创新的软件,旨在帮助您做出明智的投资决策并增加您的利润。
SolarTrade Suite 金融指标:土星市场指标的优势:
- 准确预测:我们的指标使用先进的算法和分析方法来准确预测市场走势。
获取有关买卖资产的最佳时机的信号。
- 用户友好的界面:直观的界面将使您能够轻松掌握程序并在安装后立即开始享受其好处。
您可以从设置中更改颜色,所有其他设置都是自动进行的。 - 专家支持:我们的专业团队随时准备为您解答任何问题,并为您提供有关使用该程序的建议。
为什么选择 SolarTrade Suite 财务指标:土星市场指标?
- 可靠性和准确性:该程序已被

金融指标 SolarTrade Suite:天王星市场指标 - 您在金融市场世界中的可靠指南! 我们的外汇交易程序内置了强大的人工智能,实时分析市场数据。它准确预测价格变动,帮助交易者做出明智的决策。通过先进的算法,我们的指标优化策略并将风险降到最低。 这两个移动平均线使用特殊的创新和高级算法来计算其值,并且具有令人愉悦的设计。
很容易理解这个指标的读数:蓝色 - 买入,红色 - 卖出。
颜色越亮,信号越强。
在说明底部查看我们来自 SolarTrade Suite 系列的其他产品。
您想自信地驾驭投资和金融市场的世界吗?金融指标 SolarTrade Suite:天王星市场指标是一款创新的软件,旨在帮助您做出明智的投资决策并增加您的利润。
金融指标 SolarTrade Suite:天王星市场指标的优势:
- 准确预测:我们的指标使用先进的算法和分析方法来准确预测市场走势。
获取有关买卖资产最佳时机的信号。
- 用户友好的界面:直观的界面将使您能够轻松掌握该程序并在安装后立即开始使用其优势。 您可以在设置中更改线条的颜色、粗细和样式,所有其他设置均自动完成。 - 专

金融指标 SolarTrade Suite:海王星市场指标 - 您在金融市场世界中的可靠指南! 我们的外汇交易程序内置了强大的人工智能,实时分析市场数据。它准确预测价格变动,帮助交易者做出明智的决策。通过先进的算法,我们的指标优化策略并将风险降到最低。 这是六个移动平均线,它们使用特殊的创新和高级算法来计算其值,并且具有令人愉悦的设计。
很容易理解这个指标的读数:蓝色 - 买入,红色 - 卖出。
颜色越亮,信号越强。
在说明底部查看我们来自 SolarTrade Suite 系列的其他产品。
您想自信地驾驭投资和金融市场的世界吗? 金融指标 SolarTrade Suite:海王星市场指标是一款创新的软件,旨在帮助您做出明智的投资决策并增加您的利润。
金融指标 SolarTrade Suite:海王星市场指标的优势:
- 准确预测:我们的指标使用先进的算法和分析方法来准确预测市场走势。
获取有关买卖资产最佳时机的信号。
- 用户友好的界面:直观的界面将使您能够轻松掌握该程序并在安装后立即开始使用其优势。 您可以在设置中更改线条的颜色、粗细和样式,所有其他设置均自动完成

SolarTrade Suite 金融指标:Venus Market Indicator - 您在金融市场世界中的可靠指南! 我们的外汇交易程序内置了强大的人工智能,实时分析市场数据。它准确预测价格变动,帮助交易者做出明智的决策。通过先进的算法,我们的指标优化策略并将风险降到最低。 这是一个振荡器,使用特殊的创新和高级算法来计算其值,并且具有令人赏心悦目的设计。
很容易理解此指标的读数:蓝色 - 买入,红色 - 卖出。
颜色越亮,信号越强。
在说明底部查看我们来自 SolarTrade Suite 系列的其他产品。
您想自信地驾驭投资和金融市场的世界吗? SolarTrade Suite 金融指标:Venus Market Indicator 是一款创新的软件,旨在帮助您做出明智的投资决策并增加您的利润。
SolarTrade Suite 金融指标:Venus Market Indicator 的优势:
- 准确预测:我们的指标使用先进的算法和分析方法来准确预测市场走势。
获取有关买卖资产的最佳时机的信号。
- 用户友好的界面:直观的界面将使您能够轻松掌握该程序并在安

金融指标 SolarTrade Suite:火星市场指标 - 您在金融市场世界中的可靠指南! 我们的外汇交易程序内置了强大的人工智能,实时分析市场数据。它准确预测价格变动,帮助交易者做出明智的决策。通过先进的算法,我们的指标优化策略并将风险降到最低。 这是一个振荡器,使用特殊的创新和高级算法来计算其值,并且具有令人愉悦的设计。
很容易理解这个指标的读数:蓝色 - 买入,红色 - 卖出。
颜色越亮,信号越强。
在描述底部查看我们来自 SolarTrade Suite 系列的其他产品。
您想自信地驾驭投资和金融市场的世界吗?金融指标 SolarTrade Suite:火星市场指标是一款创新的软件,旨在帮助您做出明智的投资决策并增加您的利润。
金融指标 SolarTrade Suite:火星市场指标的优势:
- 准确预测:我们的指标使用先进的算法和分析方法来准确预测市场走势。
获取有关买卖资产最佳时机的信号。
- 用户友好的界面:直观的界面将使您能够轻松掌握该程序并在安装后立即开始使用其优势。 您可以从设置中更改线条的颜色、粗细和样式,所有其他设置均自动完成。 - 专家支持
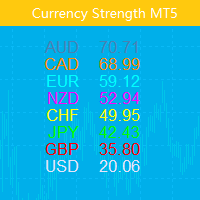
这个指标显示8个主要货币的相对强弱:USD, EUR, GBP, AUD, NZD, CAD, CHF and JPY. 强弱值规范到了 0-100之间 60以上是强。 40以下是弱.
参数 Only Show Current Pairs - 如果是true, 只显示当前图表的两个货币曲线,否则显示8个货币的曲线。 Bars To Show - 显示多数根K线 Ma Periods To Smooth Curves - 对强弱曲线做平滑处理的移动平均周期. Suffix - 品种后缀, 最新版本现在不需要填写,会自动获取 Font Size - 字体大小,默认是13. Row Space - 行距,默认是17. 下面两个参数是关于货币强弱曲线交叉的报警,八条货币曲线中,任意某两条交叉的报警功能: Select Cross at which bar - 选择交叉发送在 当前K线(Current Bar) 还是前一个K线(Previous Bar) Alert Type - 这是八选一的选项,选择交叉后报警类型. Never 意思是不报警. 其他则是交叉后报

免费下载 ,请加入我们的群组**。限时优惠!** 概述: 通过MetaTrader 5的货币强度图表一目了然地识别最强的货币。这个强大的指标提供了过去30天内主要货币相对强度的清晰可见的图表,帮助您做出更明智的交易决策。 主要特点: 30天比较分析: 比较每种主要货币在30天内的强度,帮助您发现趋势和潜在的交易机会。 视觉展示: 易于阅读的图表格式提供了直观的比较,使货币表现评估更加简洁。 可定制设置: 通过可定制的时间框架和货币对,根据您的交易需求调整图表。 实时数据: 保持更新的实时数据,确保您始终掌握最新信息。 用户友好界面: 专为初学者和有经验的交易者设计,货币强度图表直观且易于导航。 好处: 增强决策: 快速识别最强和最弱的货币,使交易计划更具策略性。 趋势识别: 发现长期趋势和短期波动,以抓住市场机会。 节省时间: 通过自动化、全面的货币强度比较,消除手动分析的需要。 如何运作: 安装指标: 将货币强度图表添加到您的MetaTrader 5平台。 选择您的货币: 选择您想要比较的主要货币对。 设置时间框架: 根据您的交易策略定制分析周期。 分析数据: 使用可视化图表评估每种

免费下载,请加入我们的群组。限时优惠! 介绍我们创新的MQL5指标,旨在通过在低时间框架上提供日烛边界的清晰视觉提示来增强您的交易体验。这个工具非常适合那些希望了解日烛进程的交易者,确保更好的决策和策略执行。 主要特点 日烛箱体可视化: 在低时间框架上绘制从日烛开始到结束的清晰框体。 明确标示日烛的起点和终点,为跟踪日市场动向提供视觉参考。 图表清晰度增强: 提供干净和有序的图表视图,帮助交易者快速识别日边界而不使屏幕变得杂乱。 提高在日交易活动背景下分析市场趋势和模式的能力。 无缝集成: 轻松集成到现有的MQL5平台设置中,快速安装并立即使用。 兼容各种低时间框架,包括M1、M5、M15、M30和H1。 自定义选项: 可调节的框体颜色和样式,以符合您的图表偏好并增强可见性。 可配置设置以满足您特定的交易需求。 优势 改进的市场分析: 通过清楚地看到日高、日低和日内价格走势,更好地了解市场行为。 利用日边界的视觉表示做出更明智的交易决策。 节省时间的工具: 节省手动图表分析的时间,专注于执行您的交易策略。 快速评估市场状况,并根据日价格变动调整您的交易。 增强的交易策略: 使用日烛箱体

VolaMetrics VSA | 技术分析中的强大助手 VolaMetrics VSA 是一种技术分析指标,结合了 Volume Spread Analysis (VSA) 方法论和详细的 交易量分析 。旨在 识别 和 跟踪重大价格变动 ,VolaMetrics VSA 利用 交易量 和 价格差 的互动,提供有价值的洞察,帮助做出交易决策。 Volume Spread Analysis (VSA) 的基础 Volume Spread Analysis (VSA) 是一种在技术分析中受到尊敬的方法,专注于理解 交易量 、 价格差(spread) 和 价格收盘 在特定时间段内的关系。VSA 基于这样一个理念,即最有信息的操盘手( 聪明的钱 )影响价格变动,通过识别 积累或分配信号 ,可以预测价格的重要变化。 VolaMetrics VSA 的工作原理 ️ VolaMetrics VSA 自动化了传统的 VSA 分析,提供了一个可靠的工具来 检测潜在的反转信号 或 趋势延续信号 。它分析 交易量 和 价格差 在多个周期中的表现,寻找可能指示重大机构活动的模式。 交易量分析

** All Symbols x All Timeframes scan just by pressing scanner button ** *** Contact me to send you instruction and add you in "Head & Shoulders Scanner group" for sharing or seeing experiences with other users. Introduction: Head and Shoulders Pattern is a very repetitive common type of price reversal patterns. The pattern appears on all time frames and can be used by all types of traders and investors. The Head and Shoulders Scanner indicator Scans All charts just by pressing

The ICT Immediate Rebalance Toolkit is a comprehensive suite of tools crafted to aid traders in pinpointing crucial trading zones and patterns within the market.
The ICT Immediate Rebalance, although frequently overlooked, emerges as one of ICT's most influential concepts, particularly when considered within a specific context. The toolkit integrates commonly used price action tools to be utilized in conjunction with the Immediate Rebalance patterns, enriching the capacity to discern conte

Candle Time CountDown By BokaroTraderFx The Candle Timer Countdown Indicator is a versatile tool designed for the MetaTrader 5 (MT5) trading platform. It provides traders with a visual countdown of the remaining time for the current candle on a chart. The key features include:
Customizable Position: Place the countdown timer in any corner of the chart for optimal visibility. Default Text Color: Set to red for clear visibility, with options for further customization. Minimal Display: Shows only
FREE

Balanced Work Indicator: Your Gateway to Trend Trading Balanced Work is a trend-following indicator designed to simplify market analysis and trading decisions. This algorithmic tool draws two-colored dots along the price chart, connected by lines, offering a clear visual representation of market trends. The simplicity of this indicator lies in its color-coded signals: buy when a blue dot appears and sell when a red dot appears. It is particularly effective for scalping and pipsing, and it has p
Amazing RSI + ATR Dashboard Indicators are useful for traders, but when you put them into a dashboard and can scan 28 symbols at once they become even better, and when you can also combine different indicators and timeframes to give you synchronized alerts they become awesome. When this product gets 20 reviews I will add another indcator free to this dashboard as a thank you. This easy to use dashboard provides you with the RSI and ATR indicators, use them individually or together to create p
FREE
Optimized for Asia- London- US- Open-Session true Momentum - time-based Indicator
Filter
Daytime Weekdays Moving Averages Keltner-Channel MACD Advantages Optimised for Asia- London- US- Open-Session choose your personal times to trade - select Daytime and Weekdays Keltner-Channel => to reduce market noise - sideways movement will be hidden 3x Moving Averages => for the Trend, including Price MACD fits best with Trend MA Candles Signal after close - no repaint Alerts
Email Screen-A
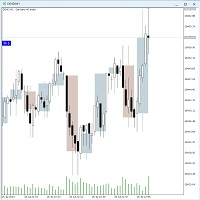
The Twotimeframe-Candles (RFrame) - Indicator for MT5 shows the candles of an higher, timeframe as an overlay on the current timeframe. You can choose the number of candles and color of the overlays. The indicator calculates the candle evevery tick. If you like the indicator, please left a comment. Version 1.1: The second time frame can now be set.
Keywords:
Candlestick, Multitimefram, Two Timeframes,
FREE
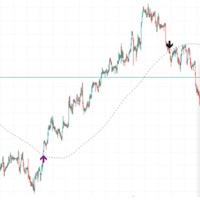
If the price is cutting above the slow length moving average, a breakout may occur. If the price is cutting below, a pullback may occur in the market. This was known for a long time, but there aren't many indicators which signal on the event. Candlestick pattern validation is also used in this indicator so that signals will not be drawn on doji candles or small "uncertainty" candles. The length of the moving average period can be defined by the user (default is 200). The number of price movement
FREE
CLICK HERE TO JOIN OUR WHATSAPP GROUP.
This trading indicator Automatically identifies and plots contract blocks, which are essential zones marked by significant levels of support and resistance. This powerful tool provides traders with a clear and intuitive visualization of critical market points where prices are likely to bounce or reverse. The contract blocks, represented by distinct colored rectangles, highlight support zones (at the bottom) and resistance zones (at the top), enabling trad
FREE
A simple indicator for plotting a tick chart.
This indicator will allow you to track the spread dynamics and the price behavior in general.
In the settings, you can select the price to display on the chart - Bid, Ask or both prices at the same time.
Tick Chart Indicator will definitely be useful when using scalping strategies. The MT4 version is available here . Good luck to everyone and successful trading!
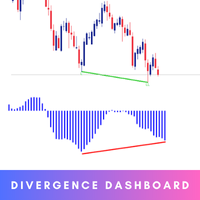
The Smart Divergence Dashboard is your ultimate tool for identifying high-probability trading opportunities. This cutting-edge indicator is meticulously designed to detect Regular Divergences, offering traders a clear and actionable advantage. MT4 Version - https://www.mql5.com/en/market/product/120702/ Key Features: Real-time Divergence Detection: Instantly pinpoints Higher High/Lower Low and Oscillator Higher Low divergences across multiple currency pairs and timeframes using Awesome Os
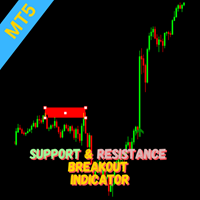
Indicator Overview This indicator utilizes the Zigzag indicator to identify potential support and resistance levels. When the price action breaks through one of these levels, a trading signal is generated. How it Works The Zigzag indicator is employed to pinpoint significant price highs and lows, forming potential support and resistance areas. A signal is triggered when the current candle closes beyond a previously established support or resistance level. Traders can consider entering a position
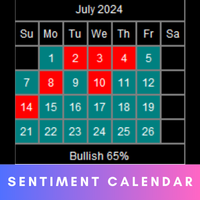
The Market Sentiment calendar provides a visual representation of market sentiment for each day or month. It will display daily and monthly BIAS . The calendar also highlights the percentage of bullish days or months within a given month or year. MT4 version - https://www.mql5.com/en/market/product/120767/ Inputs Frequency: Choose between "Daily" and "Monthly" calendar views. Sentiment Method: Select the method to determine daily or monthly sentiment: " L inear Regression ", " Accumu

The trendlines with breaks indicator return pivot point based trendlines with highlighted breakouts. Users can control the steepness of the trendlines as well as their slope calculation method.
Trendline breakouts occur in real-time and are not subject to backpainting. Trendlines can however be subject to repainting unless turned off from the user settings.
The indicator includes integrated alerts for trendline breakouts. Any valid trendlines methodology can be used with the indicator, users
Introducing the Gold Market Arrow Indicator, specifically designed for the 15-minute chart. This advanced tool provides clear and actionable buy and sell arrows, enabling traders to make timely and informed decisions in the gold market. Whether you're a seasoned trader or a novice, our indicator simplifies complex market data into straightforward signals, ensuring you never miss an opportunity to capitalize on gold price movements." This indicator works with a custom build in strategy The indic
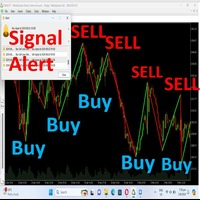
Hello Traders, *-For your bonus one indicator with SL,TP zone* just give your review, comment.Once finish developing I will give you**** Trend identification Indicator This is a indicator that will identify trend zone as bearish and bullish zone . This indicator can use for all pairs and any timeframe you can use it . *Green lime mean buy.Red line mean sell.You will receive alert sound when signal generate. The create best on high, low point and moving average calculation. You can customize valu

Description of the Indicator Trend Stop shows the highest/lowest value of the last N periods. Can help traders identify the trend direction and potential stop levels. Use Trend Stop indicator to detects the trend direction.
Downtrend if the price crosses the Trend Stop line upwards Uptrend if the price crosses the Trend Stop line downwards
Use Trend Stop indicator to define optimal stop levels. Downtrend Place your stops above the Trend Stop line Uptrend Place your stops below the Tren

Easy Fibonacci 是一个适用于 MT5 的指标,允许您轻松绘制斐波那契回撤。 特点 可在指标设置中设置多达 10 个斐波水平。 每个水平可以有不同的线条样式、线条颜色、线条宽度和其他可定制设置。 您可以使用带有额外按钮的鼠标来映射 V 和 B 键,并方便地绘制斐波那契。 按钮操作: B 和 V:在图表的可见区域绘制顶部/底部斐波那契。 N 和 M:下一个和上一个蜡烛图摆动延伸。 R:重置。 观看视频教程以获取更多详细信息。 Easy Fibonacci 是一个适用于 MT5 的指标,允许您轻松绘制斐波那契回撤。 特点 可在指标设置中设置多达 10 个斐波水平。 每个水平可以有不同的线条样式、线条颜色、线条宽度和其他可定制设置。 您可以使用带有额外按钮的鼠标来映射 V 和 B 键,并方便地绘制斐波那契。 按钮操作: B 和 V:在图表的可见区域绘制顶部/底部斐波那契。 N 和 M:下一个和上一个蜡烛图摆动延伸。 R:重置。 观看视频教程以获取更多详细信息。
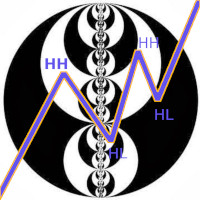
当前时间框架上的市场结构指标找到:
1. 的趋势(上升和下降波)。 在极值中断(从相反侧撤回流动性)后,波浪方向发生变化。 趋势是考虑到外部酒吧(一个外部酒吧可以有两个极端)。 趋势可以在考虑到波浪中柱线的最小数量(2个或更多)的情况下绘制。 它由QTY_bars_for_wave参数配置
2. BoS-结构的分解,沿趋势方向更新结构最小和最大值,上升-最大值更新,下降-最小值更新
3. 归纳(IDM)是结构中最后一次修正的极值点,当价格上涨时
4. 结构点(在价格达到IDM后出现)。
当前时间框架上的市场结构指标找到:
1. 的趋势(上升和下降波)。 在极值中断(从相反侧撤回流动性)后,波浪方向发生变化。 趋势是考虑到外部酒吧(一个外部酒吧可以有两个极端)。 趋势可以在考虑到波浪中柱线的最小数量(2个或更多)的情况下绘制。 它由QTY_bars_for_wave参数配置
2. BoS-结构的分解,沿趋势方向更新结构最小和最大值,上升-最大值更新,下降-最小值更新
3. 归纳(IDM)是结构中最后一次修正的极值点,当价格上涨时
4. 结构点(在价格达到IDM后出现)

基于较高时间框架的分形水平是一款功能强大的工具,旨在根据较高时间框架的分形建立准确的支撑和阻力水平,为您提供买入和卖出信号,并发出便捷的警报。
工作原理:该指标分析高级时间框架上的分形水平,并将其显示在当前图表上。您可以在指标属性中轻松调整高级时间框架,以获得最大的准确性和策略相关性。
使用基于高级时间框架的分形水平线的好处:
早期信号检测:由于可以在较低的时间框架上看到较高时间框架的分形水平,因此可以在开始时识别潜在的买入和卖出信号。 提高盈亏比:在较低的时间框架上提前进场,可以设置更短的止损,从而显著提高交易效率。 便捷的警报:绝不会错过任何重要信号--即时获得进场和出场机会的通知。 提高分析准确性:专注于真正重要的关键水平,忽略不必要的市场噪音。 使用基于更高的时间框架的分形水平指标,可以让您以全新的方式观察市场,改善您的交易结果。发现新的交易机会,以无与伦比的准确性和效率实现您的目标。

AtBot: 它是如何工作的以及如何使用它 ### 它是如何工作的 “AtBot”指标用于MT5平台,通过结合技术分析工具生成买入和卖出信号。它集成了简单移动平均线(SMA)、指数移动平均线(EMA)和平均真实波幅(ATR)指标,以识别交易机会。此外,它还可以利用Heikin Ashi蜡烛来增强信号的准确性。 购买后留下评论,您将获得特别的奖励礼物。 ### 主要特点: - 不重绘: 信号在绘制后不会改变。 - 不变动: 信号保持一致,不会被更改。 - 无延迟: 提供及时的信号,没有延迟。 - 多种时间框架: 可在任何时间框架上使用,以适应您的交易策略。 ### 操作步骤: #### 输入和设置: - firstkey (TrendValue): 调整趋势检测的灵敏度。 - Secondkey (SignalValue): 定义买入/卖出信号生成的灵敏度。 - masterkey (ExitValue): 控制信号的退出策略。 - h: 切换是否根据Heikin Ashi蜡烛生成信号(真/假)。 - notifications: 启用或禁用信号提醒。 #### ATR计算: ATR测

介绍黄金闪电剥头皮指标,这是在M1、M5和M15时间框架上剥头皮黄金的终极工具。该指标使用先进的AI神经网络开发,保证了稳定的盈利能力和卓越的交易结果。为了确保精准和高效,黄金闪电剥头皮指标在M15时间框架上提供最佳表现。 主要特点: 先进的AI神经网络: 利用尖端AI技术实现无与伦比的准确性。 无重绘: 保证信号可靠,无重绘,确保一致的表现。 多时间框架剥头皮: 针对M1、M5和M15时间框架进行优化,其中M15时间框架提供最佳结果。 全面的信号: 提供清晰的买入/卖出信号、盈利(TP)和止损(SL)水平,帮助做出明智的交易决策。 优势: 高准确性: 通过高度精确的信号实现卓越的交易成功。 实时警报: 通过即时警报和信号保持领先地位。 用户友好: 使用简便,提供清晰的说明和支持。 终身访问: 享受终身访问权限和当前版本的免费更新。 专家支持: 获得我们专家团队的终身个人支持。 使用方法: 将黄金闪电剥头皮指标安装到您的MT5平台上。 按照指标提供的买入/卖出信号进行操作。 利用TP/SL水平优化您的交易。 交易建议: 盈利(TP): 使用20至50点作为盈利目标。 止损(SL):

金融指标 SolarTrade Suite:冥王星市场指标 - 您在金融市场世界中的可靠指南!
它是一个波动率振荡器,使用特殊的创新和高级算法来计算其值,并且设计美观。
理解此指标的读数非常简单:绿色 - 低波动性和开立交易的最佳时间,橙色 - 高波动性和考虑平仓的时间。
颜色越亮,信号越强。
为方便起见,可以通过单击此指标的窗口来反转信号。
在说明底部查看我们的其他 SolarTrade Suite 产品。
您想自信地驾驭投资和金融市场的世界吗? SolarTrade Suite 金融指标:冥王星市场指标是一款创新软件,旨在帮助您做出明智的投资决策并增加您的利润。
SolarTrade Suite 金融指标:冥王星市场指标的优势:
- 准确预测:我们的指标使用先进的算法和分析方法来准确预测市场走势。 获取有关购买和出售资产的最佳时机的信号。 - 用户友好界面:直观的界面将使您能够轻松掌握程序并在安装后立即开始享受其优势。 从设置中,您可以更改线条的颜色、粗细和样式,所有其他设置均自动完成。 - 专家支持:我们的专业团队随时准备帮助您解决任何问题并提供有关使用该程序的
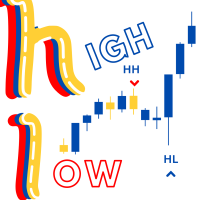
Swing High/Low Identifier Swing High/Low Identifier 是一个为 MetaTrader 5 (MT5) 设计的自定义指标,用于突出显示图表上的重要摆动点。该指标基于可配置的柱范围识别并标记高摆动和低摆动点。 高摆动点以红色箭头标记在相应的蜡烛上方。 低摆动点以蓝色箭头标记在相应的蜡烛下方。 该工具帮助交易者快速发现重要的价格水平和模式,这对于做出明智的交易决策至关重要。 有效策略 趋势反转识别: 高摆动点可以指示潜在的阻力水平,可能会开始下跌趋势。 低摆动点可以指示潜在的支撑水平,可能会开始上升趋势。 支撑和阻力分析: 使用标记的高摆动点和低摆动点绘制水平线或通道,作为关键的支撑和阻力水平。 价格行为交易: 将指标与价格行为技术(如蜡烛图模式或突破策略)结合使用,以确认在摆动点的进出点。 摆动交易: 利用高摆动点和低摆动点,根据观察到的价格摆动和潜在的反转区域确定进出点。 其他指标的确认: 使用摆动点确认其他技术指标(如移动平均线或振荡器)的信号,以增强交易信号的可靠性。 该指标提供了关键价格点的可视化表示,帮助交易者增强技术分析和决策过
FREE

金融指标 SolarTrade Suite:水星市场指标 - 您在金融市场世界中的可靠指南! 我们的外汇交易程序内置了强大的人工智能,实时分析市场数据。它准确预测价格变动,帮助交易者做出明智的决策。通过先进的算法,我们的指标优化策略并将风险降到最低。 这是一种移动平均线,使用特殊的创新和先进算法来计算其值,并且具有令人赏心悦目的设计。
理解此指标的读数非常简单:蓝色 - 买入,红色 - 卖出。
颜色越亮,信号越强。
在说明底部查看我们的其他 SolarTrade Suite 产品。
您想自信地驾驭投资和金融市场的世界吗? SolarTrade Suite 金融指标:水星市场指标是一款创新软件,旨在帮助您做出明智的投资决策并增加利润。
SolarTrade Suite 金融指标:水星市场指标的优势:
- 准确预测:我们的指标使用先进的算法和分析方法来准确预测市场走势。
获取有关买卖资产最佳时机的信号。
- 用户友好界面:直观的界面将使您能够轻松掌握该程序并在安装后立即开始享受其好处。 您可以从设置中更改线条的颜色、粗细和样式,所有其他设置均自动完成。 - 专家支持:我们

金融指标 SolarTrade Suite:地球市场指标 - 您在金融市场世界中的可靠指南! 我们的外汇交易程序内置了强大的人工智能,实时分析市场数据。它准确预测价格变动,帮助交易者做出明智的决策。通过先进的算法,我们的指标优化策略并将风险降到最低。 这是标准灰色日本蜡烛图的替代品,它使用特殊的创新和先进算法来计算其价值,并且设计令人赏心悦目。
理解此指标的读数非常简单:蓝色 - 买入,红色 - 卖出。
颜色越亮,信号越强。
在说明底部查看我们的其他 SolarTrade Suite 产品。
您想自信地驾驭投资和金融市场的世界吗? SolarTrade Suite 金融指标:地球市场指标是一款创新软件,旨在帮助您做出明智的投资决策并增加利润。
SolarTrade Suite:地球市场指标的优势:
- 准确预测:我们的指标使用先进的算法和分析方法来准确预测市场走势。
获取有关买卖资产最佳时机的信号。
- 用户友好界面:直观的界面将使您能够轻松掌握该程序并在安装后立即开始享受其好处。 您可以从设置中更改颜色,所有其他设置均自动完成。 - 专家支持:我们的专业团队随时准备
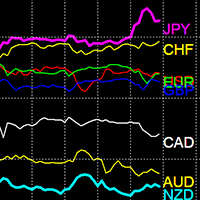
货币强弱指标
货币强弱指标是判断趋势的强有力的工具,用于对比货币之间的强弱关系,并且很容易找到趋势货币对。
促销价49
特点 有效的区分货币的强弱 自动标识趋势货币 多周期 加载28个货币对 性能优化
指标用法 强势货币: 在上面,大于80的货币为强势货币。 弱势货币: 在上面,小于20的货币为强势货币。
举例 当EUR大于80且向上,USD小于20且向下,那么EURUSD就是上涨趋势。 当JPY大于80且向上,GBP小于20且向下,那么GBPJPY就是下跌趋势。 越上面的货币越强,越下面的货币越弱。 两端的货币组成的货币对通常都是强劲的趋势,而且会持续一段时间。 指标会自动检测并显示趋势货币。
参数 =========== Caculate Period ========= Period 用于计算强弱的周期 Caculate TimeFrame 时间周期M1到MN,可以用非当前周期 =========== Display Period ========= StartNum 显示的数量 TimeFrames 周期,和StartNum配合使用,例如 2 Day, Fo

IQ FX Gann Levels a precision trading indicator based on W.D. Gann’s square root methods. It plots real-time, non-repainting support and resistance levels to help traders confidently spot intraday and scalping opportunities with high accuracy. William Delbert Gann (W.D. Gann) was an exceptional market analyst, whose trading technique was based on a complex blend of mathematics, geometry, astrology, and ancient mathematics which proved to be extremely accurate. Download the Metatrader 4 Version M
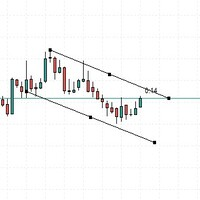
This indicator serves to give sound alerts when the price passes the manually placed line. A very useful tool, which allows you not to spend too much time sitting in front of the computer.
Note that the alert issued will always refer to the current candle, you can use multiple lines on the past chart to analyze.
This indicator will always receive better updates.
FREE

Moving pivot Average Fibonacci
The indicator compares the selected period with its counterpart from the previous period. The indicator determines the moving Fibonacci levels for the day or any time interval to assess the price movement range from the time average. The indicator helps predict the expected high or low for the day based on historical time data. The pivot line can be considered an average trend line and use it in a variety of trading strategies.
If you have any question about the
Session Bias This Strategy of bias useful for those who follow TRADESHARE on youtube. This script is designed by BokaroTraderFx for traders who want assistance in determining their session bias, particularly for those who trade within sessions typically represented by a single 4-hour candle. The method involves using price action to establish a daily bias, guiding decisions on whether to focus on buys, sells, or both. The analysis is based on the previous daily and 4-hour candle closes, fo
FREE

First and foremost, the Insight Flow Indicator stands out as a Non-Repainting, Non-Redrawing, and Non-Lagging tool. This makes it a prime choice for both manual and algorithmic trading, ensuring reliable and consistent signals. User Manual: Settings, Inputs, and Strategy The Insight Flow Indicator leverages price action, strength, and momentum to provide a clear edge in the market. Equipped with advanced filters, it eliminates noise and false signals, enhancing trading potential. By using multip

Translator MeraMera Custom Indicator for MetaTrader 5
Overview:
The MeraMera indicator is a powerful tool designed for MetaTrader 5, aimed at traders who prefer a decisive, high-risk-high-reward trading strategy. Its motto, "GO Full Margin or GO Home," encapsulates its aggressive approach to trading. This custom indicator analyzes market conditions to identify potential bullish and bearish signals, helping traders make informed decisions based on historical price patterns.
Key Features:
1. Bu

Version 1.5: manual color change added
This indicator helps to trade price action and momentum strategies like Guerrilla Trading or similar strategies.
The indicator displays: most recent highs and lows number of consecutive breaks past breaks of most recent highs and lows retest lines flag formations manual color change User can change colors. Go to Indictor Properties/Input, set "Auto Color" to false and change the colors. Set "Auto color" back to true to go back to pre-set colors. Please wa
FREE
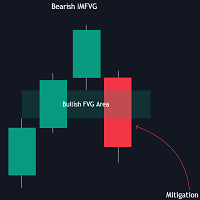
The FVG Instantaneous Mitigation Signals indicator detects and highlights "instantaneously" mitigated fair value gaps (FVG), that is FVGs that get mitigated one bar after their creation, returning signals upon mitigation.
Take profit/stop loss areas, as well as a trailing stop loss are also included to complement the signals.
USAGE Figure 1 Instantaneous Fair Value Gap mitigation is a new concept introduced in this script and refers to the event of price mitigating a fair value gap one

Here is a version for MetaTrader 5 of the famous Wave Trend indicator. Introducing the Wave Trend Oscillator Indicator for MT5 We are excited to present our Wave Trend Oscillator Indicator, exclusively designed for MetaTrader 5. This advanced tool is a must-have for traders who seek precision and efficiency in their trading journey. Our oscillator is built on the principles of wave trend analysis, capturing the ebb and flow of market trends with unparalleled accuracy. It helps traders identify p

The indicator places a buy or sell signal when the conditions of the strategy it was designed with are met. The strategy is guaranteed, strong, and has been tested for 9 years. The indicator is for binary options and can be converted into a bot by linking it to MT2Trading, where it sends the signal to this platform. This platform automatically opens a trade on the trading platform you are using, whether it is Pocket Option, IQ Option, or any other binary options platforms. The entry is on the n

The indicator displays the total number of ticks during the formation of a single bar. It can be used to analyze market activity in financial trading. Peaks and troughs of the indicator effectively highlight potential reversal points in price movements. This tool is particularly useful for traders seeking to identify periods of high volatility, allowing them to make informed decisions based on tick volume patterns. By observing changes in tick frequency, traders can gain insights into market se
MetaTrader 市场 - 在您的交易程序端可以直接使用为交易者提供的自动交易和技术指标。
MQL5.community 支付系统 提供给MQL5.com 网站所有已注册用户用于MetaTrade服务方面的事务。您可以使用WebMoney,PayPal 或银行卡进行存取款。
您错过了交易机会:
- 免费交易应用程序
- 8,000+信号可供复制
- 探索金融市场的经济新闻
注册
登录