YouTube'dan Mağaza ile ilgili eğitici videoları izleyin
Bir alım-satım robotu veya gösterge nasıl satın alınır?
Uzman Danışmanınızı
sanal sunucuda çalıştırın
sanal sunucuda çalıştırın
Satın almadan önce göstergeyi/alım-satım robotunu test edin
Mağazada kazanç sağlamak ister misiniz?
Satış için bir ürün nasıl sunulur?
MetaTrader 4 için yeni teknik göstergeler

iMRPHN: Supertrend & Swing Reversal Indicator A trading indicator that integrates Supertrend zone detection with swing-based entry logic. Designed for traders who apply both trend-following and counter-trend approaches. The indicator works across multiple timeframes and offers several helpful visual and alert-based features. Key Features: Automatic identification of swing high and swing low levels Automatic Fibonacci retracement Supertrend reversal zone visualization in real-time Highlights are

Happy Scalping Indicator Watch the live trading: https://youtu.be/QR5F_9uIb6k Join the Happy Scalping channel: https://www.mql5.com/en/channels/forexnewadvisor
This indicator was designed for aggressive scalping and quick entries in binary options , generating signals on every candle , so you can know exactly what’s happening at all times.
No repainting : the signal of the current candle is generated in REAL TIME , which means it may change while the candle is still forming, dependi
Çoklu Zaman Dilimi Mumları göstergesi, yatırımcıların daha düşük zaman dilimi analizlerini daha yüksek zaman dilimi yapısıyla uyumlu hale getirmelerine yardımcı olmak için tasarlanmış güçlü bir görselleştirme aracıdır. Seçili daha yüksek bir zaman diliminden (H1, H4, D1, vb.) mumları doğrudan mevcut grafiğinize çizerek, bu gösterge grafikleri değiştirmeden genel piyasa anlatısına dair daha net bir bakış açısı sunar.
Bu Göstergeye Kimin İhtiyacı Var? Bu araç şunlar için idealdir: Akıllı Para
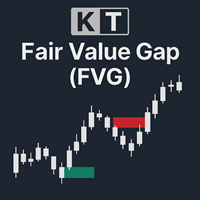
KT Fair Value Gap (FVG), piyasada geçici fiyat dengesizliklerinin oluştuğu bölgeleri tespit eder ve vurgular. Bu boşluklar genellikle fiyatın devam edeceği alanlar olarak işlev görür — bazı durumlarda ise ters yönde dönüşlerin (ters FVG) gerçekleşebileceği alanlar haline gelir. Yükseliş FVG: Yeşil kutular olarak gösterilir. Bu boşluklar, fiyatın yukarı yönlü hareketine devam edebileceği destek bölgeleridir. Fiyat boşluğu doldurduğunda, geri dönüş noktası olarak da işlev görebilir. Düşüş FVG: Kır
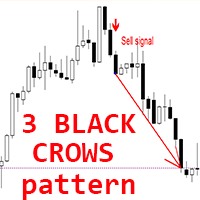
Crypto_Forex Göstergesi "3 Black Crows örüntüsü" MT4 için.
- Gösterge "3 Black Crows örüntüsü" Fiyat Hareketi ticareti için çok güçlüdür: Yeniden boyama yok, gecikme yok. - Gösterge grafikte düşüş eğilimli "3 Black Crows" örüntülerini algılar: Grafikte kırmızı ok sinyali (resimlere bakın). - PC, Mobil ve E-posta uyarılarıyla. - Ayrıca kardeşi - yükseliş eğilimli "3 White Soldiers örüntüsü" göstergesi mevcuttur (aşağıdaki bağlantıyı takip edin). - Gösterge "3 Black Crows örüntüsü" Destek/Direnç
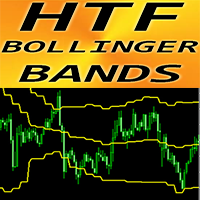
Crypto_Forex Göstergesi "HTF Bollinger Bantları" MT4 için.
- MT4 için profesyonel gösterge "HTF Bollinger Bantları" ile işlem yöntemlerinizi yükseltin. HTF - Daha Yüksek Zaman Çerçevesi anlamına gelir. - Bollinger Bantları piyasadaki en iyi göstergelerden biridir - işlem yapmak için mükemmel bir araçtır. - Fiyat hareketinin yaklaşık %90'ı iki bant arasında gerçekleşir. - HTF Bollinger Bantları göstergesi, Fiyat Hareketi girişleri olan veya diğer göstergelerle birlikte Çoklu Zaman Çerçevesi işl
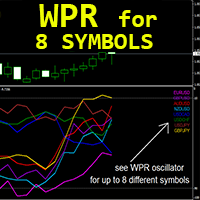
MT4 için "8 Sembol için WPR" Forex Göstergesi, Yeniden boyama yok.
- WPR, scalping için en iyi osilatörlerden biridir. - Güçlü Aşırı Satın Alma bölgesinden (-10'un üstünde) Satış girişleri ve güçlü Aşırı Satış bölgesinden (-90'ın altında) Satın Alma girişleri almak harikadır. - "8 Sembol için WPR", yalnızca 1 grafikte 8'e kadar farklı sembolün WPR değerlerini kontrol etme fırsatı verir. - Bu gösterge, Aşırı Satış/Aşırı Satın Alma alanlarından Fiyat Hareketi girişleriyle birleştirmek için de mü
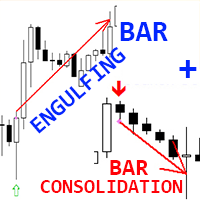
Crypto_Forex Göstergesi "Engulfing Bar ve Consolidation Bar" MT4 kalıpları.
- "Engulfing Bar ve Consolidation Bar" kalıpları Fiyat Hareketi ticareti için çok güçlüdür. - Gösterge grafikte Engulfing Bar ve Consolidation Bar'ları algılar: - Boğa Engulfing Bar kalıbı - Grafikte yeşil ok sinyali. - Ayı Engulfing Bar kalıbı - Grafikte turuncu ok sinyali. - Boğa Engulfing Bar kalıbı - Grafikte mavi ok sinyali. - Ayı Engulfing Bar kalıbı - Grafikte kırmızı ok sinyali. - Yeniden boyama yok, gecikme yo

FullScalping , yeniden çizim (repaint) veya geçmişi düzeltme (backpaint) yapmayan bir göstergedir. Her piyasada SÜREKLİ scalping girişleri üretmek için özel olarak tasarlanmıştır. Durmaksızın işlem yapmak isteyen agresif traderlar için idealdir! Yeni bilgiler ve güncellemeler için Göstergeler kanalını kontrol et: https://www.mql5.com/en/channels/forexnewadvisor Neredeyse her mumda sinyal verdiğini fark edeceksin — ya trendi onaylıyor ya da önemli geri çekilmeleri işaret ediyor. Adeta sü
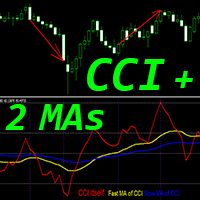
Crypto_Forex Göstergesi "CCI ve 2 Hareketli Ortalama" MT4 için, Yeniden Boyama Yok.
- Commodity_Channel_Index (CCI) trend yönünde momentum ticareti için mükemmeldir. - "CCI ve 2 Hareketli Ortalama" Göstergesi, CCI göstergesinin Hızlı ve Yavaş Hareketli Ortalamalarını görmenizi sağlar. - Yükseliş trendi - Hızlı MA, Yavaş olanın üzerindedir; Düşüş trendi - Hızlı MA, Yavaş olanın altındadır. - CCI, ticaret için en popüler osilatörlerden biridir - mevcut fiyat ile tarihsel ortalama fiyat arasındak
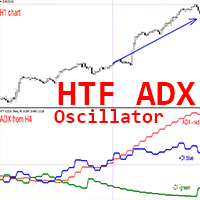
Crypto_Forex Göstergesi HTF ADX MT4 için.
- MT4 için profesyonel HTF ADX göstergesi ile işlem yöntemlerinizi yükseltin. HTF, - Daha Yüksek Zaman Çerçevesi anlamına gelir. - ADX (kırmızı çizgi) trend gücünü ölçmek için kullanılır - ADX değeri 20'nin üzerindeyse ve yukarı yönlü bir şekle sahipse - trend güçlüdür. - +DMI (mavi çizgi) -DMI'nin (yeşil çizgi) üzerindeyse: fiyat yukarı doğru hareket ediyor ve ADX yükseliş trendinin gücünü ölçer. - -DMI (yeşil çizgi) +DMI'nin (mavi çizgi) üzerindeyse:

Crypto_Forex Göstergesi MT4 Heiken Ashi Histo Filtresi için - harika ve etkili bir yardımcı ticaret aracıdır! Yeniden Boyama Yok!
- Gelişmiş yeni hesaplama yöntemi kullanılır - "Hesaplama için fiyat" parametresi için 10 seçenek. - Fiyat Hareketi desenleriyle birleştirmek için mükemmeldir: - Yeşil renkli histogram - Boğa desenlerini arayın. - Macenta renkli histogram - Ayı desenlerini arayın. - Bu göstergeyle standart stratejileri bile yükseltmek için birçok fırsat vardır. - Göstergede yerleşik
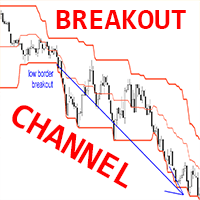
Crypto_Forex Göstergesi MT4 için BREAKOUT CHANNEL, Yeniden Boyama Yok.
- Bu gösterge Yüksek/Düşük kırılmalara dayalı komple bir ticaret sistemi olarak kullanılabilir. - Sadece 1 parametresi vardır - HYSTORY DEPTH, gösterge tarafından dikkate alınan mum sayısını yansıtır. - Parametre HYSTORY DEPTH önerilen değerleri: zaman dilimi D1 - 20 (bir ay), H4 - 30 (bir hafta), H1 - 24 (bir gün). - BREAKOUT CHANNEL 3 satırdan oluşur: Yüksek Sınır - son N (HYSTORY DEPTH parametresi) mumunun maksimum fiyat
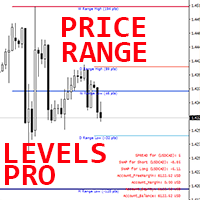
MT4 için Forex Göstergesi "Price Range Levels Pro".
- "Price Range Levels Pro" göstergesi çok kullanışlı profesyonel yardımcı ticaret aracıdır. - Fiyat (fiyat aralığı seviyeleri) ile ulaşılabilen Günlük, Haftalık ve Aylık en olası seviyeleri gösterir. - Günlük aralık, günlük içi yatırımcılar için faydalıdır. - Haftalık ve Aylık aralıklar Swing ve Uzun vadeli yatırımcılar için faydalıdır. - Gösterge, Kar Alma hedeflerinizi planlamak veya Zarar Durdurma emri düzenlemek için mükemmeldir. - Bilgi

Crypto_Forex Göstergesi "RSI SPEED" MT4 için - harika bir tahmin aracı, Yeniden Boyama Yok.
- Bu göstergenin hesaplanması fizik denklemlerine dayanmaktadır. RSI SPEED, RSI'nin kendisinin 1. türevidir. - RSI SPEED, ana trend yönündeki girişleri scalping için iyidir. - Uygun trend göstergesiyle birlikte kullanın, örneğin HTF MA (resimlerdeki gibi). - RSI SPEED göstergesi, RSI'nin yönünü ne kadar hızlı değiştirdiğini gösterir - çok hassastır. - Momentum ticaret stratejileri için RSI SPEED gösterg
M5 Signal
- M5 Signal was built specifically for the M5 timeframe and for all currency pairs.
- The M5 Signal indicator provides accurate BUY and SELL signals.
- The indicator is perfect for scalping.
- The indicator is easy to use.
- With a simple and intuitive interface, the indicator displays clear circles on the chart, making it easy to interpret and act on the signals.
When it detects a good entry point, it gives you a signal in the form of a circle.
- White circles: Buy signals.
-
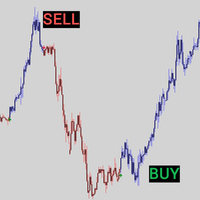
Special offer! https://www.mql5.com/ru/users/bossik2810 Arrow Candle - These are colored candles that show the trend based on volume and trend slope. This indicator will show you the color change on the next bar of the confirmation candle. Blue candles = possible buy (volume is increasing), Red candles = bullish weakness (volume is decreasing) possible sell. Arrow Candle is optimized for trading in any market and can be used in trending and non-trending markets. The Super Multiplier parameter
FREE

Piyasa Seansları Göstergesi Küresel Piyasa Seanslarını Görselleştirmek İçin Temel Araç Piyasa Seansları göstergesi, yatırımcıların ana forex piyasa seanslarını doğrudan grafikleri üzerinde görselleştirmelerine yardımcı olmak için tasarlanmış güçlü bir MT4 aracıdır. Sidney, Tokyo, Londra ve New York piyasalarının aktif işlem saatlerini açıkça göstererek, bu gösterge en uygun işlem dönemlerini belirlemenize ve piyasa volatilite modellerini anlamanıza yardımcı olur. Temel Özellikler: Dört ana işlem
FREE
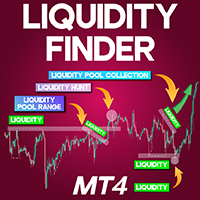
Liquidity Finder Indicator MT4
The Liquidity Finder Indicator MT4 is a powerful tool integrated into MetaTrader 4 (MT4) that assists traders in detecting zones of high liquidity concentration. This indicator automatically highlights both dynamic (angled) and static (horizontal, dotted) trend lines, offering insight into areas where price is likely to react. Static lines often align with significant chart patterns like Double Tops or Double Bottoms, acting as key markers for potential liquidity z
FREE
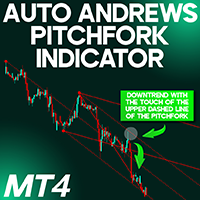
Auto Andrews Pitchfork indicator MT4 The Auto Andrews Pitchfork indicator MT4 is a technical analysis utility developed for MetaTrader 4 that identifies dynamic support and resistance zones based on price swings. This tool integrates well with MACD and determines three recent pivot points to draw a trio of parallel lines forming a pitchfork shape. The central median line of the pitchfork is a crucial level—acting as either a potential reversal points or confirming a trend continuation when breac
FREE
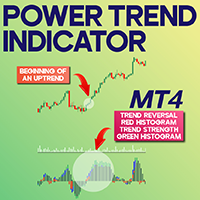
Power Trend Indicator for MetaTrader 4 The Power Trend Indicator for MetaTrader 4 is designed to assess both the momentum and direction of price movements. This MT4 indicator presents the trend strength using a four-color-coded system, allowing traders to spot weak momentum phases and anticipate potential trend initiations. Its visual feedback is valuable for recognizing shifts in market sentiment and detecting trend transitions. Red signals indicate reversals, blue suggests mild trends, while g
FREE
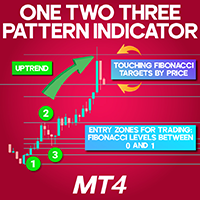
1-2-3 Pattern Indicator for MetaTrader 4
The 1-2-3 Pattern Indicator for MetaTrader 4 is a sophisticated technical tool designed to identify potential market reversals. It highlights three significant turning points, connecting them with a ZigZag pattern to visually map the price trajectory. Once the formation is complete, the indicator automatically generates Fibonacci retracement levels between the first two points to assist with trade planning. «Indicator Installation & User Guide»
MT4 Indi
FREE

Core Drift Index: Your Reliable Guide in the World of Trading Core Drift Index is an innovative trend indicator designed for precise detection of market directions and reversal points . This powerful tool enables traders to optimize their investments , minimize risk, and maximize profit. Key Features and Benefits Intuitive Trend Detection Core Drift Index clearly shows trend direction, helping traders make timely entry and exit decisions. High Probability of Success With its high accuracy
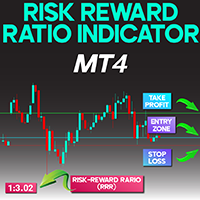
Risk Reward Indicator for MetaTrader 4
The Risk Reward Indicator for MetaTrader 4 is developed to assist traders in determining the potential risk and return of a trading position. It calculates the Risk-to-Reward Ratio (RRR) using three key levels: Entry Price (EP), Stop Loss (SL), and Take Profit (TP).
This tool graphically presents the RRR at the top-left corner of the chart and highlights the trade levels with three distinct horizontal lines:
• Green Line – Indicates the Take Profit level
•
FREE
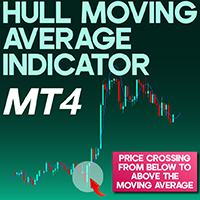
Hull Moving Average Indicator MetaTrader 4
The Hull Moving Average (Hull MA) indicator, developed by Alan Hull, is designed to minimize delay in standard moving averages and enhance responsiveness in trend evaluation. Available on the MetaTrader 4 platform, this indicator allows traders to spot short-term directional moves with greater clarity. It serves as an effective tool for identifying optimized trade entry and exit points. «Indicator Installation & User Guide»
MT4 Indicator Installation
FREE
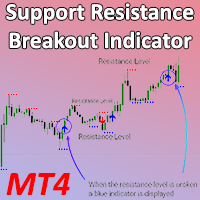
Support Resistance Breakout Indicator (SRBAI) download for MetaTrader 4
The Support Resistance Breakout Indicator (SRBAI) available for MetaTrader 4 (MT4) is designed to highlight significant pivot zones by mapping support and resistance levels on the price chart. Blue dashed lines represent support zones, while red dashed lines indicate resistance levels. Once the price breaks through a support area, the indicator generates a sell alert with a red downward-pointing arrow. Conversely, a resista
FREE
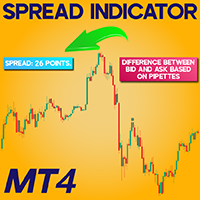
Spread Indicator download For Meta Trader 4
The Spread Indicator on MetaTrader 4 (MT4) serves to reveal the real-time gap between the Bid and Ask values. This variance, calculated in points (pipettes), appears clearly at the upper-left section of the chart window. «Indicator Installation & User Guide»
MT4 Indicator Installation | Spread Indicator Download for MT5 | ALL Products By TradingFinderLab | Best MT4 Indicator: Refined Order Block Indicator for MT4 | Best MT4 Utility: Trade
FREE
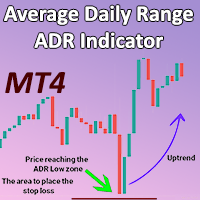
Average Daily Range (ADR) Indicator for MetaTrader 4 The Average Daily Range (ADR) Indicator for MetaTrader 4 is a vital technical analysis tool used to assess the typical price movement range an asset experience during a trading day.
By analyzing the average distance between daily highs and lows over a specified number of days, this indicator defines the ADR High (upper boundary) and ADR Low (lower boundary), helping traders identify possible support and resistance zones. «Indicator Installatio
FREE
MTRade is a professional arrow indicator based on the classic Parabolic SAR algorithm. It automatically detects the moments of trend direction change and displays clear signal arrows on the chart: up (buy) and down (sell).
Basis: original Parabolic SAR algorithm with full adaptation for visual display by arrows;
Signals: up arrow — possible up reversal (buy); down arrow — possible down reversal (sell);
No redrawing: signals are recorded only after a confirmed reversal, excluding "jumps" and
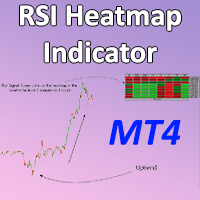
RSI Heatmap Indicator for MetaTrader4 The RSI Heatmap Indicator is a powerful technical tool in MetaTrader 4 that allows traders to assess the relative strength conditions of different currency pairs via a color-coded heatmap. By merging the Relative Strength Index (RSI) with a visual heatmap approach, this indicator simplifies market analysis by displaying strength and directional bias of multiple instruments at a glance. This indicator produces a heatmap based on calculated RSI levels across v
FREE
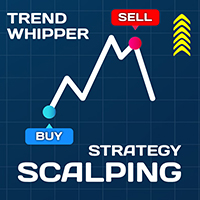
Trend detection is one of the basic challenges of every trader. Finding a way to tell when to enter a trade is very important, timing is a game changer, not too early and not too late. Sometimes, due to not knowing the market conditions, the trader closes his positions with a small profit or allows the losses to grow, these are the mistakes that novice traders make. Indicator Trend Whipper is a complete trading strategy and can improve the trader's trading process. The trend detection algorithm
Warp Range Sensor: The Color of Your Trend Warp Range Sensor is a trend direction indicator that visually displays the current market condition by coloring bars red and blue based on trend direction. What Does Warp Range Sensor Do? Identifies the Current Trend Direction Blue bars indicate an uptrend Red bars signal a downtrend Universal Application
Compatible with all currency pairs and timeframes , from short-term scalping to long-term trading. Powered by Market Context & Historical Data
W

Rocket pro is a powerful indicator for MetaTrader 4, designed to identify the most relevant trends in the financial market. If you are looking for a tool that accurately predicts movements, Rocket pro is your ally.
Live signal: https://www.mql5.com/en/signals/2303662 How it works: This indicator combines three different methods - volume analysis, candlestick closing and symmetrical trend - to detect and signal buying and selling opportunities. Rocket pro is like a "rocket" when it detects a bu

Divergence Divergence refers to when the price of a currency pair moves in one direction while the trend indicator is moving in the opposite direction. With divergence, there can be positive and negative signals. Divergences in Forex trading are quite common signals of technical analysis. These are basic early Forex signals indicating the trend reversal and filter false signals. Application of this indicator It is usually not easy to detect divergences by the trader and it may be time-consuming
This multimeter is a smaller version of the full scanner here: https://www.mql5.com/en/market/product/123072
This multimeter is for people interested in TDI Line Crossings. And who only use a single currency symbol/pair with multiple timeframes. If you want multiple currencies, then please look into the scanner.
It is for showing Cross of various TDI elements: PriceLine, Trade Signal Line and Market Base Line And for getting alerts, so you can be prepared for finding good trade setups before t
FREE

The indicator defines the buy and sell arrows with high performance and consistent results. Automatic analysis of market opportunities ; Help traders earn more from their investments;
Never repaints, recalculates or backpaints signals; This is FREE demo version of the indicator and works only on "EUR USD M5". ProTrading Arrow - All details about the indicator here : Works in all symbols and TF + free EA and Multi Currency Scanner + SPECIAL BONUS .
FREE
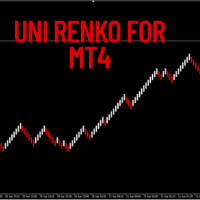
This versatile tool lets you create various Renko-style charts, including Median Renko, Mean Renko, and Traditional Renko with wicks . It offers a wide range of chart options to suit the needs of day traders, scalpers, and long-term investors.
Indicator Settings Starting Price. Box Size (in pips). Shift Percent. Timeframe Name. Show Wicks (On or Off). Amount of Bars.
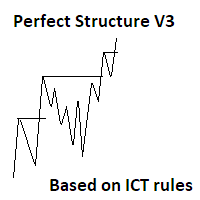
Here is the V3 of perfect structure. Whats new? (Please check added screenshots for better understanding.) 1. Coded based on ICT rules. 2. No more trend confusions...-- Added labels to show current trend 3. No more timeframe juggling and missing out important points, -- Now You can add indicator multiple times to mark multi timeframe structure on the same chart window( 1D structure on 4H or may be 4H structure on 15 min timeframe and more.....) 4. No more waiting in large range as sometimes mark

Pink J ICT trading system. Whats new? (Please check added screenshots for better understanding.) 1. Coded based on ICT rules. 2. No more trend confusions...-- Added labels to show current trend 3. No more timeframe juggling and missing out important points, -- Now You can add indicator multiple times to mark multi timeframe structure on the same chart window( 1D structure on 4H or may be 4H structure on 15 min timeframe and more.....) 4. No more waiting in large range as sometimes market makes h
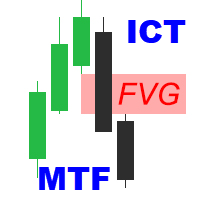
ICT Fair Value Gaps MTF Indicator Unlock the power of Fair Value Gaps (FVGs) across multiple timeframes using the ICT Fair Value Gaps Multi - Timeframe Indicator —a precision tool built for traders who follow the Smart Money Concept (SMC) . Key Features : Multi-Timeframe FVG Detection : Automatically identifies Fair Value Gaps from higher timeframes (M15, H1, H4, etc.) and plots them on your active chart for immediate insight. Dynamic Visualization : FVG zones are color-coded by
Scalping Strategy BUY SELL
Having a strategy in the market is one of the main conditions for trading. The presence of various and complicated indicators and tools sometimes makes trading difficult, and the user gets confused after trying various methods and gets stuck in a loss cycle, the result of which is usually clear. This indicator is a simple strategy based on the detection of pivots and short-term trends, which helps you to easily trade in trends. Sometimes a simple but efficient st

MACD Indicator The Moving Average Convergence and Divergence (MACD) is a trend following momentum indicator which shows the relationship between two moving averages that we chose and configure them on the indicator. The MACD is calculated by subtracting the 26-period exponential moving average and the 12 period D.A.M. These are the default parameters when you put the MACD indicator on the charts, and the period is usually 9 which means the last 9 candles. DT-Oscillator This is Robert C. Miner's
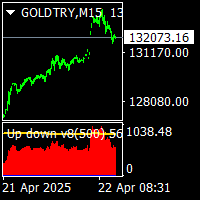
Up down v8 indicator is no repaint counter trend indicator . it try to find market up down points. it works all timeframes and all pairs. suitable for beginner and experienced trader. there is wave and c values to set defaults. minimum processed value cnt can be equal to wave value. traders can change them suitable up down points on different time frames. indicator use moving averages histograms and volatilty trigger. when red histogram is over volatility level that is tops. . when blue histogr
As the suggested, with this indicator you are able to switch from one symbol or timeframe to another in the same single chart. So forget about opening tons of chart on your screen! It's not designed for ICT or SMC trader, but if you are that kind of trader you still can use it. Imagine you have a strategy containing various indicators and settings, on a single chart you can screen the entry opportunity then move to the next symbol or timeframe.
FREE

Indicator defines the buy and sell arrows with high performance and consistent results . Automatic analysis of market opportunities ; Identifies a direction of a trend; Suitable for trend trading or following the trend;
This is FREE demo version of the indicator and works only on "EURUSD M5".
Forex Trend Commander full version: All details about the indicator here : Works in all symbols + free Multi Currency Scanner + free SPECIAL BONUS .
FREE

Price Change Indicator Introduction The Price Change Indicator is a powerful tool designed to help traders identify significant price movements over a specified period. By calculating and visualizing percentage changes between current and historical prices, it allows traders to quickly spot potential trading opportunities when markets show unusual volatility or momentum. Features Real-time monitoring of price changes Visual histogram display when changes exceed threshold Text display showing cur
FREE
RSI Powerful Arrows Works on ALL Timeframes
Instant Signals (No Delay / No Repaint)
Alerts: Pop-up, Sound, Email & Push Notifications
High Accuracy: ~98% Win Rate (optional Martingale)
Clean Arrows Directly on Chart (Main Window) The RSI Powerful Arrows is a highly reliable trading indicator that combines the Relative Strength Index (RSI) with Moving Averages and Bollinger Bands to deliver ultra-precise buy and sell signals. It draws non-repainting arrows dir

Hello fellow trader, I have built this indicator by combining trend and entry mechanisms i have used for years. This is one of my high probability strategies. All calculations are done based on pure price action-based market structure. Multiple confluences are used to validate and filter entries. All calculations are done behind the scenes, and you are given only buy sell signals. Accuracy becomes higher and higher as you trade higher timeframes, also based on my experience with the technique,

Hello fellow trader, I have built this indicator by combining trend and entry mechanisms i have used for years. This is one of my high probability strategies. All calculations are done based on pure price action-based market structure. Multiple confluences are used to validate and filter entries. All calculations are done behind the scenes, and you are given only buy sell signals. Accuracy becomes higher and higher as you trade higher timeframes, also based on my experience with the technique,

Ultimate Trend Rider
Ride the markets with confidence — your all‑in‑one trend‑capturing powerhouse.
Key Features & Benefits Adaptive Multi‑Filter Engine
Combines Supertrend, ADX, ATR volatility, and volume filters to ensure you enter only the strongest, most reliable trends. Multi‑Candle Confirmation
Eliminate “false start” signals: require multiple consecutive closes above/below your trend line before triggering an entry. Customizable Take‑Profit Alerts
Three levels of RSI‑based “TP” mar

Z Score Pair Trade Indicator for MT4 is a powerful statistical tool designed to help traders identify mean-reversion opportunities and overbought/oversold market conditions with precision. Based on standard deviation and mean analysis, this indicator calculates the Z-score of a selected spread, price series, or custom input to determine how far the current value deviates from its historical average.
Unlock powerful market insights with the Z Score Pair Trade Indicator — a must-have tool for tr
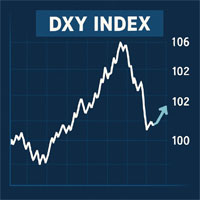
DXY Index indicator to help predict USD effect to your trade. DXY Index will help to see the power of USD.
For example if you trade XAUUSD and the DXY Index weaker, it could be the XAU will be bullish.
The same if DXY Index getting stronger, it could be that XAU will be bearish. I hope this indicator will help many trader to have better position to trade. Use this indicator wisely.

Arrow Indicator (Buy/Sell Alerts) – Simple Yet Powerful Tool! Product Version: 1.01 Indicator Type: Trend Reversal Signals Timeframes Supported: All (Recommended: H1, H4, D1) Key Features: Buy Signal : Green upward arrow () appears below the candle Sell Signal : Red downward arrow () appears above the candle Accurate Trend Reversal Detection – Based on tried and tested SMA strategy. ️ Clean Chart View – Minimalist, non-intrusive arrow signals for easy trading. Work

CDS SR Fractal Level: Enhance Your Trading Accuracy with Automatic Fractal-Based Support and Resistance Levels The CDS SR Fractal Level indicator is an advanced trading tool designed by CDS to automatically identify and visualize key Support and Resistance (SR) levels. This indicator utilizes the concept of fractals to present relevant SR levels for your trading decisions. Key Features: Automatic Fractal Level Identification: The indicator dynamically marks fractal levels as they form on the pri

The Great Oracle – Your Guide to Consistent Trend Trading Success
The Great Oracle is a powerful trend-following indicator designed for traders who seek precision in their entries and exits. Whether you’re navigating trending markets or spotting opportunities in ranging conditions, The Great Oracle provides you with accurate signals and a second chance to join strong market trends. It’s the ultimate tool for traders who want to maximize profits while keeping risks manageable.
Key Features:
•
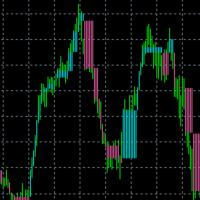
When there is no position, when changing the color, you can consider opening an order. With the fluctuation of the market, when the current color changes again, you need to close the position and leave. Suitable for different cycles, the trading rules are simple and require friends to explore on their own.
I hope friends who use this indicator can make a lot of money, rolling bigger and bigger like a snowball. thank you!

NOTE: CYCLEMAESTRO is distributed only on this website, there are no other distributors. Demo version is for reference only and is not supported. Full versione is perfectly functional and it is supported CYCLEMAESTRO , the first and only indicator of Cyclic Analysis, useful for giving signals of TRADING, BUY, SELL, STOP LOSS, ADDING. Created on the logic of Serghei Istrati and programmed by Stefano Frisetti ; CYCLEMAESTRO is not an indicator like the others, the challenge was to interpret only t
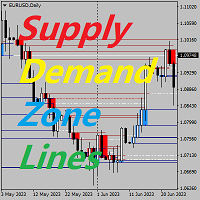
Arz ve Talep Bölgesi Temel Fiyat Göstergeleri arka plan Sistem K-çizgisindeki arz ve talep alanlarını otomatik olarak arar ve gerçek zamanlı anahtar fiyat çizgilerini çizer. Yatırımcılar fiyat işlem hatlarına göre işlem yapabilirler. Ana Özellikler Sistem K-çizgisindeki arz ve talep alanlarını otomatik olarak arar. Sistem aynı zamanda gerçek zamanlı anahtar fiyat çizgilerini de çizecek ve yatırımcılar fiyat işlem çizgilerine göre işlem yapabilecekler. Dolayısıyla arz ve talep bölgesi stratejisi
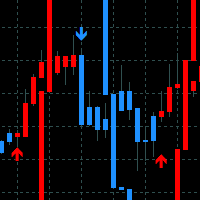
Reversal Bands - volatilite analizi ve sonuçların işlemlerde uygulanması için tasarlanmış bir göstergedir. Fiyat yönünün trend boyunca ve tersine dönüşün erken aşamalarında sinyallerini verir.
Gösterge yetenekleri
Gösterge, oynaklığın yumuşatma derecesi kullanılarak hızlanması ve yavaşlaması prensiplerine göre oluşturulan hız çizgilerine dayanmaktadır. Çizginin itici gücü volatilitedir, volatilite ne kadar fazlaysa çizgiler fiyattan o kadar çok sapar. Kırmızı oklar, mumlar ve hız çizgileri yük
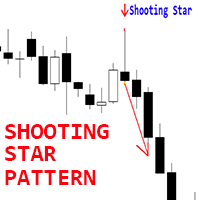
Crypto_Forex Göstergesi MT4 için "Kayan Yıldız deseni".
- "Kayan Yıldız deseni" göstergesi Fiyat Hareketi ticareti için çok güçlü bir göstergedir: Yeniden boyama yok, gecikme yok. - Gösterge grafikte düşüş eğilimi gösteren Kayan Yıldız desenlerini algılar: Grafikte kırmızı ok sinyali (resimlere bakın). - PC, Mobil ve E-posta uyarılarıyla. - "Kayan Yıldız deseni" göstergesi Destek/Direnç Seviyeleriyle birleştirmek için mükemmeldir.
// Harika Ticaret Robotları ve Göstergeleri burada mevcuttur:
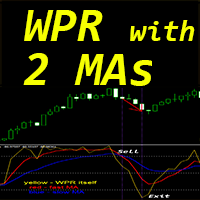
Crypto_Forex Göstergesi "WPR ve 2 Hareketli Ortalama" MT4 için, Yeniden Boyama Yok.
- WPR, scalping için en iyi osilatörlerden biridir. - "WPR ve 2 Hareketli Ortalama" Göstergesi, WPR osilatörünün Hızlı ve Yavaş Hareketli Ortalamalarını görmenizi sağlar. - Gösterge, fiyat düzeltmelerini çok erken görme fırsatı verir. - Bu göstergeyi parametreler aracılığıyla ayarlamak çok kolaydır, herhangi bir zaman diliminde kullanılabilir. - Resimlerde Satın Alma ve Satış giriş koşullarını görebilirsiniz. -
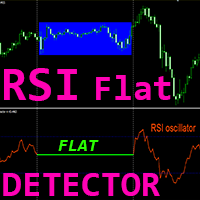
Crypto_Forex Göstergesi "RSI FLAT Detector" - ticarette etkili bir yardımcı araçtır! Yeniden Boyama Yok. MT4 için bu harika göstergeyle ticaret yöntemlerinizi yükseltmenizi öneriyorum.
- Gösterge, grafikte fiyat Düz alanlarını gösterir. Düz algılamadan sorumlu olan "Düz duyarlılık" parametresine sahiptir. - "RSI FLAT Detector", Fiyat Hareketi girişlerinin onaylanması veya diğer göstergelerle birlikte kullanılabilir. - Düz bölgeleri algılamak ve orada işlem yapmaktan kaçınmak için trend takip s
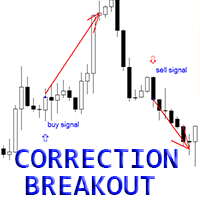
Crypto_Forex Göstergesi MT4 için "Düzeltme Kopuş paterni".
- "Düzeltme Kopuş paterni" göstergesi Fiyat Hareketi ticareti için çok güçlü bir göstergedir: Yeniden boyama yok, gecikme yok. - Gösterge fiyat düzeltmesinden sonra boğa ve ayı Kopuş çubuklarını algılar: - Boğa Düzeltme Kopuş paterni - Grafikte mavi ok sinyali (resimlere bakın). - Ayı Düzeltme Kopuş paterni - Grafikte kırmızı ok sinyali (resimlere bakın). - PC, Mobil ve E-posta uyarılarıyla. - "Düzeltme Kopuş paterni" göstergesi Destek
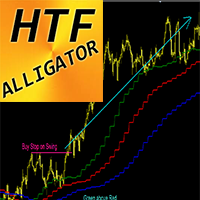
Crypto_Forex Göstergesi Timsah Yüksek Zaman Çerçevesi MT4 için.
- Timsah göstergesi en güçlü trend göstergelerinden biridir. HTF - Yüksek Zaman Çerçevesi anlamına gelir. - Bu gösterge trend yatırımcıları için mükemmeldir ve Fiyat Hareketi girişleriyle birlikte kullanılabilir. - HTF Timsah Göstergesi, Yüksek zaman çerçevesinden Timsah'ı mevcut grafiğinize eklemenize olanak tanır. - Sadece Yeşil çizgi Kırmızı çizginin üzerinde ve Kırmızı çizgi Mavi çizginin üzerinde olduğunda Satın Alma girişler
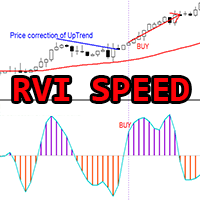
Crypto_Forex Göstergesi "RVI Hızı" MT4 için, Yeniden Boyama Yok.
- Bu göstergenin hesaplanması fizik denklemlerine dayanmaktadır. RVI Hızı, RVI'nin kendisinin 1. türevidir. - Relative_Vigor_Index (RVI) kendisi, trend piyasalarında çok faydalı olan teknik bir momentum göstergesidir. - RVI Hızı, ana trend yönünde fiyat düzeltmesinden sonra momentum girişleri için iyidir. - Uygun trend göstergesiyle, örneğin standart EMA (resimlerdeki gibi) ile birlikte kullanın. - RVI Hız göstergesi, RVI'nin yön
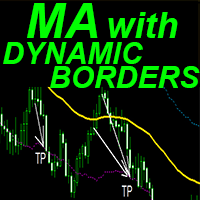
Crypto_Forex Göstergesi "Dinamik Sınırlı Hareketli Ortalama" MT4 için.
- Gösterge, Hareketli Ortalama - Dinamik Volatilite Sınırlarına bağlı benzersiz bir özelliğe sahiptir. - Dinamik Volatilite Sınırları hesaplama için Ortalama Gerçek Aralık değerlerini kullanır. - Bu gösterge, TakeProfit hedeflemesi ve sınır hatlarında SL düzenlemesi için harikadır. - Gösterge, Fiyat Hareketi sinyalleriyle birleştirmek için de mükemmeldir.
// Harika Ticaret Robotları ve Göstergeleri burada mevcuttur: https:
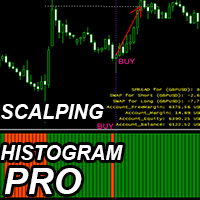
Crypto_Forex Göstergesi "Scalping Histogram Pro" MT4 için, Yeniden Boyama Yok.
- Scalping Histogram Pro göstergesi, küçük fiyat düzeltmesinden sonra fiyat momentumunun ana yönüne giriş sinyallerinin aranması için kullanılabilir. - Scalping Histogram Pro 2 renkte olabilir: düşüş momentumu için turuncu ve yükseliş momentumu için yeşil. - Aynı renkte en az 10 ardışık histogram çubuğu gördüğünüzde, güçlü bir momentum gerçekleştiği anlamına gelir. - Giriş sinyali, histogramda zıt renkte 1 sütun ve
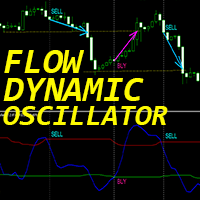
"Dinamik Akış Osilatörü" - gelişmiş bir özel Kripto_Forex göstergesidir - MT4 için etkili bir Ticaret aracıdır!
- Yeni nesil Osilatörler - nasıl kullanılacağını kontrol etmek için resimlere bakın. - Dinamik Akış Osilatörü uyarlanabilir Aşırı Satış/Aşırı Satın Alma bölgelerine sahiptir. - Gösterge aşırı satış ve aşırı satın alma bölgelerini belirlemek için fiyat ve hacim verilerini kullanır. - Osilatör, Aşırı Satış/Aşırı Satın Alma alanlarından tam giriş noktalarını bulmak için yardımcı bir ara
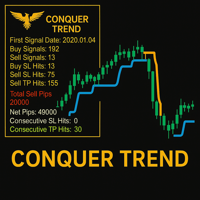
Conqer Trend LE — Simple, Clear, and Effective
Non-repainting signals for more accurate decisions Customizable Stop Loss and Take Profit in pips Works on all timeframes and symbols Built-in alerts and notifications (popup, sound, push, email) Quiet and clean chart display — only shows what matters Helps reduce confusion and overtrading by showing clear direction
\\\Works on all timeframes (multi-timeframe support) Stay in the trend without second-guessing Reduce chart noise and focus on s

Ürün Adı A arca Temel Özellikler Kritik Bölgelerin Otomatik Tespiti
A arca, destek ve direnç seviyelerini otomatik olarak belirleyip göstererek, potansiyel alım ve satım noktalarını tespit etmeyi kolaylaştırır. Net Alış ve Satış Sinyalleri
Alış ve satış işaretleri sunarak, yatırımcıların pozisyona girme veya pozisyondan çıkma zamanını daha iyi belirlemesine yardımcı olur. Çoklu Zaman Çerçevesi Analizi
M5, M15, H1 gibi farklı zaman dilimlerinin verilerini entegre ederek, daha detaylı bir anali
123456789101112131415161718192021222324252627282930313233343536373839404142434445464748495051525354555657585960616263646566676869707172737475767778798081828384858687888990919293949596979899100101102103104105106107108109110111112113114115116117118119120121122123124125126127128129130131132133134135136137138139140141142143144145146147148149
MetaTrader platformunun uygulama mağazası olan MetaTrader mağazasından bir alım-satım robotunun nasıl satın alınacağını öğrenin.
MQL5.community ödeme sistemi, PayPal, banka kartları ve popüler ödeme sistemleri aracılığıyla yapılan işlemleri destekler. Daha iyi bir müşteri deneyimi için satın almadan önce alım-satım robotunu test etmenizi şiddetle tavsiye ederiz.
Alım-satım fırsatlarını kaçırıyorsunuz:
- Ücretsiz alım-satım uygulamaları
- İşlem kopyalama için 8.000'den fazla sinyal
- Finansal piyasaları keşfetmek için ekonomik haberler
Kayıt
Giriş yap
Gizlilik ve Veri Koruma Politikasını ve MQL5.com Kullanım Şartlarını kabul edersiniz
Hesabınız yoksa, lütfen kaydolun
MQL5.com web sitesine giriş yapmak için çerezlerin kullanımına izin vermelisiniz.
Lütfen tarayıcınızda gerekli ayarı etkinleştirin, aksi takdirde giriş yapamazsınız.