YouTube'dan Mağaza ile ilgili eğitici videoları izleyin
Bir alım-satım robotu veya gösterge nasıl satın alınır?
Uzman Danışmanınızı
sanal sunucuda çalıştırın
sanal sunucuda çalıştırın
Satın almadan önce göstergeyi/alım-satım robotunu test edin
Mağazada kazanç sağlamak ister misiniz?
Satış için bir ürün nasıl sunulur?
MetaTrader 4 için yeni teknik göstergeler - 27

MA MTF Overlay Chart is software that allows you to overlay the candlestick chart of a financial instrument with a second candlestick chart of the same one, or of another, financial instrument, by setting a different timeframe from that of the basic chart. The software is very simple to use and the input parameters are listed below.
Input parameters: Overlay chart set-up Financial instrument : financial instrument that you want to overlay on the base chart Time period : secondary instrume
FREE

The indicator shows the Fibonaccia golden ratio levels and the price balance line Has three different sensitivity options Allows you to visually navigate what state the market is in and where trend reversals are possible Works on all timeframes, on any currency pairs, metals and cryptocurrencies Can be used when working with binary options Distinctive features Based on the golden Fibonacci value; Determines the balance line of price equilibrium Has three different sensitivity settings; Simple an
FREE

Candle size oscillator is an easy to use tool to figure out candle size from highest to lowest price of each candle. It's a powerful tool for price action analysts specifically for those who works intraday charts and also a perfect tool for short term swing traders. Kindly note that you can also edit the Bullish and Bearish candles with different colors.
#Tags: Candle size, oscillator, price action, price range, high to low, candle ticks __________________________________________________________
FREE

The Buyside & Sellside Liquidity indicator aims to detect & highlight the first and arguably most important concept within the ICT trading methodology, Liquidity levels. SETTINGS
Liquidity Levels
Detection Length: Lookback period
Margin: Sets margin/sensitivity for a liquidity level detection
Liquidity Zones
Buyside Liquidity Zones: Enables display of the buyside liquidity zones.
Margin: Sets margin/sensitivity for the liquidity zone boundaries.
Color: Color option for buysid

MP Price Change Indicator is a tool to calculate the price movement by percentage. The Value of this indicator can be adjusted to look back of the percent of price change within certain timeframes. This is a powerful tool when used by other indicators as well, such as ATR and ADR, for understanding price fluctuations and tolerance in different strategies. ___________________________________________________________________________________ Disclaimer:
Do NOT trade or invest based upon the analysi
FREE

Temel Mum Çubuğu Formasyonları göstergemiz başlıca mum çubuğu formasyonlarını belirlemeyi her zamankinden daha kolay hale getiriyor. Çekiç, Akşam Yıldızı, Üç Beyaz Asker ve çok daha fazlası gibi formasyonları grafiğinize bir bakışta keşfedin. Sezgisel bir arayüz ve net görsel ipuçları ile göstergemiz, ticaret fırsatlarını hızlı ve doğru bir şekilde belirlemenize yardımcı olur / MT5 sürümü
Bu gösterge için Gösterge Tablosu Tarayıcısı: ( Basic Candlestick Patterns Dashboard )
Özellikler Doğrul
FREE

Yenilikçi Temel Mum Çubuğu Formasyonları Panomuz, grafikteki kârlı mum çubuğu formasyonlarını otomatik olarak belirlemek için özel olarak tasarlanmıştır. Bu gösterge paneli, fiyat grafiklerini gerçek zamanlı olarak taramak ve klasikten karmaşığa kadar çok çeşitli mum çubuğu formasyonlarını tespit etmek için gelişmiş algoritmalar kullanır. Buna ek olarak, tespit edilen formasyonları farklı zaman dilimlerinde görselleştirmenize olanak tanıyan kullanımı kolay bir arayüze sahiptir ve bilinçli karar
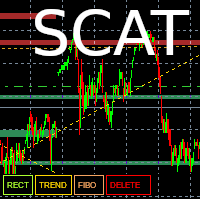
This tool allows you to draw trend lines, polarity zones, supports and resistances, Fibonacci retracements and save them. The user has 4 buttons which are displayed in their default configuration at the bottom left of the main window :
- A "Level" button allowing you to draw support and resistance zones
- A “Trend” button allowing you to draw a trend line
- A “Fibo” button allowing you to display a Fibonacci retracement
- A “DELETE” button which allows you to delete the selected object.
A

Yön Kuvveti Göstergesi
Yön Kuvveti teknik göstergesi, fiyat hareketinin göreceli gücünü ölçmeye ve aynı zamanda trendin yönünü belirlemeye ve takip etmeye yardımcı olmak için kullanılabilecek bir dizi unsuru bir araya getirme fikrine dayanmaktadır.
Göstergede yavaş osilatör (siyah çizgi), hızlı osilatör (gri çizgi) ve sinyal çizgisi olarak işlev gören düşük değerli üssel bir orta çizgi (mavi çizgi) bulunmaktadır. Bu, hareketin tersine dönüşleri belirleyerek aynı zamanda bir yönlendirici olara
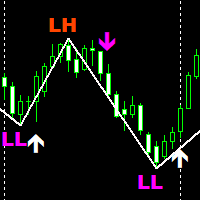
SMC Traders is a non-repaint indicator that is based on Price Action The indicator uses current market structure to predict future reversals. The indicator can be used with our free Market structure zig zag which can be found here: https://www.mql5.com/en/market/product/91579 Please note to find the HH AND HL CLINK ON LINK ABOVE Timeframes: 15 minutes for scalping 1 Hour for swing trading Purple Arrow look for sells in conjunction with LL White Arrow look for buys in conjunction with HL
FREE

The DYJ WPR - SignalSource is based on WPR indicator. It can be used for any currency pair and timeframe. The WPR recommends Indicator values ranging between 80 and 100% indicate that the market is oversold. Indicator values ranging between 0 and 20% indicate that the market is overbought. The entry signal of this indicator is a turning point in the trend.
The indicator uses analog trading technology,
Provide you with indicators to evaluate the overall profit of the opening signal and clo
FxTDR is a bespoke technical indicator tailored for analyzing asset prices. The primary objective of this indicator is to identify favorable entry points for trading on selected currency pairs. It employs a set of criteria to detect optimal trading opportunities within the chosen time frame.
Key Features: 1. Entry Point Detection: Pinpoints favorable trade conditions. 2. Arrow Signals: Provides visual cues for identified opportunities. 3. Push Notifications: Real-time alerts for timely awarene

#WinPlus Trend and Entry Indicator
Unlock the power of precision in your trading with WinPlus, a bespoke technical indicator designed for financial assets. This indicator is meticulously crafted to discern trends and pinpoint entry opportunities across a diverse range of currency pairs on the h4 Timeframe. WinPlus analyzes price movements and utilizes our advanced algorithms to identify trends. When an optimal entry point is detected, the indicator generates clear arrow signals on the chart. A

The " Comfort Zone Signal " indicator identifies a daily zone that, when broken, has a high probability of the market continuing the established trend .
Upon signal, the indicator calculates stop loss and take profit, which can be set by you.
You can also set the trend. If the price is above the MA, it looks only for long positions, if below, it looks only for short positions.
You can choose to ignore the moving average and display all signals.
Additionally, you have the risk percentage displ
FREE

DYJ Alligator SignalSource is based on Alligator indicator. It can be used for any currency pair and timeframe. The blue line (Alligator's Jaw) is the Balance Line for the timeframe that was used to build the chart (13-period Smoothed Moving Average, moved into the future by 8 bars); Red Line (Alligator's Teeth) is the Balance Line for the value timeframe of one level lower (8-period Smoothed Moving Average, moved by 5 bars into the future); Green Line (Alligator's Lips) is the Balance Line

Asesor Experto "Sniper FX": Precisión Milimétrica para Tus Operaciones El asesor experto "Sniper FX" redefine la precisión en el trading automatizado al ofrecer un enfoque estratégico centrado en pocas, pero extraordinariamente precisas, entradas en el mercado. Inspirado por la agudeza de un francotirador, este asesor experto utiliza algoritmos avanzados para identificar oportunidades óptimas de compra y venta, maximizando el potencial de beneficios mientras minimiza la exposición al mercado.
FREE

PLEASE TAKE NOTICE: This indicator is in current development. final version will be free.
This is a simple indicator that uses 3 timeframes in its formula to create Possible buy and sell signals. This indicator is optimized for the M1 timeframe Only. It has 2 types of Alerts: Push Notifications Audio Alerts UPDATES:
3/19/24: Still testing the final code
Troubleshooting: When loading the indicator, if you don't see the arrows on the current chart that means that MT4 has not loaded all the high
FREE

Donchian channels are a tool in technical analysis used to determine the relative volatility of a market and the potential for price breakouts.
Can help identify potential breakouts and reversals in price, which are the moments when traders are called on to make strategic decisions. These strategies can help you capitalize on price trends while having pre-defined entry and exit points to secure gains or limit losses. Using the Donchian channel can thus be part of a disciplined approach to managi
FREE

FALCON ZONES , OPORTUNIDADES EN EL MERCADO PARA COMPORAR O VENDER
Características Destacadas: Identificación de Patrones de Velas: Reconoce una amplia gama de patrones de velas, desde patrones simples hasta formaciones más complejas. Proporciona una visión completa de la psicología del mercado encapsulada en las velas. Alertas Personalizadas: Configura alertas a medida para los patrones de velas que más te interesan o que se alinean con tu estrategia. Recibe notificaciones instantáneas cuando s
FREE

Indicador "Supply and Demand Channels" para MetaTrader: Potencia tu Trading con Claridad y Precisión El indicador "Supply and Demand Channels" para MetaTrader es una herramienta avanzada diseñada para brindar a los traders una visión nítida y precisa de las zonas clave de oferta y demanda en el mercado. Basado en el principio fundamental de la ley de oferta y demanda, este indicador ofrece una interpretación gráfica única de las fuerzas que impulsan los movimientos de precios. Características De
FREE

Indicador "Trade Zones: Supply and Demand Opportunities" para MetaTrader: Eleva tu Trading con Precisión Estratégica El indicador "Trade Zones: Supply and Demand Opportunities" es una herramienta revolucionaria diseñada para potenciar la toma de decisiones de los traders al identificar claramente las zonas de oportunidad basadas en los principios fundamentales de oferta y demanda. Este indicador, compatible con MetaTrader, proporciona una visión intuitiva de las áreas críticas del mercado donde
FREE

Indicador "Heikin Ashi Master" para MetaTrader: Transforma tu Análisis con Velas Japonesas Suavizadas El indicador "Heikin Ashi Master" es una herramienta innovadora diseñada para traders que buscan una perspectiva única del mercado a través de las Velas Japonesas. Compatible con MetaTrader, este indicador suaviza la acción del precio, ofreciendo una interpretación simplificada y visualmente atractiva de las tendencias y cambios en el mercado. Características Destacadas: Suavizado de la Acción
FREE

Created by imjesstwoone and mickey1984, this trade model attempts to capture the expansion from the 10:00-14:00 EST 4h candle using just 3 simple steps. All of the information presented in this description has been outlined by its creators, all I did was translate it to MQL4. All core settings of the trade model may be edited so that users can test several variations, however this description will cover its default, intended behavior using NQ 5m as an example. Step 1 is to identify our Price Ra
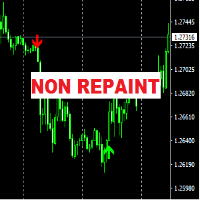
The "FCK Trend Arrow No Repaint" indicator is designed for analyzing market dynamics and determining potential trading signal moments. The main feature of this indicator is the absence of signal repainting, which contributes to more accurate and reliable forecasting of price movements in the market.
Mechanism of Operation: The "FCK Trend Arrow No Repaint" indicator uses several types of graphical elements to indicate trading signals: Up and Down Arrows: The indicator marks possible market entr
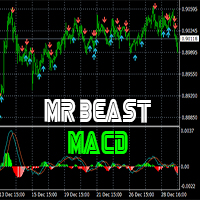
MR BEAST MACD Momentum Signals BUY SELL es una poderosa herramienta diseñada para optimizar las decisiones de trading al identificar oportunidades clave de compra y venta en los mercados financieros. Basado en el popular indicador MACD (Moving Average Convergence Divergence), este sistema utiliza algoritmos avanzados para generar señales precisas que reflejan cambios significativos en la dinámica del mercado. Características Destacadas: Señales de Compra y Venta Precisas: El Indicador MACD Mo

The GGP SuperTrend MT4 Indicator is a technical analysis tool that can assist investors in identifying market trends. The indicator is based on ATR and is very useful for capturing the direction of an asset’s momentum and is widely employed when looking at stocks, currencies, and commodities. It plots a line on the price chart, which acts as a dynamic level of support or resistance, helping traders and investors make informed decisions about entry and exit points. This indicator is MT5 conversi

"MR BEAST ELLIOT WAVES" para MetaTrader: Transforma tu Trading con Precisión y Generosidad El indicador "MR BEAST ELLIOT WAVES" para MetaTrader es una herramienta innovadora que combina la precisión de las ondas de Elliott con la filantropía de Mr. Beast. Diseñado para traders de todos los niveles, este indicador proporciona una visión clara de las oscilaciones del mercado, identificando patrones de manera efectiva. Características Principales: Ondas de Elliott Simplificadas: El indicador visual

El indicador "MR BEAST PATTERNS WITH ALERTS" es una herramienta avanzada diseñada para identificar y notificar automáticamente patrones de oportunidad en el mercado financiero. Basándose en una combinación de análisis técnico y algoritmos inteligentes, este indicador escanea constantemente el gráfico en busca de patrones específicos que podrían indicar momentos propicios para la toma de decisiones. Características Principales: Detección de Patrones: El indicador identifica patrones de oportunida

Indicador "Candlestick Alert Pro" para MetaTrader: Maximiza tu Trading con Alertas de Patrones de Velas El indicador "Candlestick Alert Pro" es una herramienta esencial para traders que desean potenciar su análisis técnico, identificando patrones de velas clave y recibiendo alertas estratégicas en tiempo real. Compatible con MetaTrader, este indicador proporciona una visión detallada de la acción del precio, permitiendo decisiones informadas y oportunas. Características Destacadas: Identificació

Asesor Experto "MR BEAST MIN MAX Price Extremes Master": Potencia tu Trading con Precisión en Mínimos y Máximos El asesor experto "Price Extremes Master" redefine la toma de decisiones en el trading al basarse en los precios mínimos y máximos del mercado. Este innovador asesor utiliza algoritmos avanzados para identificar oportunidades estratégicas en los puntos extremos de precios, permitiendo a los traders capitalizar las fluctuaciones del mercado de manera eficaz. Características Destacadas:

LLAMA MACD has been made from the same formula that creates regular MACD. The only difference is that both smoothing alogrithms has been replaced by the LLAMA (LagLess Adaptive Moving Average)
Main parameters are the same : 2) LLAMA Period (Fast) 1) LLAMA Period (Slow) 3) LLAMA Signal Period
and the LLAMA Parameters are the same as with the single AMA: 1) ActiveBar : computes last bar as well in Realtime (higher CPU usage) 2) ATRPeriod 3) ATRDistMul =: Multiplier1 (Detect) 4) ATRDistMul2 : M

LLAMA BB has been made from the same formula that creates regular BB. The only difference is that the smoothing alogrithms have been replaced by the LLAMA (LagLess Adaptive Moving Average)
Main parameters are the same :
2) LLAMA Period
1) STDDEV Period
3) STDDEV Multiplier
and the LLAMA Parameters are the same as with the single AMA:
1) ActiveBar : computes last bar as well in Realtime (higher CPU usage)
2) ATRPeriod
3) ATRDistMul =: Multiplier1 (Detect)
4) ATRDistMul2 : Multiplie

Indicator Name: SignalPro Serro Buy Sell Arrows Description: SignalPro Serro Buy Sell Arrows is a powerful and user-friendly MQL4 indicator designed to enhance your trading experience by providing clear and accurate signals for market sell opportunities. Developed with precision and reliability in mind, this indicator is a valuable tool for both novice and experienced traders. Key Features: Buy and Sell Arrows: The indicator displays clear buy and sell arrows on the chart, making it easy for tra
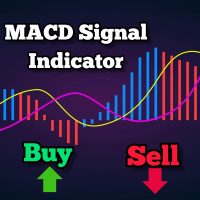
Bu, MACD tabanlı bir trend takip göstergesidir ve 200 MA'nın üzerindeyken alım sinyalleri, altındayken satış sinyalleri sağlar.
Sinyal, MACD'nin sıfır çizgisini geçtiğinde üretilir. Gösterge aynı zamanda stop loss olarak kullanılabilecek bir destek ve direnç seviyesini de görüntüler. Ayarlanabilir parametreler arasında MA dönemi, MACD hızlı EMA, yavaş EMA ve destek-direnç aralığı bulunur. Son mumların en düşük ve en yüksek noktalarına çizilir.
Varsayılan ayarlar:
SR aralığı: 10 MA dönemi: 20
FREE

Piyasa gücü ve duyarlılık göstergemizle alım satım kararlarınızı optimize edin ve artık trende karşı alım satım yapmayın!
Doğru ve zamanında bilgiye değer veren ciddi yatırımcılar için titizlikle tasarlanan göstergemiz, 28 ana çifte çok basit bir şekilde kuş bakışı bir görünüm sağlar. Bu araç, döviz çiftlerini popülerlik, yükseliş veya düşüş eğilimi gücü ve alıcı ve satıcıların yüzdesi / MT5 versiyonuna göre sıralayabilir.
Özellikler Gerçek Zamanlı Trend Gücü: Her bir döviz çiftindeki tren

EURUSD döviz çifti ve H1 zaman aralığı için özel olarak tasarlanmış yeni nesil trend göstergesi Currency Smart Scalper göstergesini sizlere sunuyoruz. Bu güçlü araç, piyasayı otomatik olarak analiz eder ve işlemlerin açılması ve kapanması için sinyaller sağlar. Ichimoku, Parabolik SAR ve Bollinger göstergelerini kullanan Currency Smart Scalper, forex piyasasında işlem yaparken eşsiz verimlilik sağlar. Kanalımıza abone olarak göstergeler ve ticaretle ilgili diğer konular hakkında daha fazla bilg

Gösterge grafikte "Raylar" formasyonunu görüntüler. Bu formasyon, aynı gövdelere ve küçük gölgelere sahip iki çok yönlü mumdan oluşur. Mevcut zaman diliminde desen "Raylar" ise, x2 zaman diliminde bir Pin Bar (Doji) gibi görünecektir. Bu gösterge, kolayca değiştirebileceğiniz mantıksal olarak basit ayarlarla deseni otomatik olarak en verimli şekilde bulmak için oluşturulmuştur. Trend (2 hareketli ortalama) ve tersine çevirme (RSI ve Bollinger Bantları) ile filtreleme seçeneği vardır. Çoklu para

Gösterge, ikinci mum çubuğu ilk mum çubuğunun içinde olduğunda, yani sınırlarının ötesine geçmediğinde grafikte bir sinyal gösterir. Bu mum çubuğu formasyonuna İç Çubuk denir. Bu formasyon Pin Bar veya Takeover kadar popüler değildir, ancak bazen bazı tüccarlar tarafından kullanılır. Eğilime (2 hareketli ortalama) ve tersine çevirmeye (RSI ve Bollinger Bantları) göre filtreleme imkanı vardır. Çoklu para birimi paneli mevcuttur. Yardımı ile grafikler arasında kolayca geçiş yapabilirsiniz.
Ticar
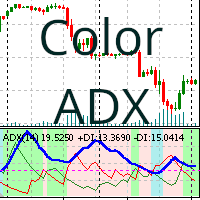
Ortalama Yönlü Hareket İndeksi (Average Directional Movement Index- ADX) göstergesi, alım veya satım trendine göre arka planı renklendirir.
ADXColor göstergesi, bir trendin gücünü ölçmek için kullanılan bir teknik göstergedir. Göstergenin arka plan rengi, parametreleri tarafından belirlenir ve yalnızca son 400 çubuğu boyar. Değiştirebileceğiniz parametreler şunlardır: Period: ADX göstergesinin zaman periyodu. Trend Level: ADX göstergesinin yükseliş veya düşüş trendi olarak kabul edilmesi için ul
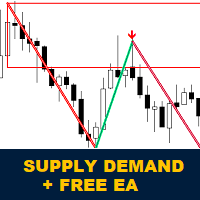
MetaTrader 4 için Koala Supply Demand Göstergesi Tanıtımı:
Koala Supply Demand Göstergesi'ne hoş geldiniz. Bu göstergeler, kesintisiz arz ve talep bölgelerini tanımlamak için tasarlanmıştır. Bu gösterge, tüccarın piyasayı bölge alanları olarak görmesine yardımcı olabilir; fiyatın bazı güçlü bölgelere nasıl saygı gösterdiğini görebilirsiniz. Ayrıca bu gösterge, bölgeler içinde oluşturulan fiyat hareketi sinyallerini de gösterebilir. Mql5 Topluluğunda Koala Trading Solution Kanalına katılın ve
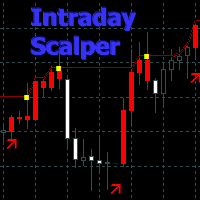
Ölçeklendirme ve gün içi ticaret için dürtü sinyallerini belirlemek üzere bir algoritma kullanan otomatik bir trend göstergesi.
Trendi takip eden gösterge, işlemler için potansiyel giriş ve çıkış noktalarını otomatik olarak hesaplar.
Gösterge, yöne bağlı olarak renk değiştiren sinyalleri takip etmek için bir trend çizgisi ve bir hedef kanal içerir.
Temel özellikleri
Sinyal renkli mumlar ve oklar: mavi - aşağı yön, kırmızı - yukarı yön. Çıkış işlemlerine ilişkin sarı noktalar, hedef kanalın har

Provides instant signals on the chart in panel form. Equipped with signal description and trading analysis tools such as drawing auto trendlines, support/resistance area, regression channel, Fibonacci levels, Pivot levels and current signal price, signal time, signal expiry and stoploss recommendation. Also sending alert messages to all available mt4 alert tool. A detailed description panel provides information about where the signal comes from and what indicators are behind the signal. Includin

One of the most powerful and important ICT concepts is the Power of 3. It explains the IPDA (Interbank Price Delivery Algorithm) phases. PO3 simply means there are 3 things that the market maker's algorithm do with price:
Accumulation, Manipulation and Distribution
ICT tells us how its important to identify the weekly candle expansion and then try to enter above or below the daily open, in the direction of the weekly expansion.
This handy indicator here helps you keep track of the weekly and

MTF Fair Value Gaps Alerts indicator is based on Fair Value Gaps (FVG), Volume imbalance (VI) and Gaps. This indicator will create 2 arrows pointing to the left showing the area of the FVG, VI and Gaps and will never repaint after the candle has been closed .
Inputs: TF (Timeframe of the Alert For Current timeframe use CURRENT)
barshilft : the barshift needs to be the same timeframe as the above TF. barshift format (CURRENT, M1, M5, M15, M30, H1, H4, D1, W1, MN) Send Email: Audible Alert Push N
FREE

The PUA MultiType Pivot indicator is built on the daily chart of the previous day. The PUA MultiType Pivot indicator is one of the most popular tools in technical analysis, used by traders to identify potential reversal points in financial markets. This indicator constructs three types of Pivot points: Classic, Fibonacci, and Camarilla, each offering its unique approach to market analysis. The advantages of this indicator include: Simplicity and Clarity PUA MultiType Pivot provides clearly defi
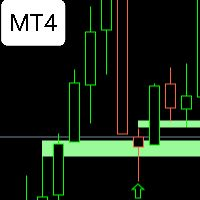
FVG WATCHER is an indicator that helps traders identify fair value gaps in the market. The indicator draws fair value gaps and alerts the user when the fair value gap has been swept. It allows users to specify how it should be swept, what time range to alert, and the size of the fair value gap to alert. It also allows the user to apply a moving average trend filter for better choice of alerts. The indicator also allows push mobile notifications. What makes FVG Watcher special is that it can be
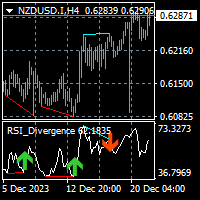
The indicator shows/alerts divergences of RSI indicator. note: You can check the free EA here that utilizes this indicator. repaint and lag issue Divergence indicators are usually repaint and lagging in their nature. You may have experienced in trading when you see a divergence on chart but the divergence continues further or just disappear. pivots_period input The smaller this value is the more and faster signals are generated. The greater this value you will have less and late signals. displa
FREE
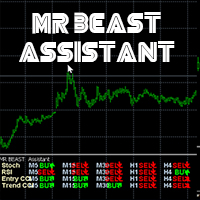
MRBEAST Assistant El indicador MR BEAST Assistant para MetaTrader es un indicador multitemporal que se basa en tres indicadores estándar: el oscilador estocástico, el RSI (Índice de Fuerza Relativa) y el CCI (Commodity Channel Index). Muestra las direcciones de la tendencia actual para los marcos temporales M1, M5, M15, M30, H1, H4, D1, W1 y MN1. Cuando se sigue un indicador de este tipo se tiene una visión clara de las tendencias en todos los marcos temporales importantes. No imp
FREE

Göstergem % 1000 asla repaint yapmayan her zaman diliminde çalışır değişken 1 tanedir siz iş yerine toplantıdatatilde olsanız bile telefonunıza bildirim gönderir ayrıca bu göstergenin robot versiyonuda vardırtek bir indicator ile gösterge çöplüğünden kurtulmuş olursunuz özellikle altın grafiğinde m1 ve m5 zaman dilimlerinde scalping için çok uygundur h1 zaman diliminde ise uzun trendleri görebilirsiniz

McS Super Trend -This is one of the most popular classic trend indicators. It has a simple setting, allows you to work not only with the trend, but also displays the stop loss level, which is calculated by this indicator. Benefits:
Instruments: Currency pairs , stocks, commodities, indices, cryptocurrencies. Timeframe: М15 and higher. Trading time: Around the clock. Shows the direction of the current trend. Calculates the stop loss. It can be used when working with trading. Three types of not
FREE

Introducing our groundbreaking indicator designed to elevate your trading strategy! Unlock the power of precise volume analysis with Buy, Sell, and Neutral indicators. Tailor your approach with customizable levels based on timeframes and moving average methods.
Key Features: Dynamic Volume Insights Instantly identify Buy, Sell, and Neutral volumes for informed trading decisions. Gain clarity on market sentiment like never before. Adaptable Level Configuration Customize and adapt levels to match

LLAMA stands for Lag-Less Adaptive Moving Average it is a state of the art moving average that is very close to the price, specially those sudden moves that put every typical moving average away from the price. This finding comes from the latest research in adaptive moving averages, with a lag close to 0
This MA keeps a very high smoothing ability while keeping a lag almost null.
This new version now adds Jurik filtering in addition to the default Simple MA for superior smoothing capability
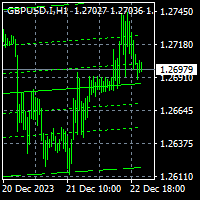
To get access to MT5 version click here . This is the exact conversion from TradingView: "Linear Regression Channel" by "LonesomeTheBlue". This is a repaint indicator. Buffers are not available for processing. You need to parse objects on chart. All input fields are available. You can message in private chat for further changes you need. Thanks for downloading
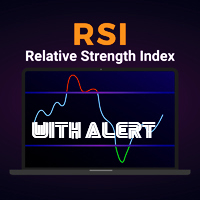
Indicador Universal RSI con Alertas de Oportunidad Este indicador para MetaTrader ha sido meticulosamente diseñado para adaptarse a todos los periodos de tiempo, proporcionando una herramienta versátil para los operadores de todos los niveles. Basado en el índice de fuerza relativa (RSI), este indicador destaca oportunidades potenciales en el mercado y te notifica de manera instantánea a través de alertas personalizadas. Características Principales: Universalidad de Periodos de Tiempo: Funciona
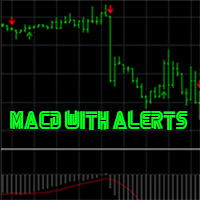
Indicador de Oportunidades MACD en Tiempo Real con Alertas de Precisión Descubre un indicador excepcionalmente preciso diseñado para potenciar tu experiencia de trading. Basado en el Moving Average Convergence Divergence (MACD), este indicador ofrece señales nítidas y oportunas, mejorando tu capacidad para identificar puntos de entrada y salida estratégicos. Además, este potente instrumento te mantendrá informado con alertas en tiempo real, proporcionándote una ventaja competitiva en los mercado
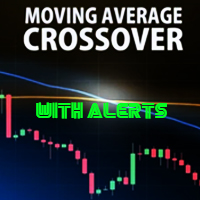
Descubre una nueva dimensión en el análisis técnico con CrossAlert MA, un poderoso indicador basado en cruces de medias móviles con funciones de alerta incorporadas. Diseñado para MetaTrader 4, CrossAlert MA utiliza la estrategia de cruce de medias móviles para identificar cambios significativos en la dirección del precio, proporcionando señales claras y oportunas. Características Principales: Cruces de Medias Móviles: CrossAlert MA aprovecha la potencia de los cruces de medias móviles para iden

PrecisionBands Descripción: Explora el mundo del trading con mayor precisión utilizando PrecisionBands, un indicador avanzado basado en las famosas Bandas de Bollinger. Diseñado para MetaTrader 4, PrecisionBands combina la versatilidad de las bandas de volatilidad con marcadores nítidos de señales de compra y venta, proporcionando una herramienta esencial para los traders que buscan tomar decisiones informadas. Características Principales: Bandas de Bollinger Mejoradas: PrecisionBands utiliza al
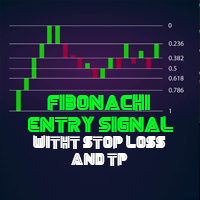
Indicador Trend and Fibonacci ProTrader Mr Beast El Indicador Fibonacci ProTrader v1.0 es una potente herramienta diseñada para optimizar tus estrategias de trading en MetaTrader, aprovechando la precisión y la lógica de la secuencia de Fibonacci. Este indicador incorpora señales avanzadas de take profit, tendencia take profit y stop loss, proporcionando una guía estratégica sólida para tus operaciones. Características Principales: Secuencia de Fibonacci Dinámica: El indicador traza automática

ndicador ADX Crossing Alertby Mr Beast El Indicador ADX Crossing Alert v1.0 es una herramienta avanzada diseñada para potenciar tu análisis técnico en MetaTrader, centrándose en las señales generadas por el cruce del Indicador de Dirección del Movimiento (ADX). Este indicador ofrece alertas visuales en el gráfico y la conveniencia de alertas via email, permitiéndote estar siempre al tanto de las oportunidades de trading. Características Destacadas: ADX Crossing Signals: El indicador utiliza el c

The Trend Analysis Indicator is an innovative tool designed for traders and investors who seek to navigate the complexities of the financial markets with greater precision and insight. This powerful indicator is engineered to adeptly identify whether a market is trending or not, offering users a vital edge in their trading strategy. Key Features: Accurate Trend Detection : The core functionality of the Trend Analysis Indicator lies in its ability to accurately detect market trends. It analyzes p

Market Structure Break Out for MT4 – Profesyonel MSB ve Kesintisiz Bölge Göstergeniz tanıtılıyor Bu gösterge sürekli olarak güncellenmektedir.
Pazar yapısına dayalı olarak yüksek derecede doğru giriş ve çıkış noktaları sağlamayı amaçlıyoruz. Şu anda 1.6 sürümündeyiz ve şimdi bize katıldığınızda aşağıdaki en son değişiklikleri göreceksiniz: Alım & Satım Hedefleri : Alım ve satım pozisyonları için en iyi kâr alma seviyeleri hakkında net bilgiler alın. Son MSB Yönü : Daha iyi karar verme için en s

Temel arz talep göstergesi , piyasa analizinizi geliştirmek ve herhangi bir grafikteki önemli fırsat alanlarını belirlemenize yardımcı olmak için tasarlanmış güçlü bir araçtır. Sezgisel ve kullanımı kolay bir arayüzle, bu ücretsiz Metatrader göstergesi size arz ve talep bölgelerinin net bir görünümünü sunarak daha bilinçli ve doğru ticaret kararları vermenizi sağlar / Ücretsiz MT5 sürümü Bu gösterge için Gösterge Tablosu Tarayıcısı: ( Basic Supply Demand Dashboard )
Özellikler
Gösterge, arz ve
FREE

Bu gösterge paneli, seçilen semboller için ticaret stratejinize bağlı olarak hem ölçeklendirme hem de uzun vadeli modda grafikteki Arz ve Talep bölgelerini keşfeder ve görüntüler. Ek olarak, gösterge tablosunun tarayıcı modu, istediğiniz tüm sembolleri bir bakışta kontrol etmenize ve uygun pozisyonları kaçırmamanıza yardımcı olur / MT5 sürümü
Ücretsiz gösterge: Basic Supply Demand
Özellikler Birden fazla döviz çiftinde alım satım fırsatlarını görüntülemenize olanak tanıyarak, arz ve talep b

Marley Göstergesi: MT4 ve MT5'te Kesin İşlemler Hem MT4 hem de MT5'te olağanüstü sinyal doğruluğu için tasarlanan Marley Göstergesi ile işlemlerinizi iyileştirin. Bu çok yönlü araç, kripto para ve forex piyasaları için optimize edilmiş olup, işlem stratejinize kesinlik ve esneklik kazandırır. MT5 ile Sorunsuz Entegrasyon: MT5 platform kullanıcıları için, Marley Göstergesi tamamen uyumlu ve buradan erişilebilir. Kripto Para ve Forex Piyasaları için Optimizasyon: Kripto Para Üstünlüğü : Dinamik
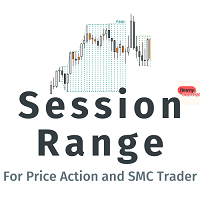
We all know that liquidity is one of the most important aspects in forex trading. The session high/low is a key part of this. That's why I created this indicator. Why Session Range? Helps traders spot session liquidity: Session high/low is one of the liquidity pools, especially during the Asian session. Helps traders know their position within a session: This indicator helps you identify which session is currently active—whether it is the Asian, London, or New York session. Good-looking app
FREE

--- FREE VERSION - WORKS ONY ON EURUSD
------------------------------------------------------------------- This is a unique breakout strategy that is used for determination of the next short term trend/move. The full system is available on MQL5 under the name "Forecast System". Here is the link --> https://www.mql5.com/en/market/product/104166?source=Site Backtest is not possible, because calculations are done based on the data of all timeframes/periods. Therefore I propose you use the technolo
FREE

"Cool volumes" arama göstergesi, Mt4'teki kene hacimlerine dayanarak oluşturulmuştur.
Göstergenin kendisi belirli bir zaman diliminde (zaman diliminin seçimi) satın alınacak veya satılacak hacimlerin sayısını izler. Ve satıcıların veya alıcıların hacimlerinde anormal bir fazlalık olduğunda, bir satış veya satın alma sinyali verir.
Alt pencerede renkli histogramlar çizilir, burada yeşil renk şu anda alıcıların üstünlüğünü gösterir, bu da belirli bir fiyat aralığındaki artışın potansiyel olarak
LuxAlgo tarafından kodlanan başka bir platformdan dönüştürülen gösterge.
Hareketli Ortalamayı farklı türde ekledim ve veri çeşitliliğini kaynakladım. Orijinal versiyonda hareketli ortalama SMA'dır ve piyasadan gelen veri kaynağı sadece mumların kapanışından toplanır.
Bu sürümde birçok hareketli ortalama türü ve ayrıca yüksek / düşük / HL2 / HLC / HLC2 / ... gibi kaynak verileri seçebilirsiniz.
İşte orijinal geliştiriciden bazı detaylar:
Range Detector göstergesi, fiyatların değiştiği aralı

CHRISTMAS İÇİN %40 İNDİRİM! 1 OCAK'TA FİYATI $250'YE YÜKSELECEK!
GoldenGate Entries Tanıtımı: Keskin Kenarlı Bir Ticaret Çözümü!
GoldenGate Entries (GGE) ile ticarette devrim niteliğinde bir yaklaşım keşfedin. GGE, ticaret deneyiminizi yükseltmek amacıyla tasarlanmış gelişmiş bir gösterge olup kullanıcılara ticaret kararlarında hassasiyet ve güven sağlamak için kapsamlı bir özellik seti sunar.
Çiftler: Herhangi biri (FX - Emtia - Hisse Senetleri - Hisse Senetleri - Kripto)
Zaman Çerçeveleri

IRDeS (Mesafe ve Spike Algılama Göstergesi) , neredeyse mükemmel bir zamanlama ile piyasaya girmeyi sağlayan sıfır seviyesinden uzaklık ve kuvvet göstergesidir. Bu, sıfır seviyesinden uzaklığı ve volatiliteyi algılayan mavi renkli sürekli bir çizgi ve sıfır seviyesinin üzerinde kırmızı renkli bir histogram ve sıfır seviyesinin altında yeşil renkli bir histogramdan oluşur. Belirli bir mumda işlemin gücünü ve kuvvetini ölçer, grafikte belirli bir noktada güçlü bir itme, yani "spike" üretir. IRDeS
MetaTrader mağazası, alım-satım robotları ve teknik göstergelerin benzersiz bir deposudur.
Yatırımcılara sunduğumuz benzersiz hizmetler hakkında daha fazla bilgi edinmek için MQL5.community - Kullanıcı notunu okuyun: alım-satım sinyallerini kopyalama, freelancerlar tarafından geliştirilen özel uygulamalar, ödeme sistemi aracılığıyla otomatik ödemeler ve MQL5 Bulut Ağı.
Alım-satım fırsatlarını kaçırıyorsunuz:
- Ücretsiz alım-satım uygulamaları
- İşlem kopyalama için 8.000'den fazla sinyal
- Finansal piyasaları keşfetmek için ekonomik haberler
Kayıt
Giriş yap
Gizlilik ve Veri Koruma Politikasını ve MQL5.com Kullanım Şartlarını kabul edersiniz
Hesabınız yoksa, lütfen kaydolun
MQL5.com web sitesine giriş yapmak için çerezlerin kullanımına izin vermelisiniz.
Lütfen tarayıcınızda gerekli ayarı etkinleştirin, aksi takdirde giriş yapamazsınız.