YouTube'dan Mağaza ile ilgili eğitici videoları izleyin
Bir ticaret robotu veya gösterge nasıl satın alınır?
Uzman Danışmanınızı
sanal sunucuda çalıştırın
sanal sunucuda çalıştırın
Satın almadan önce göstergeyi/ticaret robotunu test edin
Mağazada kazanç sağlamak ister misiniz?
Satış için bir ürün nasıl sunulur?
MetaTrader 4 için yeni teknik göstergeler - 47
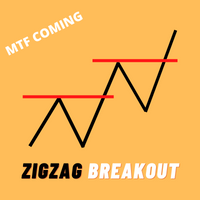
MTF Update will be soon
Price Increase Soon, It just Off price only for first 10 copies. ZigZag Breakout Arrow Very high accurate buy and sell signals provide , you can also use as market reverse signal or Trend change alert Features. ZigZag Parameters changeable. Alerts. Buy and Sell Signal. ZigZag Breakout on candle close or candle high price. and MTF Update will coming soon.
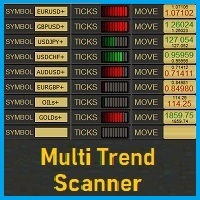
MultiTrend_Scanner is an indicator for the MT4 platform that is used to review trends on multiple symbols. We turn it on on any symbol, on any TF and we have a preview of the entire market. The current symbol is permanently assigned in the first segment of scanner. When adding another segment, you can manually enter any symbol. The quantity of added segments is unlimited. In each segment of a given symbol displayed are trends on different TFs. To calculate the strength of these trends are used
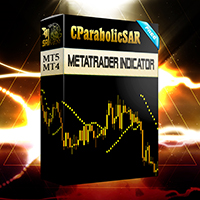
This indicator is based on ParabolicSAR. This indicator does not change the trend easily and does not change the trend until it receives a clause and approval. This indicator can be used for trail stop or trend detection.
MT5 Version
benefits:
Works on all instruments and time series,
Does not redraw its results,
Comparison depth is adjustable,
Works well with any popular strategy,
The power of the areas is adjustable,
We assure you that we we
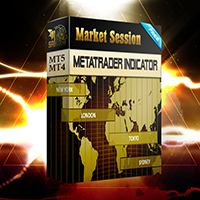
The Market Sessions Indicator for MT5 helps you predict market turnarounds by detecting major supply and demand areas. These pivot points tend to occur after a new session has started and the previous one is still open. It is also used to gauge how many points or pips the market moves on average during a session. This helps us to place better our take profits and stop losses. The indicator works on all forex pairs, gold, silver, commodities, stocks, indices and any other instrument that yo

The Market Sessions Indicator for MT5 helps you predict market turnarounds by detecting major supply and demand areas. These pivot points tend to occur after a new session has started and the previous one is still open. It is also used to gauge how many points or pips the market moves on average during a session. This helps us to place better our take profits and stop losses. The indicator works on all forex pairs, gold, silver, commodities, stocks, indices and any other instrument that your

Scalping Code is for trend scalping. It is simple to use and is profitable. It can work on any time frame and any asset. This indicator can be used on it's own or together with another system. The arrow does not repaint or recalculate.
The rules are as follows: A blue arrow above the moving average is a buy. An exit for the buy above the moving average is a red arrow or target. A red arrow below the moving average is a sell. An exit for the red below the moving average is a blue arro

Indicator MT4 : DXMA(Direction index moving average)
Objective: To track price trends and price reversals.
How to set up Indicator DXMA : 1. The standard value is EMA 12 and EMA 26, you can set it as you like. 2. UTBx 14 is Universal Trend Boundary Index, standard value 14. 3. UTBx Method is a method for calculating the standard value is Exponential.
Meaning of symbols in indicators : 1. The line of the green group means the trend is up. 2. The line of the red group represents a down trend
The Stochastic Dashboard is multi currencies and multi timeframes dashboards. It shows the Stochastic direction for the chosen pairs/timeframes. For the Stochastic lovers and manual trader this indicator is a most indicator which can be used to determine the market direction for the pair(s) you are trading. Set it to one chart only and monitor from one place all the charts you want.
Gösterge, oynaklığa bağlı olarak grafikte büyük gölgeleri otomatik olarak arar ve görüntüler. Gölgeler ayrıca dalga boyu ile filtrelenir. Algoritma, fraktalın dökümünü belirtilen aralıktaki gölgeyle analiz eder ve seviyeyi görüntüler. Ayarlardan çoklu para birimi dashboard'u etkinleştirebilirsiniz. Uyarı, mevcut program veya tüm dashboard sayfası arasında seçilir. Büyük gölgelere ve fraktal seviyeyi geçenlere yönelik sinyaller ayrı ayrı açılabilir. Blog-Link - Retest and Fake Breakout with UP
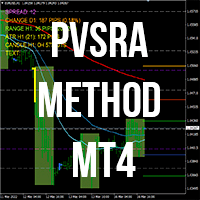
PVSRA ticaret yöntemi. Sistem, büyük oyuncuların pozisyon kazandıkları pozisyonların yönünü hesaplamaya dayanmaktadır.
PVSRA bir kısaltmadır: P - Fiyat (Fiyat), V - Hacim (Hacim), S - Destek (Destek), R - Direnç (Direnç), A - Analiz (Analiz).
PVSRA yöntemi, yuvarlak fiyat seviyelerini (ör. 1.2000) ve ara seviyeleri (ör. 1.2250, 1.2750) kullanır. Yuvarlak seviyenin altındaki konsolidasyon, uzun pozisyonlar için hazırlık, seviyenin üzerindeki konsolidasyon, kısa pozisyonlar için hazırlıktır.

Bu gösterge ile tam bir özgürlük hissedeceksiniz, artık bir ticarette saatlerce su aramanıza ve zararı durdur ve kar al seviyeleri hakkında tahminde bulunmanıza gerek yok. Şimdi her şey basitleşti. Bu sistem, o zamanlar iki popüler stratejiden esinlenmiştir: Kaplumbağa Sistemi ve PVRSA. Her iki dünyanın da en iyisini aldım ve bu harika göstergeyi yaptım.
Ticaret kuralları: Kırmızı çubuk, artan hacim anlamına gelir ve pazara girmek için bir fırsat aramanız gerekir. Net bir sinyal varsa, bir ok
FREE

Bu gösterge, RSI değerleri için çoklu zaman dilimlerinde birden fazla çifti tarar ve gerçek zamanlı olarak RSI aşırı alım değerleri için yeşil yukarı oklar ve aşırı satım RSI değerleri için kırmızı aşağı oklar çizer.
Özellikler • Hareketli satır çizimi • Boyutlandırılabilir • Yeniden konumlandırılabilir • En aza indirilebilir • Çoklu gösterge tablosu temaları • Birden çok zaman dilimi • Bir çifti tıklayarak açabilirsiniz. • Farklı bir renkle işaretlenmiş mevcut grafik çifti • Piyasa saati çif
FREE

Scalping indicator. Points show the price reversal places on the chart. Not redrawn. Minimum delay. Works on M1, M5, M30, H1, H4 timeframes. You can work on all currency pairs. The indicator can also work on gold, silver and cryptocurrencies. This indicator can also be used for binary options.
How to trade (an example of a strategy for GBPUSD)? When a blue dot appears, buy. When a red dot appears, sell. TakeProfit set to 25 points. StopLoss set 35 points. TrelingStop is set at 15 pips. Benefi

[75% OFF! - SALE ENDS SOON] - RevCan Trend Entry Point is a trend based trade alert indicator for serious traders. It does all the price and chart analysis all by itself, and whenever it finds any potential high quality trading opportunity(Buy or Sell) using its revolutionized price prediction algorithms, it sends instant trade alert directly on the chart, MT4 terminal and on the mobile device. The trade signals will be visible on the chart as Up and Down arrows, while the instant audible aler

Ready trading system. The indicator arrow shows when and in what direction you need to open an order. At the end of the blue rectangle we put TakeProfit, and at the end of the red rectangle we put StopLoss. The indicator calculates the size of TakeProfit and StopLoss automatically, depending on the market volatility and the probability of price direction. Therefore, the indicator does all the work instead of the trader. He analyzes the market himself, determines the distance for TakeProfit and

The "Spread Monitor" indicator allows you to analyze the spread change during the day, control the expansion of the spread by your broker and has a number of interesting additional features Choosing a broker with a minimum spread value is very important for the work of night advisors, scalping and intraday trading.
However, the MT4 terminal does not store spread data, so the multifunctional "Spread Monitor" indicator will be useful for any intraday trader. Features:
The indicator shows the cu
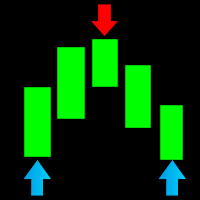
An indicator that shows price reversal points on the chart. Using RSI and other standard indicators, the indicator determines the price reversal points and shows them on the chart with arrows. The indicator does not redraw its values and in 95% of cases it shows accurate signals. This indicator works on all currency pairs and all timeframes.
How to trade with this indicator (recommendations): We recommend opening trades in the direction of the arrow that appears. If a blue arrow appears, op
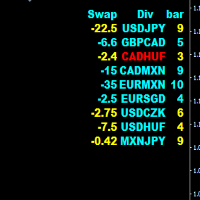
Divergence HiLo scaner is a good tool for market analysis. The indicator looks through all currency pairs and finds those that meet the selection conditions, where corrections or reversals to the main movements are supposed to begin. The indicator values are entered in the final table. 1 value is swap 2 Currency pair. 3 The number of bars after finding the selection conditions. The bar color blue is used for the buy signal. The bar color yellow is used for the sell signal. The color of the
Target Striking - One of the best binary options trading tools!
It is set up so powerfully that you can trade not only on currency pairs, but also on raw gold oil!
You can also try on cryptocurrency!
Ideal for trading on currency pairs, the percentage of reliable transactions is more than + 75%
The trading tool is already set for the best profit!
Only Target Striking can unlock the potential of the trading market for you!
With it, the signals are even and accurate without redrawing,

CHART OBJECTS: Blue box : Bullish Order Blocks (OB) Red box : Bearish OB Orange box : Mitigated OB. Price bounce from this area the made a new high/low Light gray box : Price bounced from this area but did not made a new high/low Dark gray box : Broken OB. Filled boxes : TimeFrame 1 Order Blocks
Unfilled boxes : TimeFrame 2 Order Blocks
INDICATOR SETTINGS: Order Block Required Length: Required number of subsequent candles in the same direction to identify Order Block. Default value: 5 Im

About Scanner:
Detailed blog post is here: https://www.mql5.com/en/blogs/post/749119
BB Squeeze Scanner uses bbsqueeze.ex4 in background to calculate when BB Squeeze (Bollinger Bands Squeeze) happens and when BBands expand. It is attached with the above blog post.
What is Bollinger Bands Squeeze:
The Bollinger bands squeeze is a special pattern when the volatility of a market decreases after trending periods. It is generally observed the price is ranging during this period until a

This is a multi time frame demand and supply indicator for MT4 platform. You can use multi time frame demand and supply levels on smaller time frames. Additionally you can choose to kill every level has has been tested. you have narrow bands that is you can select the whole demand and supply level or just a narrow section Finally, you also get price range for the zones. Awesome
FREE

''SKPredict'' Show you next prediction of Close/High/Low/ Open Level. This indicator Used mathematical calculations . It means, that based on the previous movement of the market, the price movement is expected to be in predicted Level. Also you can See, what Happened in previous Data and Predictions and use Buffers to write your EA. Also In ' Tendency indicator '' , as full package of Predictions that every Trader need, there is the Predict line to show you the future of Price.

Improve trading with this indicator. Find areas of buys or sells in Fibonacci retracement areas. Fulltrend is for scalping and making swing trades. Fib levels are added for take profits and stop losses. This works on any time frame and can be used by itself or together with other systems and indicators for filters. The indicator doesn't repaint. Alerts are added and can be true or false. No need to sit glued to the computer, just set on charts and listen or the alerts to come. Take a pos

Fibonacci retracements are trend lines drawn between two significant points, usually between absolute lows and absolute highs, plotted on a chart. Intersecting horizontal lines are placed at the Fibonacci levels. Fibonacci retracements are useful tools that help traders identify support and resistance levels. With the information gathered, they can place orders, identify stop-loss levels, and set price targets. Although useful, traders often use other indicators to make more accurate assessments

Gelişmiş trend filtreleme ve Uyarı göstergesine sahip MACD osilatörü. Eğilimi belirler, zayıf eğilimler filtrelenir ve trenddeki Yeni güç belirtilir. MACD Osilatörü, herhangi bir zaman diliminde ve tüm sembollerde (para birimleri, endeksler, petrol, metaller, hisse senetleri, opsiyonlar, çevrimdışı renko çizelgeleri) çalışır. 1. Kullanıcı MACD değerini değiştirebilir, 2. Minimum MACD seviye filtresi, 3. Bölme değeri, herhangi bir grafikte trend değişikliği göstergesinin gerekli olduğu güç oranı
Hızlı Ticaret - Doğru ellerde harika bir araç!
Bu da piyasaya diğer taraftan bakmanızı sağlayacak!
Görmediğiniz tüm gizli sinyaller ve dürtüler bu ürün tarafından gösterilecektir!
Tüm döviz çiftlerinde işlem yapmanızı sağlayan çoklu para birimi göstergesi.
Ürün ayrıca hammaddeler ve kripto para birimi üzerinde test ediliyor.
1-5m'den fazla olmayan zaman dilimlerinin kullanılması tavsiye edilir, bu hızlı ve akıllı ticarettir.
Tüm döviz çiftleri için tamamen yapılandırılmıştır.
kırm

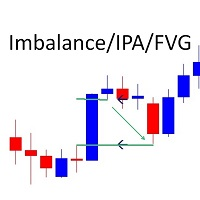
Imbalance / Fair Value Gap (FVG), this is a zone / gap created when the price move with force in a given direction. It identify a zone where the price could potentially go back. This gives perfect targets for your trades.
Imbalance is created from the high and low of 3 candles. When the wicks the of 1st and 3rd candle does not fully overlap the middle one.
This indicator will help you to easily spot mitigated/unmitigated imbalances in your chart.
NEW FEATURE Update: Multi-TimeFrame Feat
D1 Free Fibo Channels with support and resistences...
Become a constantly profitable 5-star forex trader!
We offer a few indicators to support you understand and analyse the market! With our strategies you will improve your trading system and bacome an expert...
We have indicators for trend direction, market direction and others.. for multi-time frames and that covers all majors or your favorite trading symbols! Some of them offer a customizable calculation parameters... or Graph features
FREE
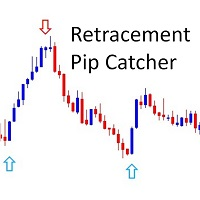
!! FLASH SALE !! Over 80% off !! For ONE week only. Now only $47 - normally $297! >>> Ends on 30 June 2023 - Don't miss it!
Buy and Sell Arrows when price is about to retrace. It Also Sends Alerts – On MT4 To Your Phone To Your Email
Does not repaint.
Works ony any pair, any timeframe.
10 Activations allowed so you are free from limitations
See an example of alerts from today (23 May 2020) using this and 2 more of my indicators here . MT5 Version here . Spreads from 0

Trend indicator Trend Esay MTF is an indicator that draws arrows directly on the price chart. Like every trend indicator, it works well with good price movement and worse in a flat. A feature of this indicator is the ability to send alerts both in the terminal and on a smartphone. The indicator menu contains the number of bars in the history of the indicator and period value for determining the trend. The "trend" function has been added to the indicator menu, which filters the indicator signals
FREE
MT4に表示している同一通貨ペアのチャート上で、水平線や垂直線、トレンドラインなどのオブジェクトを同期します。 このインジケーターを使うと、1つの時間足で作成した水平線などのオブジェクトが、同一通貨ペアの他のチャートにも同じオブジェクトが作成されるようになります。また、作成後の移動、プロパティ変更、削除なども同期することができます。
チャートオブジェクトが同期されるケース
・チャートオブジェクトの作成 ・チャートオブジェクトのスタイル変更(色、太さなど) ・チャートオブジェクトの移動 ・チャートオブジェクトの削除
対応しているチャートオブジェクト
以下24のオブジェクトに対応しています。 ・水平線
・垂直線
・トレンドライン
・平行チャネル
・フィボナッチリトレースメント
・フィボナッチ・エクスパンション
・フィボナッチ・チャネル
・フィボナッチ・タイムゾーン
・フィボナッチ・ファン
・フィボナッチ・アーク
・角度によるトレンドライン
・アンドリューズ・ピットフォーク
・標準偏差チャネル
・線形回帰チャネル
・サイクルライン
・三角
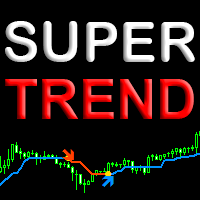
В Super Trend Line реализован один из лучших "price action" алгоритмов трендового индикатора. В связке с авторской фильтрацией это дает максимально точное определения тренда на любых трендовых валютных парах, акциях, криптовалюте без перерисовки результата. Индикатор легко настраивается и станет дополнительным помошником в вашей торговой системе. Подходит как новичкам так и профессионалам для всех видов трендовой торговли.
Как выбрать прибыльный таймфрейм и оптимизировать индикатор под валютну
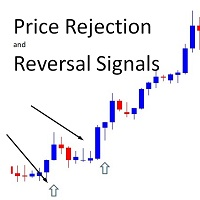
!! FLASH SALE !! Over 80% off !! For ONE week only. Now only $47 - normally $297! >>> Ends on 30 June 2023 - Don't miss it!
Buy And Sell Signal Arrows On The Chart When The Price Is About To Reverse. Also Sends Alerts – On MT4 To Your Phone To Your Email.
Does not repaint.
Works on any pair, any timeframe. (Just ajust the settings for your pair and timeframe.)
10 Activations allowed so you are free from limitations
MT5 version here . Spreads from 0.1pip RAW/ECN Acco
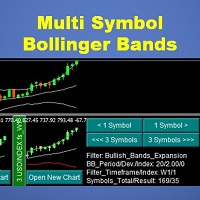
This indicator will display mini candlestick chart with Bollinger Bands indicator of the symbols that pass a filter criteria in the indicator subwindow from 1 to 10 symbols per subwindow. Feature:
Button to scroll 1 symbol, click to scroll the displaying symbols back and forth 1 symbol per click Button to scroll 1 page , click to scroll the displaying symbols back and forth 1 page(number of symbols per subwindow) per click Button to open new chart, click to force mt4 terminal to open a new cha

This indicator is excellent for scalping on the M1 or M5 chart. Uses a special algorithm for the lines. No need to set up the indicator. Does not feature any alerts and is best used manually after visually confirming the line displays. NB: Make sure to download M1 history before testing and use.
How to use: Simply attach to M1 or M5 chart. Zoom chart out completely. Sell when all lines above the white line (PriceLine). Sniper line crosses above white line. Buy when all lines below the white li

Holy Grail arrow is for scalping. The period you use will determine the trend. You can try different time frames and periods to see what works best for your strategy. Filters can be applied like a moving average or trendlines. The 1 minute works good for scalps and always trade during active periods and avoid consolidation times. Using other indicators to determine trends is recommended but this can also be a free flowing scalping system alone with tp and sl.
Inputs: Period = trend period
!! FLASH SALE !! Over 80% off !! For ONE week only. Now only $47 - normally $297! >>> Ends on 30 June 2023 - Don't miss it!
Marks Market Imbalance / Fair Value Gaps / Improper Price Action On The Chart. As traders continue to search for the best trading indicators to guide their investments, the I mbalance / I mproper P rice A ction / F air V alue G ap I ndicator has become increasingly popular. This indicator helps to identify opportunities for taking profit . Th
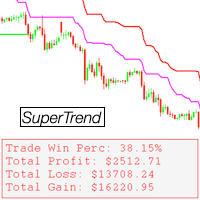
Super Trend Double Pro
- Includes the classic SuperTrend indicator x2 - Includes two indicators for much better market analysis - Comes with various settings - Comes with a display - Displays statistical win/loss information
The "Super Trend Double Pro" indicator provides the ability to combine two of the classic SuperTrend indicators into one, displaying two indicators with different settings on the same chart. The indicator comes with many customizable settings as well as a display which

This is a Manual Indicator to help Manual traders see the Trend Visually it allows you to fully control how the candle closes with many different options, and you can plot the path with many different options. This Indicator is best used in Timeframe: H1 or higher
Close Candle Methods
Close Open High Low Median Typical Weighted Close Median Body (Open+Close)/2 Average (High+Low+Open+Close)/4 Trend Biased Heiken Ashi Close Heiken Ashi Open Heiken Ashi High Heiken Ashi Low Heiken Ashi Media
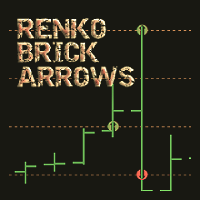
The ' Renko Brick Arrows ' indicator was developed to showcase the traditional renko brick grid pricing on chart. An alternative to using an offline chart generator for renko grid prices, and a unique charting style to strategize.
Key Features Renko bricks are drawn over the chart without having to generate a new chart. Optional horizontal lines shows where the next arrows are supposed to appear. Both one and two step reversals are available to draw arrows for buy and sell.
Input Parameters

IMPORTANT; Price is subject to rise at any time from now! Do not miss this offer! Dear trader I am glad to introduce my new tool called Trend Analyser Dashboard to you. The design, style, and settings of this indicator have been made simple to make its users not take too much time in understanding the indicator itself. The purpose is to help traders in analysing the direction of the major trend and the status of the trend whether in weak trend or its strong trend. The indicator will also prov

The Colored Volume is a simple, yet useful indicator that paints the color of the volume based on the price direction. If the price has increased, the volume will be shown in green. If the price has decreased, the volume will be shown in red. This indicator will make it super easy for traders to track volume bars based on price movements. (The settings of the volume bars including line width and color can be manually changed by the trader.)

The Forex Master Pattern is an alternative form of technical analysis that provides a framework which will help you to find and follow the hidden price pattern that reveals the true intentions of financial markets. This algorithm here does a good job detecting the Phase 1 of the Forex Master Pattern cycle, which is the contraction point (or Value).
On Phase 2 we get higher timeframe activation (also called Expansion), which is where price oscillates above and below the average price defined

Bu gösterge, ayrık Hartley dönüşümüne dayanmaktadır. Bu dönüşümü kullanmak, finansal zaman serilerini işlerken farklı yaklaşımlar uygulamanıza olanak tanır. Bu göstergenin ayırt edici bir özelliği, okumalarının grafikteki bir noktaya değil, gösterge döneminin tüm noktalarına atıfta bulunmasıdır. Bir zaman serisini işlerken gösterge, zaman serisinin çeşitli öğelerini seçmenize olanak tanır. İlk filtreleme olasılığı bu yaklaşım üzerine kuruludur - tüm gereksiz yüksek frekanslı bileşenler basitçe
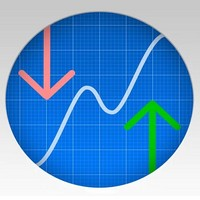
Bu filtre, Bessel polinomlarına dayanmaktadır. Ana avantajı, küçük bir zaman gecikmesidir. Bu filtrenin bir diğer özelliği de finansal zaman serilerinin en son değerlerine karşı yüksek duyarlılığıdır. Bu nedenle gösterge, gürültü sapmalarını yumuşatırken aktif fiyat hareketlerini vurgular. Klasik varyanta ek olarak, bir ağırlık fonksiyonu olarak göstergeye Bessel katsayılarının logaritmaları eklenmiştir. Bu durumda, göstergenin daha yumuşak olduğu ortaya çıkıyor, ancak aynı zamanda fiyat aktif

The indicator helps to determine the potential for price movement within the day and on a trend. For calculations, the average price movement on the instrument is used. If you have a problem setting TP, the indicator allows you not to overestimate your expectations. For volatile instruments, the SL position can also be taken into account. If the entry was in the right place, the risk / reward ratio will prompt a profitable level for profit taking. There is a reset button at the bottom of the sc
FREE

Индикатор рисует уровни Фибоначчи с выделенными Ценовыми метками.При установке индикатора на график необходимо создать трендовую линию с именем указанным в поле" Unique name of trend line to place fib on ". По умолчанию имя=" Unique name of trend line to place fib on" = "+" .В индикаторе можно заменить уровни фибоначчи по своему усмотрению.Также меняются цвет,стиль,толщина линий и т. д.
FREE
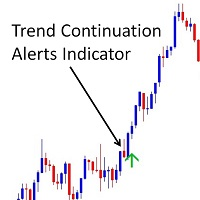
!! FLASH SALE !! Over 80% off !! For ONE week only. Now only $47 - normally $297!
Buy and sell arrows on the chart when the trend is about to continue. Aslo Sends Alerts – On MT4 To Your Phone To Your Email.
Does not repaint.
Works on any pair, any timeframe. (Just ajust the settings for your pair and timeframe.)
10 Activations allowed so you are free from limitations
See an example of alerts from today (23 May 2020) using this and 2 other indicators here . MT5 version h
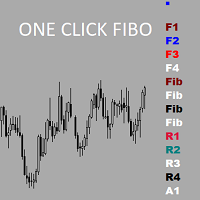
Утилита предназначена для упрощения графического анализа.Настроив один раз , можно сохранить в шаблон,все настройки сохранятся.В настройках меняются уровни фибоначчи , цвета,стили и толщина линий также текстовые метки на кнопках.Есть возможность расширить функционал , добавить временные зоны Фибоначчи ,Фибо арки ,линии по углу ,продление прямоугольных зон до текущей цены.Присылайте рекомендации,все можно осуществить в рамках бесплатной утилиты.
FREE

Market Heartbeat in your hand! Introduction The Market Heartbeat indicator with a special enhanced algorithm (volume, money flow, cycle of market and a secret value) is a very repetitive trend finder with a high success rate . Interestingly, this Winner indicator indicates that the trend has changed its direction or the end of a trend retracement or even appears at the range market. The Market Heartbeat can use in scalping trading or trend trading. It finds immediately with alarm, notification a
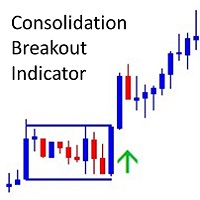
!! FLASH SALE !! Over 80% off !! For ONE week only. Now only $47 - normally $297! >>> Ends on 30 June 2023 - Don't miss it!
The Consolidation Breakout Alerts Indicator will revolutionize your trading strategy. Our innovative indicator offers unique buy and sell arrows when price breaks out from consolidation, allowing you to get in at the most optimal entry with minimal risk and maximum reward potential. Never again will you miss out on the lucrative trading opportunities available
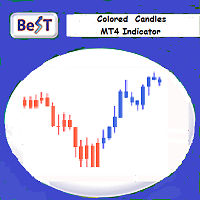
BeST_Colored Candles is an MT4 FREE indicator that can change the color of the Candlesticks based on the MACD, SAR or RSI values and levels. It is a Composite indicator that by selection uses the values each one of these 3 indicators and their critical levels in order to create numerical relationships that when satisfied cause their corresponding candlesticks coloration.
Input parameters
== Basic Settings
-- Please Select Indicator - for selecting which one of the above 3 indicator
FREE
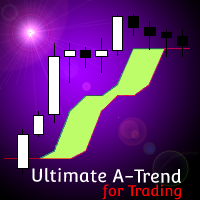
[ MT5 Version ] Ultimate Alpha Trend MT4
Ultimate Alpha Trend is the first trend indicator, which combines volatility, volume, average price and momentum. The results is a highly versatile representation of trendy and sideways market conditions, highlighting, at the same time, significant supply and demand levels. The Ultimate Alpha Trend indicator can be used to find entry oportunities and to set SLs taking into consideration current market volatility, volume and momentum. Besides that, the in

KF Trix V1.00 The triple exponential average (TRIX) indicator is an oscillator used to identify oversold and overbought markets and is also a momentum indicator. The triple smoothing of moving averages is designed to filter out price movements that are considered insignificant or unimportant. About Software details and MQL login link Copyright 2022, Forex KRAL
FREE
According to the law of nature which states that everything is a vibration, I have built this measurement model and which detects the best frequencies in the movement of the price, so just adjust the frequency in the input parameter of the candlestick watcher how are they arranged on the level lines (support/resistance). Lists of good frequencies : 236, 369,417,528, 618,741,963,1236,1484.
You can also search for the frequency that suits your asset! just use the parameter: frequency

Trend Divergence Finder – индикатор, позволяющий выявлять дивергенции цены и графика выбранного индикатора. С помощью Trend Divergence Finder вы сможете подобрать тот индикатор, который наиболее эффективен для Вас, и использовать его с наглядным отображением на графике.
В индикатор включены 9 базовых индикаторов : 1. RSI 2. MACD 3. MOMENTUM 4. RVI 5. STOCHASTIC 6. CCI 7. Standard Deviation 8. Derivative 9. William Blau
Присутст
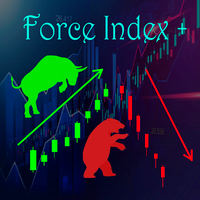
Данный помощник в торговле основан на индикаторе Force Index, хороший осцилятор для скальпинга в периоде H1, входы в сделки указаны стрелками, выходы соответственно можете определять самостоятельно, к примеру можете воспользоваться стандартным индикатором Stochastic. Данный индикатор работает только в периоде H1! В настройках при желании можете изменить цвета и период. На основе этого индикатора пишется робот, желающему пишите в лс.
Highly accurate supply and Demand indicator that gives you the exact value of where the Demand or supply ends or starts. Has built-in Alerts Has ability to change colors to whatever you want. Has special feature to automatically change when the chart crosses into a new zone or breaks free from a weak zone. Great for any Manual Trader Set your own custom alerts you can have it check the history of the chart to see how other setups of supply and demand where made in the past.

Trade any Forex combine out there. Many prop firms offer challenge or instant funding combines. The biggest problem is controlling the loss. With this indicator you can get a visual system that can limit loss and teach discipline. This uses the MACD and the strategy is scalping. You can determine the risk and reward. Visually follow small trends for scalps. Trade during active sessions. It's just a simple system to instill discipline while limiting loss and scalping pips with the paramet
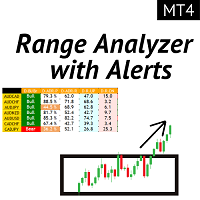
Ortalama Günlük Aralık, belirli sayıda periyot üzerinden ölçülen bir Forex çiftinin ortalama pip aralığını gösterir. Yatırımcılar, ortalama günlük hareketin dışındaki potansiyel fiyat hareketini görselleştirmek için ADR'yi kullanabilir. ADR ortalamanın üzerinde olduğunda, günlük oynaklığın normalden daha yüksek olduğu anlamına gelir, bu da döviz çiftinin normunun ötesine geçebileceği anlamına gelir.
ADR Analizörümüz 5 ana özellikten oluşmaktadır: Aralık ( ADR ) Screener: Çoklu para birimi ADR

The indicator works according to my algorithm. The algorithm analyzes 28 major currency instruments.
When installed in the terminal, the indicator automatically analyzes the consequences for the analysis. With this case, slowness when switching between timeframes.
It is possible to use the indicator as an additional tool for trading, and as the main one. There are trading signals for this. The level of clearance for the exit is always possible.
There is also an automatic indicator setting. In

Non-repaint indicator to identify trade opportunities in swing action as prices move within an upper and lower band. Inspired by the Keltner Channel, the most popular channel Indicator introduced by Chester Keltner. It is different with a Bollinger Bands. It represents volatility using the high and low prices, while Bollinger's studies rely on the standard deviation. Customized by adding the trends exactly in the middle line, arrows when price cross over the outer lines and Fibonacci Levels L

A trend indicator showing the strength of bulls and bears in a trading range.
Consists of two lines:
The green line is a balanced overbought/oversold condition. The red line is the direction of trading activity. Does not redraw calculations.
Can be used on all Symbols/Instruments/Time Frames.
Easy to use and set up.
How to use the indicator and what it determines.
The basic rule is to follow the direction of the red line:
if it crosses the green line from the bottom up, the market i
FREE

PullbackMatrix provides the key information of the trading transactions when it finds the right market moment based on its built-in logic algorithm. The high accuracy signals including Trading Symbol, Entry Price, Entry Time, TakeProfit, Stoploss, and more. And that's all will be available instantly in your chart panel, drawing the position lines and also sending signal notification to email, mobile phone, and screen popup. More important is that also saves signals into a .csv file which is usef
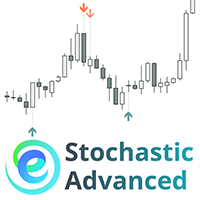
The " Stochastic Advanced " indicator displays the signals of the 'Stochastic" indicator directly on the chart without the presence of the indicator itself at the bottom of the screen. The indicator signals can be displayed not only on the current timeframe, but also on a timeframe one level higher. In addition, we have implemented a filter system based on the Moving Average indicator.
Manual (Be sure to read before purchasing) | Version for MT5 Advantages
1. Displaying the signals of the "Sto

Description of ZiqScalping The ZiqScalping indicator is designed to trade both currencies with high volatility and trend-oriented currencies.
Recommended time frame for scalping: М5, М15, М30.
Recommended timeframe for intraday trading and above: H1, D1.
Works on all pairs!
Settings : See screenshots.
Decision principle!
The indicator is based on 2MA, MACDI,OSMA. Arrows with trend directions and 2MA lines are shown graphically.
Calculations of volumes by positions are entered into
Introducing an indicator that creates signals!
Triple Signal Finder displays signals on the chart according to the readings of indicators : from one to three simultaneously. You can use 3 indicators at once and the signals will be displayed when the signals of your indicators coincide !
You can include 3 indicators , which can be both standard and self-written .
You will see the signals of your strategy on the chart and in the form of statistics . The number of signals and their success
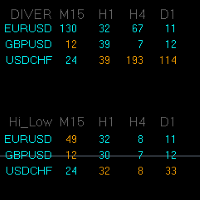
The logical continuation of the divergence indicator is the Divergence HiLo Dashboard indicator - a divergence scanner immediately for three currency pairs. In the indicator menu, select which currency pairs we will analyze. The analysis is carried out on the timeframes M15, H1, H4, D1. In addition to divergences, tops and bottoms are analyzed. All data is entered into tables Alerts are provided in the indicator. According to the logic of the indicator, the signal appears after the end of 3 bars

Trade with super Support and Resistance Breakout system.
are you looking for the most sophisticated tools for your daily trading ? this tools are perfect for you, it has a most comprehensive breakout identification spot on all market (Forex, CFD, indice, etc)
Limited offer : 10 copy for 30$
Indicator parameter: Depth: to arrange how deep to calculates the support and resistance zone Deviation Back-step
the demonstration result you can see on the media file below.
MetaTrader Mağazanın neden ticaret stratejileri ve teknik göstergeler satmak için en iyi platform olduğunu biliyor musunuz? Reklam veya yazılım korumasına gerek yok, ödeme sorunları yok. Her şey MetaTrader Mağazada sağlanmaktadır.
Ticaret fırsatlarını kaçırıyorsunuz:
- Ücretsiz ticaret uygulamaları
- İşlem kopyalama için 8.000'den fazla sinyal
- Finansal piyasaları keşfetmek için ekonomik haberler
Kayıt
Giriş yap
Gizlilik ve Veri Koruma Politikasını ve MQL5.com Kullanım Şartlarını kabul edersiniz
Hesabınız yoksa, lütfen kaydolun
MQL5.com web sitesine giriş yapmak için çerezlerin kullanımına izin vermelisiniz.
Lütfen tarayıcınızda gerekli ayarı etkinleştirin, aksi takdirde giriş yapamazsınız.