YouTube'dan Mağaza ile ilgili eğitici videoları izleyin
Bir ticaret robotu veya gösterge nasıl satın alınır?
Uzman Danışmanınızı
sanal sunucuda çalıştırın
sanal sunucuda çalıştırın
Satın almadan önce göstergeyi/ticaret robotunu test edin
Mağazada kazanç sağlamak ister misiniz?
Satış için bir ürün nasıl sunulur?
MetaTrader 4 için yeni teknik göstergeler - 29

The Trend Finding Channels indicator was developed to help you determine the trend direction by drawing channels on the graphical screen. It draws all channels that can be trending autonomously. It helps you determine the direction of your trend. This indicator makes it easy for you to implement your strategies. The indicator has Down trend lines and Up trend lines. You can determine the price direction according to the multiplicity of the trend lines. For example , if the Down trend lines s
FREE

Credible Cross System indicator is designed for signal trading. This indicator generates trend signals.
It uses many algorithms and indicators to generate this signal. It tries to generate a signal from the points with the highest trend potential. The indicator works based on instant price movements. This indicator is a complete trading product. This indicator does not need any additional indicators.
The indicator certainly does not repaint. The point at which the signal is given does not

Nice Stable Arrow indicator is designed for signal trading. This indicator generates trend signals.
It uses many algorithms and indicators to generate this signal. It tries to generate a signal from the points with the highest trend potential.
This indicator is a complete trading product. This indicator does not need any additional indicators.
The indicator certainly does not repaint. The point at which the signal is given does not change. Signals are sent at the beginning of new candle
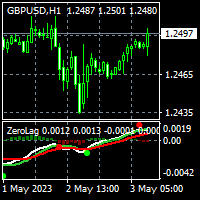
To get access to MT5 version please click here . This is the exact conversion from TradingView: "Zero Lag MACD Enhanced - Version 1.2" by " Albert.Callisto ". This is a light-load processing and non-repaint indicator. All input options are available. Buffers are available for processing in EAs. You can message in private chat for further changes you need. Thanks

This is a Non-Repaint Reversal Indicator that will send you an Alert when the signal Appears
alerts are done by Mobile, Push notification, Desktop Notification, Email Notifications The indicator can be used on all Time Frames A reversal non-repaint indicator arrow is a technical analysis tool used to identify potential trend reversals in financial markets. The arrow represents a signal that traders can use to enter or exit positions based on the direction of the arrow. The term "non-repaint" m

The Moving Average Convergence Divergence (MACD) işlem stratejisi, momentum ve trend yönündeki değişiklikleri belirlemek için kullanılan popüler bir teknik analiz aracıdır. MACD, 26 periyotlu üssel hareketli ortalamanın (EMA) 12 periyotlu EMA'dan çıkarılmasıyla hesaplanır. Ardından, "sinyal çizgisi" olarak adlandırılan 9 periyotlu EMA MACD'nin üzerine çizilir ve alım satım sinyalleri için bir tetikleyici olarak görev yapar. MACD, MACD hattı sinyal çizgisinin üzerindeyken boğa bölgesinde ve altın
FREE

Market Structure Patterns is an indicator based on smart money concepts that displays SMC/ICT elements that can take your trading decisions to the next level. Take advantage of the alerts , push notifications and email messages to keep informed from when an element is formed on the chart, the price crosses a level and/or enters in a box/zone. Developers can access the values of the elements of the indicator using the global variables what allows the automation of trading
Sweet VWAP Aux ile Zaman Kazanın ve Daha İsabetli Kararlar Verin Hala MetaTrader 4 için ücretsiz VWAP göstergemizi indirmediyseniz şimdi indirin ve sabit VWAP görselleştirme yeteneklerini deneyin. Daha sonra buraya dönün ve Sweet VWAP Aux'u keşfedin - Sweet VWAP göstergeniz için mükemmel bir eklenti. Tek bir tıklama ile, Sweet VWAP, VWAP göstergenizi seçtiğiniz noktada sabitlemenize olanak tanır, zamanınızı kurtarır ve manuel olarak yapılandırmaya gerek kalmadan işlem yapmanıza olanak sağlar. Ay
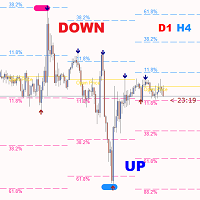
Altın ATR MTF - bu iyi bir hisse senedi teknik göstergesidir. ATR (Ortalama Gerçek Aralık) göstergesinin algoritması, varlık fiyatının hareketini analiz eder ve belirtilen zaman diliminin (D1) açılış fiyatının belirli yüzdeleri (%) cinsinden karşılık gelen seviyeleri çizerek oynaklığı yansıtır. Sembol fiyat hareketi yönünün göstergeleri (kırmızı ve/veya mavi D1 H4) ve ok sinyalleri, rahat ve karlı gün içi ticaret ve/veya ölçeklendirme için ek ve temel yardımcılardır. Günlük kazanç Forex sembo

Grafiklerinizde trend çizgileri çizme sürecini otomatikleştiren yenilikçi MT4 göstergesi Auto Trendline ile tanışın. Manuel olarak trend çizgileri çizmenin sıkıcı ve zaman alan işine elveda deyin
ve Auto Trendline'ın işi sizin için yapmasına izin verin!
* Size talimatları ve adım adım kılavuzu göndermek için satın aldıktan sonra benimle iletişime geçin .
Gelişmiş algoritması ile Otomatik Trend Çizgisi sizin için trend çizgilerini otomatik olarak algılar ve çizerek
zamandan ve emekt

Presenting the SMT Divergence indicator, a versatile tool designed to aid in analyzing market dynamics.
The indicator helps identify divergences between the highs and lows of two correlated major currency pairs during specific market periods ("killzones" abbrev. KZ). These periods are characterized by increased market activity, allowing traders to observe market behavior more closely.
The indicator provides customizable options to adjust time settings and visually display the divergences an

We teach trading with this indicator for free in our channel: https://www.mql5.com/en/channels/scalpm1period
Scalping arrow indicator M1 is an arrow signal indicator for scalping on the M1 timeframe. It draws the price reversal points on the chart for the trader and does not redraw them. The indicator shows the trader when is the best time to open a trade and in what direction. After the indicator has determined the price reversal point, it draws a red or blue arrow on the chart. These arrows

Gold TL MTF - this is a fine stock technical indicator. The indicator algorithm analyzes the movement of the asset price and reflects trend lines along the fractals of a specific timeframe (TF).
Benefits of the indicator: The indicator produces signals with high accuracy. The confirmed signal of the indicator does not disappear and is not redrawn. You can trade on the MetaTrader 4 trading platform of any broker. You can trade any assets (currencies, metals, cryptocurrencies, stocks, indices
FREE

Supply and Demand Indicator + FREE Currency Strength Meter ADD-ON Looking for a powerful tool that can help you identify the most reactive zones in the forex market? Our supply and demand indicator for MetaTrader 4 and 5 is exactly what you need. With its advanced algorithms and real-time analysis, this indicator helps traders of all experience levels make informed trading decisions. The supply and demand indicator is a cutting-edge tool that helps traders identify areas where buyers and seller

The Synthetic Trend indicator algorithm generates entry signals and exit levels. The principle of operation of the indicator is to automatically determine the current state of the market when placed on the chart, analyze historical data based on historical data and display instructions to the trader for further actions. The system itself shows in the form of arrows when to buy and when to sell. Trend trading strategy, filtering and all the necessary functions built into one tool! The indicator d

As traders, we know that identifying price contractions and consolidations is crucial for profitable trading. Fortunately, we have a powerful tool at our disposal. The indicator to trade price consolidation is designed to identify price contraction and alerts us on formation. It does this by analyzing historical price data and identifying price action patterns. The algorithm then uses this information to mark the zone , potential targets and liquidity lines, giving us valuable insights into mark

The best instrument for scalping. It allows you to always be correctly positioned in the price. It's a simple and extraordinarily powerful visual reference. Very suitable for price action. It consists of four components. 1. Fork. There are two levels that surround the price and mark the rebound points. They can be varied independently with 4 associated controls, two for each level. Its amplitude is indicated in pips in the indicator data. The minimum fork is updated with each tick. It has
This indicator is an implementation of the "One shot - one hit" principle. In the course of work on the creation of this product, an attempt was made to achieve the maximum balance between the sensitivity of the indicator and the effectiveness of its signals. This tool is as reliable and effective as a 45 caliber revolver, but in the same way it requires discipline and understanding of the conditions and purpose of use from its user. The indicator has only one adjustable parameter that determine
FREE
DF Osc AM - this is an indicator that marks the moments when the price direction changes. The indicator uses adaptive digital filters for analysis. Digital filters are (simplified) a way to smooth data. Unlike traditional moving averages, a digital filter will be more effective in most cases. The indicator does not redraw, the signal is generated after the candle is completed. It is optimal to use the indicator signals as signals to open a trade when the price overcomes the maximum or minimum o
FREE
DF Signal AM - this is an indicator that marks on the chart the moments when the price direction changes. The indicator uses adaptive digital filters for analysis. Digital filters are (simplified) a way to smooth data. Unlike traditional moving averages, a digital filter will be more effective in most cases. The indicator does not redraw, the signal is generated after the candle is completed. It is optimal to use the indicator signals as signals to open a trade when the price overcomes the maxim
FREE
This indicator displays candle prices on the chart, colored in accordance with the data of the SATL digital filter built on closing prices. The indicator has no configurable parameters. Allows you to effectively follow a long-term trend. Usage: After the full formation of a candle colored in the opposite color to the previous candle, place a stop order at the high / low of such a candle. When the price overcomes such a high/low, a position will be opened. With the full formation of a candle pain
FREE

Digital filters are (simplified) a way to smooth data. Unlike traditional moving averages, a digital filter will be more effective in most cases. The presented indicator displays in a separate window in the form of a histogram the data of several (optional) digital filters built at different (optional) prices. The indicator does not redraw on fully formed bars. The indicator allows you to effectively follow the trend both in the short and long term (depending on the type of filter chosen). The i
FREE
The indicator analyzes the divergence of the current price with the Laguerre filter data. Indicator signals: Blue dot - short-term transactions to buy an asset are allowed. Red dot - short-term transactions to sell the asset are allowed. A big blue signal - if the price breaks the high of the bar on which the signal was given - a medium-term buy trade is opened. A big red signal - if the price breaks the low of the bar on which the signal was given - a medium-term sell trade is opened. The indic
FREE
The product is based on J.F. Ehlers' Center of Gravity indicator. Center of Gravity actually has a zero lag and allows to define turning points precisely. The indicator is a result of Ehlers' research of adaptive filters. It identifies main pivot points almost without any lag. The indicator colors candlesticks in accordance with COG data.
Parameters: Length - indicator calculation period. MaPrice - price used to calculate the indicator. Signal - indicator display options. The indicator does n
FREE

This indicator displays candle prices on the chart, colored in accordance with the data of the FATL digital filter built on closing prices. The indicator has no configurable parameters. Allows you to effectively follow the short-term trend. Usage: After the full formation of a candle colored in the opposite color to the previous candle, place a stop order at the high / low of such a candle. When the price overcomes such a high/low, a position will be opened. With the full formation of a candle p
FREE
One of the standard ways to determine the direction of price movement at a particular moment is to calculate a linear regression for the values of such a price over a certain period of time. This indicator displays a line on the price chart based on the values of the linear regression of the selected price for the selected period of time. The indicator is as simple as possible and can be used within any trading strategy. The indicator is not redrawn on fully formed bars. Settings: Ind_Period - T
FREE
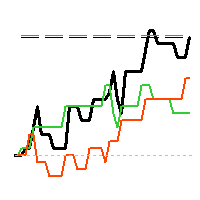
"AV Monitor" is an indicator for MetaTrader 4, which alowes a history analysis of the closed orders. It helps to achieve a quick visual analysis of your own trading or different expert advisors among themselves. Compare and analyze your expert advisors: Which one is the best?
I use an "AV Monitor MT5" indicator per running expert advisor chart to track its performance split into long & short, as well as an index chart e.g. DOW with this indicator and the setting "Show Balance & Equity" to tra
The indicator is based on the elements of Bill Williams' trading system. Sell signals are formed when MACD and OsMA values are falling simultaneously (Bill Williams calls these indicators АО and АС in his book), while buy signals appear when both indicators are rising. Thick and thin colored histograms match MACD and OsMA values. If the histogram is greater than 0, the indicator value is rising. Otherwise, it is falling. Positions should be opened when the price exceeds the bar's high or low, at
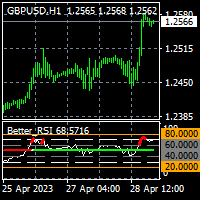
To get access to MT5 version please click here . This is the exact conversion from TradingView: " Better RSI with bullish / bearish market cycle indicator" by TradeCalmly.
This is a light-load processing and non-repaint indicator. All input options are available. Buffers are available for processing in EAs. You can message in private chat for further changes you need.

Real Strong Entry indicator is designed for signal trading. This indicator generates trend signals.
It uses many algorithms and indicators to generate this signal. It tries to generate a signal from the points with the highest trend potential.
This indicator is a complete trading product. This indicator does not need any additional indicators.
The indicator certainly does not repaint. The point at which the signal is given does not change.
Features and Suggestions Time Frame: H1

Special Entry Arrow indicator is designed for signal trading. This indicator generates trend signals.
It uses many algorithms and indicators to generate this signal. It tries to generate a signal from the points with the highest trend potential.
This indicator is a complete trading product. This indicator does not need any additional indicators.
The indicator certainly does not repaint. The point at which the signal is given does not change.
Features and Suggestions Time Frame:

OFFER! OFFER ! After 3 weeks the unlimited price will be 500$ and in the future you will regret why you didn't make a purchase at this lowest price. Dear Traders, the atomic power Entries Indicator is one of the indicators that if used wisely and correctly can help you to find an edge over the market. The indicator will work for all forex pairs, all markets and all timeframes. Still it is your duty to find the most effective timeframe for you. When the sell or buy arrow appears you will get a

^With Mixin Combiner.
^You Can Combine 10 Indicators Together To Make One Arrow In The End
^You Can Filter Time You Want To Trade.
^You Can Control Which Candle Arrow Apear On It " Bullish Or Bearsh".
^There Is An Statistics To Can Filter "What success rate of the indicators you Combined? ".
^You Also Can Control The Appearance Of The Arrows At Any Time Of The Candle , "Is It In The Beginning Or At Any Time In Particular? ".

Instantly spot simple candlestick patterns with MSHT Price Pattern
MSHT PRICE PATTERN can automatically detect more than 200 different candlestick patterns, including multi-candle patterns. This makes it easy for you to see if what you care about is present on a chart or not at a glance, and reduces the amount of time you have to stare at charts to check off items on your investment checklist. Candlestick Pattern Recognition is supported on charts, alerts, in scanners and smart checklists.
A
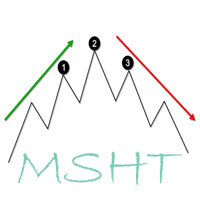
MSHT Head&Shoulders indicator for MT4 automatically scans the chart for head and shoulders candlestick patterns. Obviously, the scanner shows the Symbol, Timeframe, Direction, Pattern Name, Age, and Chart time frame in which the head and shoulders pattern is identified. Furthermore, the scanner displays the inverted head and shoulders pattern also. So, forex traders can BUY or SELL based on the head and shoulders candlestick pattern. Additionally, the indicator also scans and plots emerging head
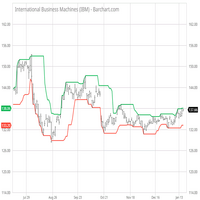
Super Pair Strong Indicator is a highly popular momentum and trend indicator that utilizes multiple currencies to determine trends. It is a one-chart indicator that combines the algorithms of the MACD and Currency Strength Meter. With its one-click feature, users can view 28 major and minor pairs on their dashboard, and by clicking on a specific pair, the chart will automatically change to the user's preferred chart. In addition to its user-friendly interface, Super Pair Strong Indicator offers

Grafiğinizde otomatik olarak destek ve direnç seviyeleri PLUS itici mum boşlukları çizin, böylece fiyatın nereye gidebileceğini ve / veya potansiyel olarak tersine dönebileceğini görebilirsiniz.
Bu gösterge, web sitemde (The Market Structure Trader) öğretilen pozisyon ticareti metodolojisinin bir parçası olarak kullanılmak üzere tasarlanmıştır ve hedefleme ve potansiyel girişler için temel bilgileri görüntüler.
Göstergede 2 TEMEL özellik ve 4 ek özellik bulunmaktadır: TEMEL ÖZELLİK 1 - Günl

Büyük kurumların işlem yaptığı yerleri keşfedin ve MetaTrader 4 için Ücretsiz Bağlı VWAP Göstergesi ile yatırımlarınızı optimize edin. Büyük kurumların işlem yaptığı fiyatı keşfedin - MetaTrader 4 için Ücretsiz Bağlı VWAP Göstergemizle! Şimdi, VWAP'lerinizi piyasanın tepelerine ve diplerine bağlı hale getirerek zamanınızı otomatik hale getirerek tasarruf edebilirsiniz. Ücretsiz sürümümüz, fare imlecinin grafikteki hareketini takip ederek VWAP'ı anında görüntülemenizi sağlar. Böylece, fiyatın VWA
FREE
Ok fiyat ters noktalarına dayalı Forex ölçeklendirme göstergesi, finansal piyasalarda işlem yapmak için gelişmiş araçlardan biridir. Tüccarlara piyasadaki değişikliklere hızlı bir şekilde yanıt verme ve fiyat hareketinin gelecekteki yönünü doğru bir şekilde tahmin etme yeteneği sağlar. Gösterge, grafikteki fiyat geri dönüş noktalarını hızlı bir şekilde hesaplamanıza izin veren modern algoritmaların ve teknolojilerin kullanımına dayanmaktadır. Her nokta, fiyat hareketinin yönünü gösteren bir okl
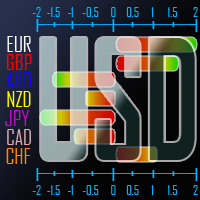
Versus USD, her bir ana para biriminin USD karşısındaki fiyat değişimini hesaplar ve grafikteki her çubuk ya da periyot, imleç tarafından belirlenen mevcut zaman diliminde performanslarının net ve karşılaştırmalı bir görünümünü, ilerleme çubukları ile gösterir. Ek olarak, diğer para birimlerine karşı USD'ye karşı en yüksek veya en düşük fiyat değişimini yaşadığı çubuk/dönemde, söz konusu para biriminin performansının daha hassas bir ölçüsünü sağlamak için bir ok işareti ile işaretler. Amerikan D

Bu, dört seans boyunca tüm seviyeleri (Açık-Yüksek-Düşük-Kapanış) görüntüleyebilen işlem seanslarının bir göstergesidir. Gösterge aynı zamanda oturum düzeylerini de tahmin edebilir. Oturumlar çizgiler veya dikdörtgenler (boş veya dolu) ile çizilebilir, çizgiler bir sonraki oturuma uzatılabilir. Kısayol tuşlarına (varsayılan olarak '1', '2', '3', '4') basarak her oturumu kolayca gizleyebilir/gösterebilirsiniz.
ASR (Ortalama Oturum Aralığı) satırlarını görebilirsiniz (varsayılan kısayol tuşu 'A

Forex 3D is a ready trading system for scalping on any currency pair. Recommended timeframe M5. The average number of transactions that we can open every day is from 5 to 15. This trading system is suitable for trading on all currency pairs, including gold and silver. Forex 3D is a very simple trading system suitable for forex beginners. It does not require additional market analysis using other trading instruments. We can focus exclusively on the technical analysis of this indicator and open o
Tanıtımımızda, işlem yapmanızı bir üst seviyeye taşıyacak devrim niteliğinde bir araç olan BreakOut Consult'u sunuyoruz! Çoklu trend ve osilatörleri birleştiren son teknoloji algoritmamız, her türlü yatırımcı için güçlü bir araç oluşturarak doğru alım-satım sinyalleri üretiyor. BreakOut Consult ile dirençli ve destek seviyelerini kullanarak dinamik kanalımız sayesinde piyasadaki kırılmaları kolayca tespit edebilirsiniz. Algoritmamız iki tür kırılma tespit eder ve altın bir fırsatı kaçırmamanızı
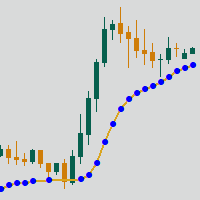
Adaptive Moving Average (AMA) is a trend indicator using moving average and market noise filter. Indicator feature are blue and red points, showing the power of trend. Recommendations for trading: Auxiliary Indicator Detecting trend Detecting power of trend Detecting potential reversal points Main indicator Shows entry points for swing trading Serves as dynamic support and resistance Recommendations for use: Any instrument Any timeframe Input parameters: Period - AMA period Fast Period - fast
FREE

"Sentiments of traders" in the financial markets is a topic that has been of interest to us for a long time. In time, we could not find the right formula to define these sentiments. We went through many stages in the search for the right methodology - from taking data from external sources to calculate open positions of buyers and sellers to calculating tick volumes, but still we were not satisfied with the results. The calculation of open positions of buyers and sellers from external sources ha

The Go Master trend indicator finds the current trend based on many factors. A simple and convenient indicator. The user can easily see the trends. It uses the basic trading approach widely described in the trading literature.
This is the first indicator designed to detect fluctuations in the direction of the trend and possible reversals. It works using a special algorithm and a set of internal indicators. You can use this indicator alone or in combination with other indicators according to y

Introducing our A.I Currency Strength Meter Forex Indicator, a state-of-the-art tool designed to provide forex traders with real-time insights into the strength of various currencies. Leveraging the latest advancements in artificial intelligence and machine learning, this innovative indicator analyzes market data in real-time, providing users with accurate and up-to-date information to inform their trading decisions. In addition to its cutting-edge algorithms, the Currency Strength Meter Forex I
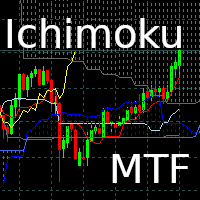
Ichimoku Hinko Hyo MTF
Ichimoku Hinko Hyo MTF is a Multi Time Frame indicator. It allows to overlap several ichimoku indicators (from different timeframes) on the same chart.
Doing this allows a better read of the market as informations are directly available to user.
It is possible to select different curves to be displayed (Tenkan, Kijoun, Chikou, Kumo)
In this version 1.0, it is possible to
On M1 chart, overlap M5 and M15 indicators.
On M5 chart, overlap M15 and H1 indicators.
On M15
Double Smoothed Stochastics – DSS Bressert is an oscillator introduced by William Blau and Walter Bressert. The calculation of DSS Bressert values is similar to the stochastic indicator. The confirmation of the indicator's signal is the overcoming by the price of the high/low of the bar on which the signal was given by the indicator.
Settings: Price - the price at which the indicator is calculated; EMA_Period - smoothing period; Stoch_Period - oscillator period;
OB_Level - overbought level;
FREE
This indicator combines the best features of a trend indicator and an oscillator. Effective trend detection and short-term price fluctuations.
Operating principle: The indicator analyzes price direction using one of many standard oscillators. If the oscillator indicates a change in the direction of price movement, the indicator signals this by placing a small arrow on the chart opposite the bar on which the oscillator gave the corresponding signal. At the same time, the main signal of the indi
FREE
The indicator is a complex of MACD and OsMA, built according to the complex of several popular oscillators. This combination allows you to get the best out of both types of indicators. On the one hand, a quick response to changes in the market environment, on the other hand, effective market following and noise filtering. The indicator values on a fully formed candle are not redrawn.
FREE
This indicator colors candles in accordance with the projected price movement. The analysis is based on the values of the classic Stochastic Oscillator. If the main line of the Stochastic Oscillator is above the signal line and above the oversold level - the candlestick is painted in color that signals a price growth; If the main line of the Stochastic Oscillator is below the signal line and below the overbought level - the candlestick is painted in color that signals a price fall. The indicator
FREE
The presented indicator displays in the form of colored candles the signals of the intersections of four RSI indicators of different periods. The candle turns red when the values of the first indicator are less than the values of the second indicator and the values of the third indicator are less than the values of the fourth indicator. The candle turns blue when the values of the first indicator are greater than the values of the second indicator and the values of the third indica
FREE
The indicator colors candlesticks of the price chart in accordance with the data of two CCI indicators from different timeframes. If both CCI indicators are above 0, the indicator paints the candle in the color that signals about price growth, and vice versa. The indicator allows to efficiently follow the trend, track short-term price rollbacks, and also to identify price reversals. The indicator does not redraw.
Settings CCI1_Period ( >1) - period of the fast CCI osc; CCI1_Price - price of th
FREE
This indicator displays the signals based on the values of the classic DeMarker indicator on the price chart. The DeMarker indicator can be used for determining the overbought or oversold areas on the chart. Reaching these levels means that the market can soon turn around, but it does not give signal, as in a strong trend the market can stay in the overbought or oversold state for quite a long time. As with most oscillators, the signals are generated when leaving these areas. This indicator all
FREE
Intelligent ZigZag indicator.
It has only two settings. The higher the values, the more significant extreme values it shows.
Application area.
To determine the trend. Line drawing direction.
To recognize multiple patterns.
If you put two indicators on one chart with fast and slow values. By changing the color of one of them, you can very well decompose the price movement into waves.
The indicator can be a great helper for marking the chart and identifying the key levels from which t

All traders wait until the market calms down and only after that will they enter the market. They look at the monitor all the time. Now you no longer need to follow this, your best assistant will do it for you. You go about your usual business and calmly wait for the signal. And as soon as the spread reaches the value you set, you will receive an instant notification on your phone.
The indicator displays elements of the trading system, name trading in the zone, described by Bill Williams. Sell signals are formed when MACD and OsMA values are falling simultaneously (Bill Williams calls these indicators АО and АС in his book), while buy signals appear when both indicators are rising. The indicator signals are confirmed when the price exceeds the High/Low of the bar where the indicator generated the signal. The indicator is intended for trend trading. Countertrend signals are
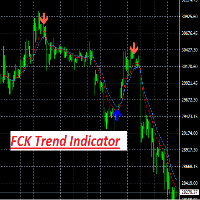
FCK Trend Indicator is an indicator for determining the current direction of price movement and reversal points. The indicator will be useful for those who want to see the current market situation better. The indicator can be used as an add-on for ready-made trading systems, or as an independent tool, or to develop your own trading systems. FCK Trend Indicator indicator, to determine the reversal points, analyzes a lot of conditions since the combined analysis gives a more accurate picture of t
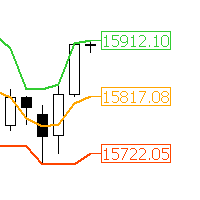
"AV Donchian Channel" is an indicator for MetaTrader 4, which shows the current prices of the donchian channels and the middle line.
Multiple AV Donchian Channel indicators can be placed on one chart. The center line can be used for trailing.
See also Richard Dennis Turtle Trader strategy.
Settings:
- Donchian Channel Period
- Colors and widths of the lines
- Colors and widths of price labels
Please report bugs to me.

Considering the main theories of Forex (Dow Theory, support lines, chart patterns, and Fibonacci retracements), It tells you the price range where whales (large investors) are likely to appear. You can trade at the price points that professionals also aim for. You no longer have to warry about where to aim next.
We are live-streaming the actual operation of the system. Please check for yourself if it is usable. Please check it out for yourself. https://www.youtube.com/@ganesha_forex
We do no
The indicator displays elements of the trading system, name trading in the zone, described by Bill Williams. Sell signals are formed when MACD and OsMA values are falling simultaneously (Bill Williams calls these indicators АО and АС in his book), while buy signals appear when both indicators are rising.
The values of AO and AC are falling - the candle is colored red. Values of AO and AC are growing - the candlestick is colored green. In other cases, the candle is colored gray.
The indic
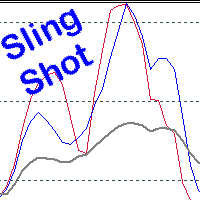
Scalping, Mean reversion or Position trading strategy
Get into an established trend on a pullback in the market. Use the Pinch in the indicator for profit taking. Use the Pinch as a mean reversion strategy, scalping back to a moving average line.
Input Parameters Fast Sling Shot configuration. Slow Sling Shot configuration. Dual Sling Shot configuration. Price line configuration. Trigger zones or levels. Example of Sling Shot trade idea: Price line sets the mood, below the baseline le

Wicks UpDown Target GJ
Wicks UpDown Target GJ is specialized in GJ forex pairs.
Choppy movement up and down on the opening range every day. Trading breakouts on London session and New York session is recommended.
Guideline Entry Strategy Idea:
Step 1 - Breakout Forming (Warning! Trade on London Session and New York Session) Step 2 - Breakout Starting (Take Action on your trading plan) Step 3 - Partial Close your order & set breakeven (no-risk) Step 4 - Target complete Step 5 - Don't tr
FREE

This Indicator is based on Mr. Dan Valcu ideas.
Bodies of candles(open-close) are the main component used to indicate and assess trend direction, strength, and reversals.
The indicator measures difference between Heikin Ashi close and open.
Measuring the height of candle bodies leads to extreme values that point to trend slowdowns. Thus quantifies Heikin Ashi to get earlier signals.
I used this indicator on Heiken Ashi charts but, it's possible to choose to calculate Body size based on
FREE

Fibonacci Currency Strength Meter (FCSM) Early Access Sale!!
This new product is still in the process of adding new features and settings. For early bird buyers. The Price will be 50% Sale. In a few weeks, the product will be done. Go Grab your copy while it's still cheap. More details will be added soon. Things to be added. Alert Levels Mobile and Email Alert
From it's name, Fibonacci Currency Strength Meter is a combination of Fibonacci levels and Currency Strength Meter. The plot of Fib
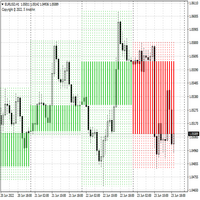
Aligning higher time frames for trading One of the main concepts behind the beginner strategy is multiple time frame analysis – using a higher time frame to determine the overall market direction and executing trades on a lower time frame. By determining the overall direction on a higher time frame and trading in that direction, you make sure that you trade in the direction of the overall trend – this increases your chances of profitable trades. In the beginner strategy, you use the 30 minute ch
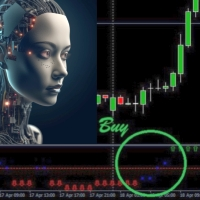
Introducing Trend Fusion 444F, a powerful MQL4 indicator designed to determine market direction using multiple trading indicators. This comprehensive tool offers a unique fusion of technical analysis techniques that help traders make informed decisions in various market conditions. Key Features: Comprehensive Analysis: Trend Fusion 444F combines several widely-used trading indicators to provide a multi-dimensional view of the market. The indicators include Moving Averages, MACD, RSI, DeMarker,
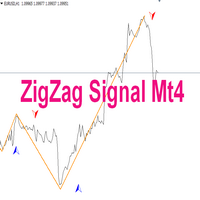
Indicator description: Indicator - ZigZag Signal is created on the basis of a well-known and popular indicator - ZigZag. The indicator can be used for manual or automatic trading by Expert Advisors. 1. The ZigZag Signal indicator has alerts of different notifications for manual trading. 2. If used in Expert Advisors, the indicator has signal buffers for buying and selling. You can also prescribe and call the indicator as an external resource and other settings and applications: (email me in a

after getting indic ator cont act me for Bonus E a. Non Repaint TMA channel with special conditioned arrows on price cross of channel lines plus market Volatility factor, which makes product much more accurate than any usual tma channel indicators. It is proven to be profitable with Ea built based on it which you will get as a BONUS in case of indicator purchase. Good luck.
MetaTrader Mağaza, ticaret robotları ve teknik göstergeler satmak için en iyi yerdir.
MetaTrader platformu için ilgi çekici bir tasarıma ve iyi bir açıklamaya sahip bir uygulama geliştirmeniz yeterlidir. Milyonlarca MetaTrader kullanıcısına sunmak için size ürününüzü Mağazada nasıl yayınlayacağınızı açıklayacağız.
Ticaret fırsatlarını kaçırıyorsunuz:
- Ücretsiz ticaret uygulamaları
- İşlem kopyalama için 8.000'den fazla sinyal
- Finansal piyasaları keşfetmek için ekonomik haberler
Kayıt
Giriş yap
Gizlilik ve Veri Koruma Politikasını ve MQL5.com Kullanım Şartlarını kabul edersiniz
Hesabınız yoksa, lütfen kaydolun
MQL5.com web sitesine giriş yapmak için çerezlerin kullanımına izin vermelisiniz.
Lütfen tarayıcınızda gerekli ayarı etkinleştirin, aksi takdirde giriş yapamazsınız.