YouTube'dan Mağaza ile ilgili eğitici videoları izleyin
Bir ticaret robotu veya gösterge nasıl satın alınır?
Uzman Danışmanınızı
sanal sunucuda çalıştırın
sanal sunucuda çalıştırın
Satın almadan önce göstergeyi/ticaret robotunu test edin
Mağazada kazanç sağlamak ister misiniz?
Satış için bir ürün nasıl sunulur?
MetaTrader 4 için yeni teknik göstergeler - 4

Piyasa önemli bir tepe veya dip yaptıktan sonra bir düzeltmeye girer ve adil değerini bulur.
Gösterge otomatik olarak hesaplanır:
Adil değer seviyesi Düzeltme kanalı Adil değerden düzeltme kanalı sınırlarına pip cinsinden mesafe İlk adil değer seviyesi mumundan başlayan ve zaman içinde genişleyen sinüs dalgası, bir kırılmadan önce beklenen maksimum ayar genişleme seviyelerini gösterir. Sinüs dalgasının kırılmasını yönlü bir hareket izler. Eğer bir kırılma olmazsa, bu destek/direnç olarak gö
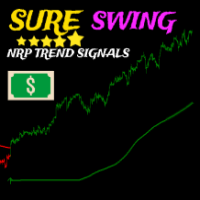
Birden fazla yerleşik göstergenin bir araya getirilmesine dayanan Sure Swing göstergesi, swing ticaret sinyalleri veren çok zamanlı çerçeve trendine dayalı bir ok göstergesidir, bu gösterge yeniden boyanmaz. Nasıl ticaret yapılır : Satın alma uyarısı içeren yeşil bir ok göründüğünde bir satın alma işlemi açın, kaybı durdurma okun altında ve kar alma minimum riskin 1 katıdır Satış uyarısı içeren kırmızı bir ok göründüğünde bir satış işlemi açın, zararı durdurma okun üzerindedir ve kar almak mini

Payne Trend, ince renkli çizgiler şeklinde olası piyasa yönünü veren bir trend filtresi göstergesidir; bu gösterge, yatırımcının mevcut gerçek trende göre alım satım kararları almasına yardımcı olur; gösterge, trendin gücünü ve zayıflığını gösteren birçok seviyeye sahiptir; bu gösterge, Yeniden boyama yapmayın veya arkasını boyamayın ve sinyal gecikmez.
===================================================
Parametreler:
Dönem: trend dönemi Mod: ma'nın hesaplama modu Fiyat : kapanış/açılış/y

"Breakout Buy-Sell" göstergesi, farklı piyasa seansları (Tokyo, Londra ve New York) sırasında fiyat kırılmalarına dayalı olarak potansiyel alım ve satım fırsatlarını belirlemek ve vurgulamak için tasarlanmıştır. Bu gösterge, traderların alım ve satım bölgelerini, ayrıca kâr alma (TP) ve zarar durdurma (SL) seviyelerini net bir şekilde görselleştirmelerine yardımcı olur. Kullanım Stratejisi Gösterge şu şekilde kullanılabilir: İlk Kurulum : Piyasa seansını seçin ve GMT farkını ayarlayın. Piyasa Gö

Indicatorul MOTANO
Bună ziua!
Tocmai am terminat indicatorul MOTANO după multă muncă.
Este un indicator de săgeată.
Merge perfect pe M15, aproape orice pereche.
Săgețile indică intrările de cumpărare și vânzare, iar o țintă de profit de 5,10 sâmburi asigură un profit sigur.
Un profit și mai mare poate fi stabilit, în funcție de situație.
Dar cuvintele sunt de prisos.
Testați-l și trageți propriile concluzii.
Notă Este posibil ca acești indicatori și experți pe care îi avem de
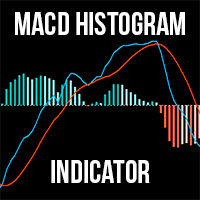
For MT5 The MACD Histogram Indicator is an enhanced version of the traditional MACD indicator, offering superior insights into market trends and momentum shifts. Unlike the default MACD in MT4, this version features a histogram , making it easier for traders to visualize and interpret market conditions. Advantages over the default MACD indicator: Enhanced Visuals: The histogram provides a bar chart representation of the difference between the MACD line and the signal line, making it simpler to i
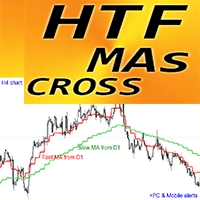
Forex Indicator "HTF Moving Averages Cross" for MT4 Upgrade your trading methods with the powerful HTF Moving Averages Cross indicator for MT4. H TF means - H igher Time Frame This indicator is excellent for Trend Traders with Price Action entries. It allows you to attach Fast and Slow Moving Averages from Higher time frame to your current chart --> this is professional method. HTF MAs CROSS has built-in Mobile and PC alerts
This indicator gives opportunity to get decent pro
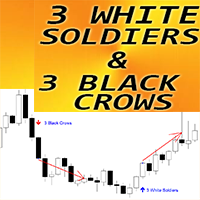
Forex Indicator " 3 White Soldiers & 3 Black Crows patterns" for MT4 Indicator "3 White Soldiers & 3 Black Crows" is very powerful for Price Action trading: No repaint, No delays; Indicator detects 3 White Soldiers and 3 Black Crows patterns on chart: Bullish 3 White Soldiers pattern - Blue arrow signal on chart (see pictures) Bearish 3 Black Crows pattern - Red arrow signal on chart (see pictures) P C, Mobile & Email alerts are included Indicator " 3 White Soldiers & 3 Black Crow
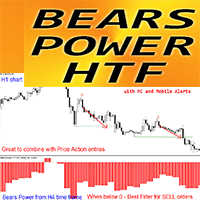
Forex Indicator Bears Power HTF for MT4 Bears Power HTF oscillator is perfect filter for "sell" entries . H TF means - H igher Time Frame Bulls and Bears Power indicators are used in trading to measure the strength of corresponding trends in trading Bears Power measures the strength of sellers' position Bears Power HTF indicator is excellent for Multi-Time Frame trading systems with Price Action entries or in combination with other indicators. This Indicator allows you to
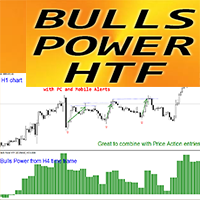
Forex Indicator Bulls Power HTF for MT4 Bulls Power HTF oscillator is perfect filter for "buy" entries . H TF means - H igher Time Frame Bulls and Bears Power indicators are used in trading to measure the strength of corresponding trends in trading Bulls Power measures the strength of buyers' position.
Bulls Power HTF indicator is excellent for Multi-Time Frame trading systems with Price Action entries or in combination with other indicators. This Indicator allows you to
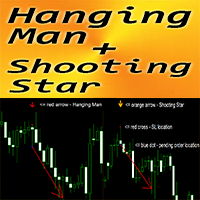
Forex Indicator " Hanging Man and Shooting Star pattern" for MT4 Indicator " Hanging Man and Shooting Star pattern " is very powerful indicator for Price Action trading: No repaint, No delays; Indicator detects bearish Hanging Man and Shooting Star patterns on chart: Bearish Hanging Man - Red arrow signal on chart (see pictures) Bearish Shooting Star - Orange arrow signal on chart (see pictures) P C, Mobile & Email alerts are included Indicator " Hanging Man and Shooting Star" is
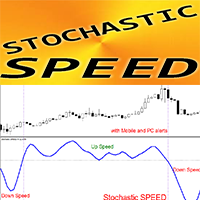
Forex Indicator "Stochastic Speed" for MT4 - great predictive tool! The calculation of this indicator is based on equations from physics . Stochastic Speed is the 1st derivative of Stochastic itself Stochastic Speed is great for scalping entries when stochastic is in Oversold/Overbought zone and Speed is making rebound hook (see pictures) It is recommended to use S tochastic Speed indicator for momentum trading strategies:
If S tochastic Speed is above 0 - this is positive sp

FREE UNLIMITED PM : https://linktr.ee/ARFXAUTOTRADE?utm_source=linktree_admin_share
Trend Line is very useful for trader friends, both for mapping following trends and counter trends, here I am sharing an auto trend line indicator I made that you can use to make it easier for you to see the market.
How to use trend line:
01. Follow our trend, wait for the trend line to return and touch our trend line and form a continuation pattern on the candle stick 02. Counter Trend We wait for 1 ca
FREE
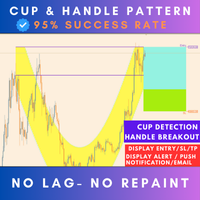
Live Trading Results MT5 Version Contact for Manual Guide Next Price $125 Free Scanner Dashboard (Contact me) Strategy - Breakout / Retest / Aggressive Hello Everyone, We are excited to introduce one of the most reliable and high win rate patterns in trading: the Cup and Handle . This is the first time we are releasing this meticulously crafted indicator, boasting an impressive 95% success rate . It is versatile and effective across all types of pairs, stocks, indices,

FREE UNLIMITED PM : https://linktr.ee/ARFXAUTOTRADE?utm_source=linktree_admin_share
Fibo Musang Break ReeTes is used as confirmation and mapping when making an entry, and generally this indicator will form when the candle makes a breakout (Mother candle or Snr). To make this indicator easier, I created an auto draw Fibo and I added a multi time frame function to the awesome oscillator indicator to make it easier to read trend verification using multi time monitoring.
The following are the
FREE
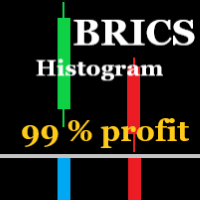
BRICS HISTOGRAMĂ Bun venit ! Cumpăra din bara albă a histogramei. Vindeți la bara galbenă a histogramei. Acest indicator este indicatorul săgeților BRICS transformat într-un indicator histogramă. Pe AUDCHF, GBPUSD, AUDJPY, NZDUSD, USDJPY funcționează foarte bine. Eu recomand – GBPUSD, M15, SL = 0 sâmburi, TP = 10 sâmburi minim. El funcționează în mod constant cu rezultate foarte bune. Alt Perechile pot da semnale mai rare sau pot avea unele pierderi sau nu funcționează. Indicatoare

"Trend Finder" is a trend trading strategy that combines market noise filtration and all necessary functions in one tool! The system automatically displays entry and exit points using arrows. Only one parameter is sufficient for configuration. It offers simple, intuitively understandable, and effective trend detection. The intelligent algorithm of the "Trend Finder" indicator identifies potential market reversal points. Often, a good trend can be visually observed on the price chart. However, a

Liquidity Pro The Liquidity Pro pin points liquidity zones in any financial instrument, including currency pairs, cryptocurrencies, commodities, equities and indices. The Liquidity Pro shows previous and current liquidity zones, down to the present minute, providing essential information about your chosen trading pair, when conducting chart analysis or initiating trades. Remember each trading pair requires a different price separation value for M5, M15 and M30 Tally, to provide accurate data. Y

Chart Clarity Dashboard The Chart Clarity Dashboard provides clear insights into price movements for various financial instruments like currency pairs, cryptocurrencies, equities, commodities, and indices. This dashboard displays detailed price information in real-time, making it easier for traders to make decisions quickly. It shows price movements down to the second, giving you essential data before you trade or analyze charts. Chart Clarity Dashboard allows you to monitor price changes acros

Backtest with good trend detection results from January 2023
EURUSD Time frame: m15, m30, H1
AUDUSD Time frame: m15, m30 NASDAQ Time frame: m15 S&P 500 Time frame: m15, m30 XAUUSD Time frame: m30 BTCUSD Time frame: H4
These are just some of the assets tested (Please note that past results are no guarantee of future results). Note that this is not a complete strategy, you can use this indicator as an entry trigger after your analysis by setting stop loss and take profit values that you d

Volume Clarity Pro The Volume Clarity Pro provides clarity in the movement of price for any financial instrument, including currency pairs, cryptocurrencies, equities, commodities and indices. The Volume Clarity Pro maps out where price is consolidating, retracing, resisting or settled in areas of support. The Volume Clarity Pro accurately displays the month's price action, offering crucial data about your selected trading pair for chart analysis and trade initiation. The Volume Clarity Pro is

The Your Honor trend indicator is based on price divergence and is designed to analyze and determine market entry points. It can also be used as a filter in trading. The indicator has only two parameters: Period and Level. The Level parameter helps eliminate unnecessary signals. For example, for EURUSD the Level can be set, for example, to 0.0001. Your Honor can be used to both identify entry points and filter signals. The indicator displays information in a clear manner. It is important to reme
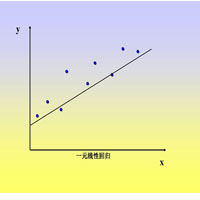
This index is used to calculate the linear regression slope of the K line in a period of time. The algorithm adopts the least square method.
1. Suitable for each cycle chart.
2. Can be used to calculate opening price, closing price, high price, low price, middle price.
3. Specify the start time and end time in the parameters.
Note that the start time and end time cannot be weekends, select the calculated price, pay attention to capital letters.
FREE
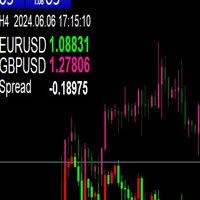
This indicator can be used to add a candle chart of another variety to the chart of the current variety.
1. The chart height will be adjusted automatically
2. If you switch the current icon period, the K of another variety will also switch to the corresponding period
3. In the upper left corner of the chart, the current cycle, the current time, and the current price and spread of the two targets will be displayed.
4. When switching cycle, due to a large number of data retrieval, it wi
FREE
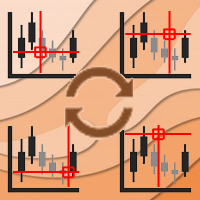
Async Charts is an indicator to synchronize charts and display a customized crosshair (cursor) on all selected charts. This is a useful utility for traders using multiple timeframes of analyzing multiple symbols for trade entry or exit.
Main Features : Real time Crosshair Synchronization on All Selected Charts
Supports Multiple Timeframes and Multiple Symbols at the same time
Auto Scroll Option
Graphical Adjustment of Color, Font, Size, ...
Locking All or Locking Specific Charts
More and

The indicator is a set of parameters for setting three moving averages (fast, medium and slow), which can be used to analyze the market.
This indicator provides the ability to analyze market trends and make trading decisions based on the intersections of various moving averages. It also supports audio alerts for timely notification of trading signals.
LengthFaster: Sets the number of candles used to calculate the faster moving average. A value of 5 means using price data from the last 5 can
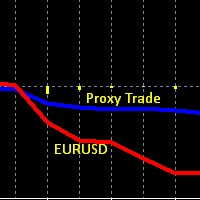
This is an obscure Hedge Fund like strategy, based one of our early indicators on EURUSD originally intended for day trading, while developing and testing the indicator we found out that the data used in this indicator (set of 4 currency pairs) follows EURUSD in a very peculiar way. On one hand these two are correlated, but the 4 currency proxy set tends to lag behind EURUSD, it lags on a day to day basis, and then catches up eventually after several days. And therefore can be used as a proxy

YK-Fibo Pivot Indicator: Trade Smarter with Fibonacci Pivot Points The YK-Fibo Pivot Indicator is a powerful technical analysis tool that combines the precision of Fibonacci retracements with the insights of Pivot Points. Whether you're a novice or seasoned trader, this indicator empowers you to spot profitable opportunities in the market with ease. Why Choose YK-Fibo Pivot? Pinpoint Support & Resistance: By calculating Fibonacci levels based on the previous day's high, low, and close prices, y

Introducing Smart Gold Pro, a versatile trading indicator suitable for all experience levels. It provides precise buy and sell signals for the gold market, adaptable to any timeframe. Powered by advanced algorithms, Smart Gold Pro accurately analyzes price movements and volume dynamics. What sets Smart Gold Pro apart is its reliability—it doesn't repaint past signals, ensuring dependable insights into potential market reversals. Its user-friendly visual interface on the chart, along with audible
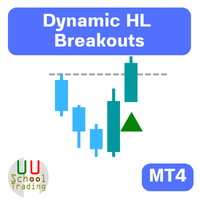
Description of Using the Dynamic HL Breakouts Indicator The Dynamic HL Breakouts indicator is a technical tool designed for trading trend-following assets. Its main purpose is to help traders identify key entry and exit points during strong trending periods of an asset. Components of the Dynamic HL Breakouts Indicator Highs and Lows This indicator calculates and displays the High and Low values for a specified period (e.g., the past 20 days) to create a price movement range for the asset. These

Trading Dashboard is a useful tool for your multiple trades. It contain information such as : - Breakeven point(price) of your multiple trades, - Loss point(price) of your trades, - Current Trading Day and Session, - Current Time and time left of candles, - Total Lot Buy & Sell, and sum of it - Spread and ATR of current time frame and symbol - Profit-Loss in percentage of your open trade

The RPO (Relative Price Oscillator) is a technical analysis indicator used in Forex trading to measure the momentum and trend strength of a currency pair. It is derived from the Relative Strength Index (RSI) but focuses on the difference between two moving averages of price, usually the closing price, over different periods. The RPO is similar to the MACD (Moving Average Convergence Divergence) but uses relative price levels instead of absolute price levels. Key Components: Short-Term Moving Ave

Description of Fibonacci Levels for Support and Resistance (SNR) with a Statistical Model Fibonacci levels are widely used in technical analysis to identify potential support and resistance levels in financial markets. These levels are derived from the Fibonacci sequence, a mathematical sequence where each number is the sum of the two preceding ones. The key Fibonacci retracement levels are 23.6%, 38.2%, 50%, 61.8%, and 100%.
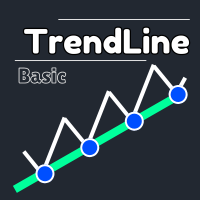
Bu güçlü araç, trend çizgilerini otomatik olarak tanımlar, ticaret stratejinizi kolaylaştırmanıza ve daha bilinçli kararlar vermenize yardımcı olur. mt5 sürümü
Temel özellikler Otomatik Trend Hattı Algılama : "Temel Trendline" göstergesi, potansiyel trend çizgileri için pazarı tarar ve bunları anında gösteriyor.Bu size değerli zaman kazandırır ve asla önemli bir eğilimi kaçırmanızı sağlar. Kullanıcı dostu panel : Göstergemiz, çeşitli trend çizgileri kolayca çizmenizi sağlayan güzel, sezgisel b
WONNFX iN M5 - Arrow indicator for Forex and Binary Options. Reliable signal algorithm. Indicator not repaint. Indicator working hours: 21:55-23:00. GMT+2. Average winrate = 60-70%.
Recommendations: Timeframe: M5. Expiration: 2-3 candles (1 candle = 5 minutes) Symbol: EURUSD, USDJPY, EURAUD, GBPAUD, EURJPY, AUDUSD, USDCAD, NZDUSD, AUDCAD, AUDCHF, AUDJPY, AUDNZD, CADJPY, EURCAD, EURGBP, GBPUSD, GBPCAD, NZDJPY, CADJPY, XAUUSD
FREE

BRICS göstergesi
Sayfamıza tekrar hoş geldiniz!
Beyaz oktan alışveriş yapın. Sarı okta satış yapın.
O çok basit.
Ayrıntılara girmeyeceğim.
Yeterli tecrübe ve bilgiye sahip olduğunuza eminim.
Ekteki görsellerin bu göstergenin gücünü çok açık bir şekilde gösterdiğini düşünüyorum.
AUDCHF, GBPUSD, AUDJPY, NZDUSD'de çok iyi çalışıyor.
Diğer çiftlerde daha nadir sinyaller verebilir veya bir miktar kayıp olabilir.
Sadece dene!
Ben de işe koyacağım.
Başarı! Trimiteți feedback Pano

Introducing our exciting new Price Retest indicator! Get instant alerts when the price retests, giving you a powerful edge in your trading strategy. Remember to do your own analysis before making any moves in the market. MT5 Version - https://www.mql5.com/en/market/product/118159/ Here’s a detailed explanation of how the Price Retest indicator works, its components, and how you can incorporate it into your trading strategy: The Price Retest indicator is designed to notify traders when the pric
FREE

Renko Masterx, renko grafikleriyle işlem yapmak için tasarlanmış mt4 ok tipi bir göstergedir, bu gösterge, tüccara kazanma oranı ve kazanılan puanlar gibi yararlı bilgileri söyleyen bir geriye dönük test panosuna sahiptir, ayrıca atr x çarpımında tp ve sl'yi verir, bu gösterge onun değerini verir. Çubuk açık veya çubuk içi sinyalin verildiği ve sinyalin verildiği tam fiyatı işaretleyecek beyaz bir işaretleyicinin bulunduğu bu göstergeyi kullanmanın yolu, göstergenin verdiği oka göre bir alım ve

Örümcek renko oku, çubuk açık/iç çubukta sinyal veren ve sinyali çizmek için 2 strateji kullanan renko tabanlı bir ok göstergesidir. Bu gösterge, bir çubuk TP'yi ölçeklendirmek için veya ayarlarında daha yüksek periyotlarla kullanılırsa ticareti değiştirmek için kullanılabilir. Bu gösterge asla yeniden boyamaz veya arka boyama yapmaz. =================================================== ======= Parametreler: Giriş Dönemi : ana sinyal dönemi Filtre Periyodu : sinyal filtre periyodu Uyarılar =====

İkili atm, 2 parçaya dayanan bir ikili opsiyon sinyalleri göstergesidir, ilki trend yönünü söyleyen ve yalnızca satın alımlarda satışları belirleyen renkli bir çizgi şeklindedir, ikincisi BAR AÇIK üzerine gelen ve asla yeniden boyanmayan ve gecikmeyen bir nokta şeklinde bir giriş sinyalidir.
NASIL KULLANILIR :
Çubuğun açılışında bir satış noktasının görünmesini bekleyin Önceki çubuğun bir satış çizgisi rengi varsa, bir satış açmaktan ziyade, vade tarihiniz aynı mum kapanışıdır
Çubuğun açı

BMW M5, scalping için tasarlanmış yüksek hızlı bir göstergedir ve en küçük zaman dilimleri olan M1 ve M5 de dahil olmak üzere herhangi bir zaman diliminde fiyat yönü değişiklikleri için son derece doğru ve hızlı sinyaller sağlar. Tüm döviz çiftlerinde çalışır ve yatırımcıların piyasayı gün içi scalping ticaret sistemi kullanarak analiz etmelerini sağlar. M1 ve M5 zaman dilimlerinde çalışarak, yatırımcılara her gün onlarca giriş sinyali sağlar. Kullanım Tavsiyeleri: Gösterge kırmızı çizgiden mavi

We have combined all of our beloved indicators the likes of: Key level order block , Key level supply and demand , Key level liquidity grab and Key level wedge into one single indicator and dashboard.
Whats new Dashboard : There is an easy access dashboard for all your needs. Multi-timeframe button : There is now a multi-timeframe option for Order Blocks and Supply and demand zones, making it easy to see higher timeframe zones easily on the current timeframe by just clicking the desired timefr
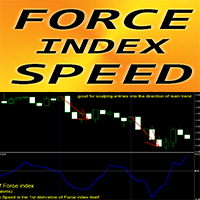
Forex Indicator " Force index Speed" for MT4 The calculation of this indicator is based on equations from physics. Force index Speed is the 1st derivative of Force index itself F orce index is one of the top indicators that combines price and volume data into a single value Force index Speed is good for scalping entries into the direction of main trend: u se it in combination with any suitable trend indicator Force index Speed indicator shows how fast Force index itself changes its d
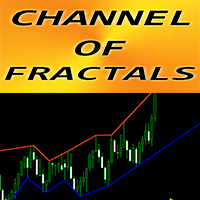
Forex Indicator "CHANNEL of FRACTALS" for MT4 This indicator is showing actual local Trend lines based on Highs/Lows of Fractals Great for traders who use Graphical Analysis Resistance local trend lines - Red color Support l ocal trend lines - Blue color It has few parameters responsible for number of fractals, trend line colors and width // More great Expert Advisors and Indicators are available here: https://www.mql5.com/en/users/def1380/seller // Also you are welcome to join to pro

Forex Indicator " Hanging Man pattern" for MT4 Indicator " Hanging Man pattern " is very powerful indicator for Price Action trading: No repaint, No delays; Indicator detects bearish Hanging Man patterns on chart: Red arrow signal on chart (see pictures) PC, Mobile & Email alerts are included Indicator "Hanging Man pattern" is excellent to combine with Support/Resistance Levels : https://www.mql5.com/en/market/product/100903 // More great Expert Advisors and Indicators are available he
Engulfing Candle Signal Alert: Elevate Your Trading Strategy Unlock the full potential of your trading with the Engulfing Candle Signal Alert, the ultimate tool for identifying market reversals and enhancing your trading precision. Designed specifically for traders who value accuracy and timely alerts, this powerful indicator detects engulfing candle patterns, a key signal in technical analysis that often indicates a potential shift in market direction. What is an Engulfing Candle? An engu
FREE

Advantages of the Tick Volume Indicator: Identifying Market Sentiment : A predominance of green bars on the histogram may indicate an uptrend or strong buying pressure, useful for determining entry points for long positions. A predominance of red bars indicates a downtrend or strong selling pressure, useful for determining entry points for short positions. Analyzing Market Activity : The indicator helps identify periods of high activity, when significant changes are occurring in the market, and
FREE UNLIMITED PM : https://linktr.ee/ARFXAUTOTRADE?utm_source=linktree_admin_share
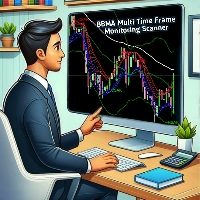
This BBMA FULL SETUP Scanner indicator is based on Multi Time Frame Monitoring and can be used for direct entry when a signal appears. Rules for Using Indicators: 1. Wait for Full Setup BBMA / EMA 50 Cross Mid BB 20 2. Wait for Reentry / Reetes CANDLE when CSAK / CSM occurs 3. Stop Loss Candle CSAK / CSM is formed 4. Take Profit = 2-5 x Stop Loss Distance If you want to use this indicator for free and unlimit
FREE
Elegant RSI indicator can generate RSI divergence with the availability of user defined filters. It can generate voice alerts for RSI oversold and RSI Overbought situations. Moreover it can also generate voice alerts for RSI Divergneces as well as when price breaks above or breaks below the support and resistances created upon divergence ouccurence. The voice alerts are generated in a way that you will know which market has reached the oversold and overbought conditions as well as the rsi Dive

FREE UNLIMITED PM : https://linktr.ee/ARFXAUTOTRADE?utm_source=linktree_admin_share
Bagaimana Cara membaca market melalui FMCBR-W - Didalam dunia trading ini pelbagai cara digunakan oleh trader dan penganalisa market membaca dan memahami trend. - Dari sudut FMCBR permulaan trend atau permulaan pullback dikenali melalui CB1. Apa pun dari sudut FMCBR-W trend didefinasikan melalui 3 combinasi yang saya akan kupas di muka surat seterusnya nanti. - Saya amat berharap agar pengunaan FMCBR-W nanti
FREE

The Awesome ATR Indicator is a technical analysis tool developed for the MetaTrader 4 (MT4) platform. This indicator is designed to assist traders in determining stop loss and take profit levels based on the average value of the Average True Range (ATR). By leveraging the market volatility data provided by ATR, this indicator offers more accurate and dynamic guidance in setting these crucial trading levels. Key Features: Dynamic Stop Loss Determination: Calculates stop loss levels based on the A
FREE
Sync Cursor MT4 Sync Cursor MT5 https://www.mql5.com/en/market/product/118259 MT4 Tool will It make the Horizontal Line + Vertical Line in the Screen That it is always present on the screen and that it moves along with the candle (with the price). I am sure that something so simple will be a Treasure in the hands of many people. Some of my personal trades are posted voluntary and free of charge in this Public channel https://t.me/FXScalpingPro Contact: https://t.me/TuanNguyenTrader
FREE
ダイバージェンス はオシレーター系のテクニカル指標が、実際の相場とは逆方向に向かって動いている状態のことを指し、その後のトレンド転換の可能性を示す戦略として有効です。
このインディケータは特に有効性の高いMACDのダイバージェンスを利用した 裁量トレード用サインツールです。
高頻度かつ高い 勝率で サインを発信しますが、各種の強力なフィルターにより、さらに精度の高いサインに絞ることが出来ます。また、通常のダイバージェンスに加えリバーサル( 隠れダイバージェンス) によるサイン発信も可能です。
全通貨ペア、全タイムフレームで利用できます。勝敗判定機能により、このインディケータの直近の相場環境に対する有効性を確認できます。
設定項目は以下の通りです。 Enable Divergence...MACDのDivergenceによるサインの発信を有効にします。ピンクの矢印が表示されます Enable Reversal...MACDのReversal(Hidden Divergence)によるサインの発信を有効にします 。ブルーの矢印が表示されます Fast EMA Pe

Using this indicator, you can see the moving average of 7 time frames in (one time frame) the same time frame you are.
You can also set orders to enter buy or sell positions automatically when the price hits Moving.
You can also set orders to risk free or close existing positions when the price hits Moving.
Also, receive a notification on your mobile phone when the price hits Moving.or position will be risk free or close .

PTW NON REPAINT TRADING SYSTEM + HISTOGRAM Non-Repainting , Non-Redrawing and Non-Lagging Trading System.
Does the following: - Gives Accurate Entry and Exit Points - Scalping, Day and Swing Trading - 95% Accuracy - Targets, where to take profits. - Shows Trends, Support and resistance levels - Works on All Brokers - Works on All Currencies, CFDs and Stocks - It does not place trades for you, it only shows you what trades to place. - It works on All Timeframes - It is for Trend or ra

POWER TO GET WEALTHY TRADING SYSTEMS.
NON REPAINT REVERSAL ARROW AND CHANNEL Intra-Day trading and Scalping Strategy: Designed for fast and accurate day trading and short-term trades.
Day and Swing Trading Strategy: Can be used as a reliable tool for day and swing traders who aim for the big moves of the price.
Multi Currencies and Markets: Works on different instruments and markets with its reliable precision.
Multi Timeframes: Can be used on multiple timeframes with good perfor

Manual guide: Click here WEEK SALE PROMO: $59 ONLY! -- Next price is $120 .
This indicator is unstoppable when combined with our other indicator called Support & Resistance . After purchase, send us a message and you will get it for FREE as a BONUS! I like to use Trend Punch on XAUUSD on the M1 timeframe & higher ones! Introducing Trend Punch , the revolutionary forex trend indicator that will transform the way you trade! Trend Punch is uniquely designed to provide pre

Fractals Dynamic Fractals Dynamic – sol ve sağdaki çubukların sayısını manuel olarak ayarlayabileceğiniz ve böylece grafikte benzersiz desenler oluşturabileceğiniz, Bill Williams tarafından değiştirilmiş bir serbest fraktal göstergedir. Artık Fraktallar Dinamik göstergesine dayanan veya temelinde bulunan tüm ticaret stratejilerinin ek bir sinyali olacaktır.
Ek olarak, fraktallar destek ve direnç seviyeleri olarak hareket edebilir. Ve bazı ticaret stratejilerinde likidite seviyelerini göster
FREE
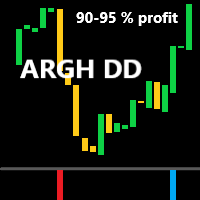
ARGH DD alım satım göstergesi
Bu gösterge bir histogram göstergesidir.
Çok az sayıda yanlış pozitif içeren güçlü ve doğru bir göstergedir.
Tetikledikleri işlemler günlerce veya haftalarca süren işlemlerdir.
Ancak bunlar oldukça istikrarlı işlemlerdir.
Elbette giriş kuralları çok basit:
️mavi histogram çubuğu bir satın alma pozisyonunun açıldığını gösterir;
️kırmızı histogram çubuğu bir satış pozisyonunun açıldığını gösterir.
Bir işlem açıldıktan sonra piyasanın bir süreliğine

Market Noise Piyasa Gürültüsü, fiyat grafiğindeki piyasa aşamalarını belirleyen ve aynı zamanda bir birikim veya dağıtım aşaması meydana geldiğinde net, yumuşak trend hareketlerini gürültülü düz hareketlerden ayıran bir göstergedir.
Her aşama kendi ticaret türü için iyidir: trendi takip eden sistemler için trend, agresif sistemler için ise yatay. Piyasa gürültüsü başladığında işlemlerden çıkmaya karar verebilirsiniz. Aynı şekilde ve tam tersi, gürültü biter bitmez agresif ticaret sistemlerini

LEVELSS göstergesi gösterir:
- Günlük yükseliş ve düşüş bölgesi. Her gün 00:00 ile 23:59 arasında görülebilir. - Haftalık yükseliş ve düşüş bölgesi. Her hafta Pazartesi 0:00'dan Cuma 23:59'a kadar görülebilir. - Diğer tüm zaman dilimlerinde görüntülenen belirli bir zaman diliminden özel olarak hesaplanan kanal. Varsayılan olarak, bu, işlem yapmak istediğiniz diğer zaman dilimine değiştirebileceğiniz 4 saatlik zaman dilimidir. Kesintisiz olarak hesaplanır.
Ekranın sol üst köşesinde, bölgele

Basic Support and Resistance Göstergimiz, teknik analizinizi artırmak için ihtiyacınız olan çözümdür.Bu gösterge, destek ve direnç seviyelerini grafikte yansıtmanıza olanak tanır/ MT5 sürümü
Özellikler
Fibonacci seviyelerinin entegrasyonu: Fibonacci seviyelerini destek ve direnç seviyelerinin yanı sıra görüntüleme seçeneğiyle, göstergemiz size piyasa davranışı ve olası tersine dönme alanları hakkında daha derin bir fikir verir.
Performans Optimizasyonu: Genişletilmiş satırları yalnızca he
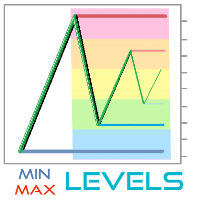
MinMax Levels MinMax Levels – önemli işlem dönemleri (gün, hafta ve ay) için maksimum, minimum ve açılış fiyat seviyelerinin göstergesidir.
Her Forex piyasası katılımcısı kendi ticaret sistemindeki seviyeleri kullanır. İşlem yapmak için ana sinyal veya analitik bir araç görevi gören ek bir sinyal olabilirler. Bu göstergede günler, haftalar ve aylar büyük piyasa katılımcılarının kilit işlem dönemleri olduğundan önemli dönemler olarak seçilmiştir. Bildiğiniz gibi fiyatlar seviyeden seviyeye
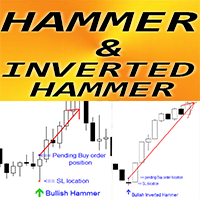
Forex Indicator " Hammer and Inverted Hammer pattern" for MT4 Indicator " Hammer and Inverted Hammer pattern " is very powerful indicator for Price Action trading : No repaint, No delays; Indicator detects bullish Inverted Hammer and Hammer patterns on chart: Bullish Inverted Hammer - Blue arrow signal on chart (see pictures) Bullish Hammer - Green arrow signal on chart (see pictures) P C, Mobile & Email alerts are included Indicator " Hammer and Inverted Hammer pattern
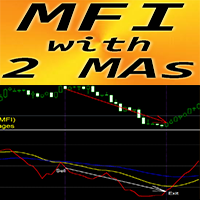
Forex Indicator "MFI and 2 Moving Averages" for MT4 M oney Flow Index (MFI) is a technical oscillator which uses price and volume data for identifying oversold and o verbought zones " MFI and 2 Moving Averages" Indicator allows you to see Fast and Slow Moving Averages of MFI oscillator Indicator gives opportunities to see the trend change very early It is very easy to set up this indicator via parameters, it can be used on any time-frame You can see Buy and Sell entry cond
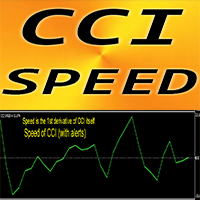
Forex Indicator " CCI Speed" for MT4 The calculation of this indicator is based on equations from physics. CCI Speed is the 1st derivative of CCI itself Commodity Channel Index (CCI) measures the difference between the current price and the historical average price
CCI Speed is good for scalping entries into the direction of main trend: u se it in combination with any suitable trend indicator CCI Speed indicator shows how fast CCI itself changes its direction - it is very sensit
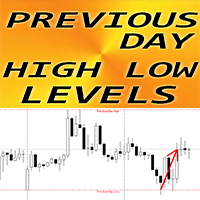
Forex Indicator "Previous Day High Low levels" for MT4 Indicator "Previous Day High Low levels" is very useful auxiliary indicator Yesterday High and Low levels are so important because price very often rebounds from them These levels can be considered as reliable Support and Resistance - price respects them very much It is useful indicator for intraday traders to who use Reversal trading methods and scalping Very good to combine with Price Action as well // More great Expert Advisors and I

Forex Indicator " ATR Trailing Stop" for MT4 Upgrade your trading methods with great auxiliary ATR Trailing Stop indicator for MT4. This indicator is perfect for Trailing Stop purpose ATR Trailing Stop is automatically adaptive to market volatility No delays and easy set up This indicator is excellent to combine with price action entries into the direction of main trend // More great Expert Advisors and Indicators are available here: https://www.mql5.com/en/users/def1380/seller //

The Channel Scalper Pro Indicator is a highly efficient tool for market analysis based on price channels and signal arrows. This indicator is designed for the MetaTrader 4 (MT4) platform. It utilizes a combination of channels and visual signals to provide fairly accurate entry and exit points in the market. Below is a detailed description of the indicator, its functionalities, and usage strategies. Technical Description Channels: The channels presented by the indicator display the upper and lowe

Interceptor - an arrow indicator shows potential market entry points in the form of arrows of the corresponding color: up arrows (blue) suggest opening a buy, down arrows (red) suggest selling. The appearance of arrows may be accompanied by sound signals if the sound option is enabled. It is assumed to enter on the next bar after the indicator, but there may be non-standard recommendations for each strategy. Interceptor visually “unloads” the price chart and saves analysis time: no signal - no d
MetaTrader Mağaza, geliştiricilerin ticaret uygulamalarını satabilecekleri basit ve kullanışlı bir sitedir.
Ürününüzü yayınlamanıza yardımcı olacağız ve size Mağaza için ürününüzün açıklamasını nasıl hazırlayacağınızı anlatacağız. Mağazadaki tüm uygulamalar şifreleme korumalıdır ve yalnızca alıcının bilgisayarında çalıştırılabilir. İllegal kopyalama yapılamaz.
Ticaret fırsatlarını kaçırıyorsunuz:
- Ücretsiz ticaret uygulamaları
- İşlem kopyalama için 8.000'den fazla sinyal
- Finansal piyasaları keşfetmek için ekonomik haberler
Kayıt
Giriş yap
Gizlilik ve Veri Koruma Politikasını ve MQL5.com Kullanım Şartlarını kabul edersiniz
Hesabınız yoksa, lütfen kaydolun
MQL5.com web sitesine giriş yapmak için çerezlerin kullanımına izin vermelisiniz.
Lütfen tarayıcınızda gerekli ayarı etkinleştirin, aksi takdirde giriş yapamazsınız.