YouTube'dan Mağaza ile ilgili eğitici videoları izleyin
Bir ticaret robotu veya gösterge nasıl satın alınır?
Uzman Danışmanınızı
sanal sunucuda çalıştırın
sanal sunucuda çalıştırın
Satın almadan önce göstergeyi/ticaret robotunu test edin
Mağazada kazanç sağlamak ister misiniz?
Satış için bir ürün nasıl sunulur?
MetaTrader 4 için yeni teknik göstergeler - 6

You can visually backtest Elliot Wave Impulse to see how it behaved in the past!
Manual guide: Click here Starting price of $59 for the first 25 copies ( 1 left)! -- Next price is $120 .
This indicator is unstoppable when combined with our other indicator called Katana . After purchase, send us a message and you could get it for FREE as a BONUS! The Elliot Wave Impulse is a pattern identified in the Elliott Wave Theory, a form of technical analysis used to a

Bu işlem aracıyla aynı anda 15 piyasayı tarayabilirsiniz.
Karşınızda yeni ticaret göstergesi 2024:
️ Dashboard Çoklu Para Birimi Çoklu Zaman Çerçevesi Çift CCI.
Bu ticaret aracını oluşturmamın en az iki nedeni var:
Öncelikle tek piyasayı gözlemlemekten sıkıldım. İkincisi, başka bir pazara giriş anını kaybetmek istemiyorum.
Bu yüzden aynı zamanda diğer piyasa koşullarını da bilmek istiyorum.
Bu nedenle birden fazla piyasanın koşullarını aynı anda tarayabilecek bir tarayıcıya ihtiyac
RSI Pro Analyser Göstergesi, aynı anda birden fazla zaman diliminde bilinçli kararlar vermek isteyen yatırımcılar için tasarlanmış güçlü bir araçtır. Bu gösterge aşırı alım, aşırı satış ve trend sinyalleri sağlamak için RSI'yı kullanarak piyasaya giriş fırsatlarını tanımlamayı kolaylaştırır . Farklı piyasa koşullarını gösteren açık ve belirgin renk kodları sayesinde okuma kolaylığı sağlaması en büyük avantajıdır.
Gösterge, RSI değerlerini ve ilgili sinyalleri beş farklı zaman diliminde (D,H4,

volatility level indicator is a volatility oscillator to see trend reversal points. price trends has reverese when volatility inreased . this indicator show trend reversal points volatility. mostly same level up and down volatility is reversal points. red colour shows up points of volatilty.and probably trend will down. blue colour oscillator shows deep point of price when increased volatiliyty. on pictures horizontal lines on oscillator has drawed by hand.to see the before level and compare now
Akıllı Hacim Takipçisi, alış ve satış hacmi verilerini özel bir pencerede görsel olarak sunarak piyasa duyarlılığı hakkında bilgi sağlamak üzere tasarlanmış bir göstergedir. Bu sezgisel araç, yatırımcıların alım ve satım faaliyetinin nerede yoğunlaştığını hızlı bir şekilde belirlemelerine yardımcı olarak daha bilinçli ticaret kararları vermelerine olanak tanır.
Smart Volume Tracker ile piyasanın yükseliş eğilimine mi yoksa düşüş eğilimine mi yöneldiğini kolayca ölçebilirsiniz. Alım faaliyetin

There is No use in the Testing Demo. You will understand nothing from running flashing numbers. It is a Dashboard. Just try to understand idea, get it and I will help in everything further. Symbols must be separated by commas (,) and entered into the parameters exactly as displayed by your broker to ensure they are recognized in the dashboard. These symbols will be used for analysis by the indicator.
With one click open any pair any timeframe directly from dashboard The MA Speedometer Dashboar

on free demo press zoom out button to see back.. cnt number is bar numbers.you can change up to 3000 related to chart bars numbers. minimum value is 500. there is g value set to 10000. no need to change it.
this indicator almost grail,no repaint and all pairs ,all timeframe indicator. there is red and blue histograms. if gold x sign comes on red histogram that is sell signal. if blue x sign comes on blue histogram that is buy signal. this indicator on thise version works all pairs.al timeframe

Başlık: BBMA Yapı Rehberi - BBMA Yapı Rehberi
Açıklama: BBMA Yapı Rehberi, BBMA yapısının evrimini daha kolay ve verimli anlamak için tasarlanmış özel bir MQL4 göstergesidir. BBMA veya "Bollinger Bands Moving Average", "Bir Adım Önde" sloganıyla bilinir ve piyasa yapısını derinlemesine anlamanın önemini vurgular.
BBMA Yapı Rehberi ile fiyat dalgalanmalarını tetikleyen temel piyasa yapı desenlerini hızlı bir şekilde tanımlayabilirsiniz. Bu, daha bilinçli ve etkili ticaret kararları almanıza
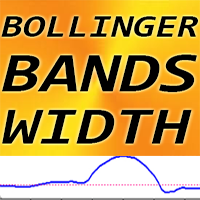
Forex Indicator Bollinger Bands Width for MT4, No Repaint. -BB Width indicator is applicable for using together with standard Bollinger Bands indicator. -This software is must have for every Bollinger Bands indicator fan, because their combination is very efficient to trade Breakouts -BB Width indicator shows the distance (span) between Bollinger Bands. HOW TO USE BB Width (See the example on the picture): 1) Find the lowest value of BB Width of the last 6 months and add 25% to this value
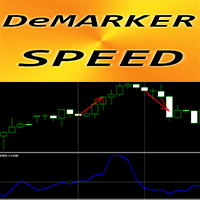
Forex Indicator " DeMarker Speed" for MT4 The calculation of this indicator is based on equations from physics. DeMarker Speed is the 1st derivative of DeMarker itself DeMarker oscillator curve indicates the current price position relative to previous highs and lows during the indicator calculation period
DeMarker Speed is good for scalping entries when standard DeMarker oscillator is in OverSold/OverBought zone (as on pictures) DeMarker Speed indicator shows how fast DeMarker itself
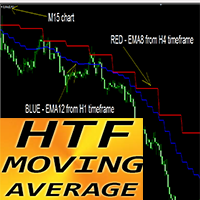
Forex Indicator HTF MOVING AVERAGE for MT4 Upgrade your trading methods with the professional HTF MA Indicator for MT4. H TF means - H igher Time Frame This indicator is excellent for Trend Traders with Price Action entries. HTF MA Indicator allows you to attach Moving Average from Higher time frame to your current chart. Indicator shows the trend from higher time frame --> this is always profitable method. HTF MA Indicator gives opportunity to get big profit with low risk. How to use
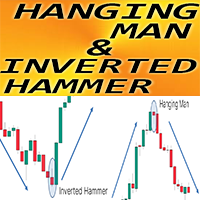
Forex Indicator " Hanging Man and Inverted Hammer pattern" for MT4 Indicator " Hanging Man and Inverted Hammer pattern " is very powerful indicator for Price Action trading : No repaint, No delays; Indicator detects bullish Inverted Hammer and bearish Hanging Man patterns on chart: Bullish Inverted Hammer - Blue arrow signal on chart (see pictures) Bearish Hanging Man - Red arrow signal on chart (see pictures) P C, Mobile & Email alerts are included Indicator " Hanging Man

Forex Indicator HTF MACD Oscillator for MT4 HTF means - H igher Time Frame MACD indicator itself is one of the most popular indicators for trend trading This indicator is excellent for Multi-Time Frame trading systems with Price Action entries or in combination with other indicators HTF MACD Indicator allows you to attach MACD from Higher time frame to your current chart --> this is professional trading approach Indicator has built-in Mobile and PC alerts // More great Ex
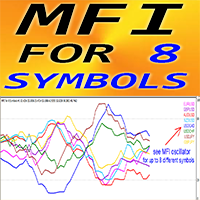
Forex Indicator "MFI for 8 Symbols" for MT4. M oney Flow Index (MFI) is a technical oscillator which uses price and volume data for identifying oversold and o verbought zones It is great to take Sell entries from Overbought when the MFI is above 80 and Buy entries from Oversold when it is below 2 0 MFI is very useful for divergence detection and it is great to combine with Price Action as well "MFI for 8 Symbols" gives opportunity to control MF I values of up to 8 diff
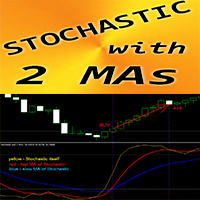
Forex Indicator " Stochastic and 2 Moving Averages" for MT4 Stochastic oscillator is one of the best indicators on the market - perfect tool for many traders. "S tochastic and 2 Moving Averages" Indicator allows you to see Fast and Slow Moving Averages of S tochastic oscillator OverBought zone - above 80; OverSold one - below 20 It is great to take Sell entries from above 80 zone and Buy entries from below 20 You can see Buy and Sell entry conditions on the pictures Con

The Tripl indicator is designed to visually display the current trend in the market. One of the key aspects of currency market analysis is identifying a trend, which is a stable direction in which prices are moving. For this purpose, the Tripl indicator uses calculations that smooth out sharp fluctuations that do not have a significant impact on the overall trend of price movements.
A trend can be either upward (bullish) or downward (bearish). Most often, a trend develops for a long time befo

In a departure from the conventional approach, traders can leverage the bearish engulfing candlestick pattern as a buy signal for short-term mean reversion trades. Here's how this alternative strategy unfolds: The bearish engulfing pattern, (typically signaling a reversal of bullish momentum) , is interpreted differently in this context. Instead of viewing it as a precursor to further downward movement, we perceive it as an indication of a potential short-term bounce or mean reversion in prices.
FREE

This trading system is based on mathematical probability. In this case, 5 consecutive candles are compared with each other. For a logical comparison, consider these 5 candles as 1 candle on the M5 timeframe. Therefore, the comparison begins with the opening of a candle on the M5 timeframe. The probability of a match is 50% in the 1st candle, 25% in the 2nd candle, 12.5% in the 3rd candle, 6.25% in the 4th candle, 3.125% in the 5th candle. Thus, the 5th candle has a probability of matching in 1

About Waddah Multimeter (free): This product is based on the WAExplosion Indicator. It helps identify explosive market trends and potential trading opportunities. Waddah Multi-meter (Multi-timeframe) Check out the detailed product post here for scanner and multimeter both: https://www.mql5.com/en/blogs/post/758020
Please note that scanner is paid and multimeter is free.
Features: Waddah Trend Direction Trend Strength (above/below explosion line or deadzone) Trend Explosion Alert Alignment al
FREE

Waddah Explosion Scanner Features : - Waddah Trend, Explosion Increase/Decrease
- Trend Percentage with Threshold
- DeadZone
- Trend Direction Aligned Checks
- Highlight and Alerts
- Multi-Timeframe & Multi-Currency
Check out the blog post for more info: https://www.mql5.com/en/blogs/post/758020
Customizable Threshold: With customizable threshold, you can identify best trading opportunities in volume-based trading. Use Trend Height (x times Explosion) : Trend height in relat

With the growth of information technology and the increasing number of participants in financial markets, traditional analysis tools are becoming less effective. Conventional technical indicators, such as the moving average or stochastic, in their pure form are unable to accurately determine the direction of the trend or its reversal. Is it possible to find an indicator that remains effective for 14 years without changing its parameters, and at the same time adapts to market changes? Yes, such
Please feel free to contact me if you need any further information.
Please let me know if you have any questions.
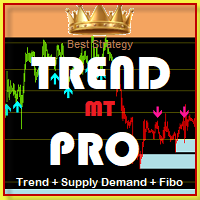
I hope the above is useful to you. MT Trend Pro: "Trade according to the trend and you will be a winner." There is Supply&Demand and Fibo to help set SL and TP. indicator for trade by yourself
TRADE: Forex
TIME FRAME: All Time Frame (Not M1)
SYMBOL PAIR: All Symbol
SETTINGS:
SIGNAL FOLLOW TREND: Input period (>1)
CANDLE MA FILTER TREND: Set MA to change the can

Auto Multi Channels VT Ещё один технический индикатор в помощь трейдеру. Данный индикатор, автоматически показывает, наклонные каналы в восходящем,
нисходящем и боковом движении цены, т.е. тренды. (Внутри дня. Среднесрочные и долгосрочные, а также Восходящие, нисходящие и боковые).
О понятии Тренд. На бирже, трендом называется направленное движение ценового графика в одну из сторон (вверх или вниз) . То есть, тренд в трейдинге — это ситуация,
когда цена определенное время возрастает или

Safe Trade Indicator MT4
The Safe Trade indicator is an analytical and technical tool that has different features and very accurate signals. This indicator can be used in various markets such as the stock market and the forex market. It states and also provides buy and sell signals.
Features of the Safe Trade indicator
Receiving signals as notifications on the Metatrader mobile application. Receive signals by email. Receiving signals in the form of warning messages or alarms on Metatrader.

Unveil the Secret to Trading with Joker's TrendMaster!
Ready to outperform the markets with a proven and reliable strategy? Look no further! Introducing Joker's TrendMaster, the revolutionary indicator crafted by Yuri Congia! With Joker's TrendMaster, you'll gain access to a powerful combination of advanced technical analysis and unique strategic insights.
Limited-time Special Opportunity: Seize the moment! Be among the first 10 (Purchasing 1/10) to seize this unique opportunity, and not
FREE

MACD is probably one of the most popular technical indicators out there. When the market is trending, it actually does a pretty good job, but when the market starts consolidating and moving sideways, the MACD performs not so well. SX Impulse MACD for MT5 is available here . Impulse MACD is a modified version of MACD that works very well for trading Forex, stocks, and cryptocurrencies. It has its own unique feature which perfectly filters out the values in a moving average range and enables it t

Introducing the “Symbol Cost Info MT4” indicator – your ultimate tool for staying ahead in the forex market! This innovative indicator is designed to empower traders with real-time cost information, directly on their charts. Here’s why every trader needs the “Symbol Cost Info MT4” in their arsenal: Real-Time Spread Monitoring : Keep a close eye on the spread for any currency pair, ensuring you enter the market at the most cost-effective times. Pip Value at Your Fingertips : Instantly know t
FREE

Precision Pivot Points Yuri Congia Description: Precision Pivot Points is a sophisticated indicator designed to identify potential market reversal points with accuracy and precision. Utilizing advanced algorithms, this indicator automatically calculates key support and resistance levels based on pivot point analysis. Pivot points are essential tools used by traders worldwide to make informed trading decisions and optimize their trading strategies. Join me in the exciting world of financial trad
FREE

Yuri Congia Market Info Indicator
Description: The Yuri Congia Market Info Indicator is a tool for traders, providing a wide range of key data directly on the chart. Developed by Yuri Congia, this indicator offers detailed information on the current price, spread, daily highs and lows, remaining time before candle close, and more. It's an essential tool for traders who want immediate access to crucial information during their trading operations. Join me in the exciting world of financial trad
FREE

TrendExpert Indicator Overview
The TrendExpert indicator is designed to identify and visualize trend zones in financial markets. It utilizes zigzag high and low points to determine support and resistance levels, providing insights into potential market reversals and continuation patterns.
Features - Detection of support and resistance zones based on price action. - Strength categorization (Proven, Verified, Untested, Turncoat, Weak) based on historical testing. - Adjustable parameters fo
FREE

The indicator show Higher timeframe candles for ICT technical analisys Higher time frames reduce the 'noise' inherent in lower time frames, providing a clearer, more accurate picture of the market's movements.
By examining higher time frames, you can better identify trends, reversals, and key areas of support and resistance.
The Higher Time Frame Candles indicator overlays higher time frame data directly onto your current chart.
You can easily specify the higher time frame candles yo

TrendWave Oscillator is an advanced MT4 oscillator that not only identifies the trend direction but also provides visual and audio alerts to enhance trading strategies.
Key Features: - Color-coded trend indication: - Blue : Indicates an uptrend, signaling potential price growth. - Orange : Indicates a downtrend, suggesting possible price decline. - Gray : Represents a flat market or lack of clear entry signals.
- Graphical signals on the chart : - Aqua : Highlights an uptrend, empha

Elevate your trading game with TigerSignals – the ultimate MetaTrader 4 indicator. Designed for simplicity and precision, TigerSignals provides crystal-clear buy and sell signals, making it a must-have for traders of all levels.
Features: User-Friendly: Easy-to-use interface ensures hassle-free integration into your trading strategy. Alerts: Sound, phone, and email alerts. Receive notifications when a new signal appears, giving you the freedom to step away from the chart! Lot Size Calcula

Introducing the Ultimate Horizontal Line Alert Indicator for MT4! Transform your trading with the smartest tool in the market. Our Horizontal Line Alert Indicator isn't just any indicator — it's your new trading partner that combines precision, flexibility, and intuitive control. What Does It Do? This revolutionary MT4 indicator automatically adjusts trend lines to be horizontal with just the press of the 'L' key. It’s perfect for traders who want to focus on specific price levels, ensu
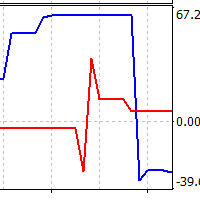
Two lines are being drawn in a separate window. And both are representing an angle of a trendline. One trendline is measured going across two price highs, but the other is measured across two lows. You get to choose the period from which the first price high and first price low is being determined. The second high and low comes from identical time period preceding the first one. Feel free to experiment with the period count until you get the confirmation you are looking for.

Biggest V.7 update for Break and Retest since the official release!
️ V.7 UPDATE includes the following:
Multi Symbol Screener Panel where you can automatically add any symbol you want. Each symbol is clickable to automatically switch between them!
Multi Timeframe Screener Panel where you can automatically scan all the timeframes for the selected symbols! Timeframe Screener is clickable for on/off!
This means that you can open only 1 chart and let the indicator scan for sig

Bu işlem aracıyla aynı anda 15 piyasayı tarayabilirsiniz.
Karşınızda yeni ticaret göstergesi 2024:
️ Kontrol Paneli Çoklu Para Birimi Çoklu Zaman Çerçevesi Stokastik.
Bu ticaret aracını oluşturmamın en az iki nedeni var:
Öncelikle tek piyasayı gözlemlemekten sıkıldım. İkincisi, başka bir pazara giriş anını kaybetmek istemiyorum.
Bu yüzden aynı zamanda diğer piyasa koşullarını da bilmek istiyorum.
Bu nedenle birden fazla piyasanın koşullarını aynı anda tarayabilecek bir tarayıcıya i

Yenilikçi Metatrader Tema Oluşturucumuz ile işlem grafiklerinize hayat verin!
Tema Oluşturucumuz, kişisel tarzınıza ve tercihlerinize uygun bir ticaret ortamı oluşturmanıza olanak tanır. Kullanımı kolay bir arayüzle ve Metatrader'a tamamen entegre olarak, artık grafiklerinizin görünümü ve hissi üzerinde tam kontrole sahipsiniz / Ücretsiz MT5 sürümü .
Özellikler Tam Özelleştirme: Benzersiz ticaret tarzınızı yansıtmak için mum çubuğu rengini ve grafik arka planını kolayca değiştirin. Yumuşa
FREE
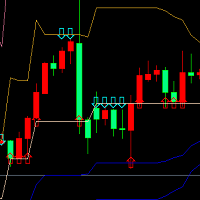
This indicator is based on the golden ratio theory, which obtains the high and low prices of the past 22 (default) K-lines, and calculates the support and pressure curves through the golden ratio coefficient. Fiyat ilk kez ya da çoğu kez basınç çizgisine yaklaşınca, a şağıdaki bir okla görüşecek, basınç olduğunu gösterir ve kısa satmak için uygun; Fiyat ilk kez ya da birçok kez destek çizgisine yaklaşınca, yukarı bir okla görüşecek, destek gösteriyor ve uzun satın almaya uygun sağlayacak; Veri
This indicator informs the user when the ATR is above a certain value defined by the user, as well as when the ATR prints a percentage increase or percentage decrease in its value, in order to offer the user information about the occurrence of spikes or drops in volatility which can be widely used within volatility-based trading systems or, especially, in Recovery Zone or Grid Hedge systems. Furthermore, as the volatility aspect is extremely determining for the success rate of any system based o
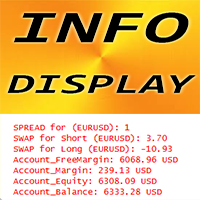
This is Free product you are welcome to use for your needs! Also I very appreciate your positive feedbacks! Thanks a lot! // More great Expert Advisors and Indicators are available here: https://www.mql5.com/en/users/def1380/seller // Also you are welcome to join to profitable , stable and reliable signal https://www.mql5.com/en/signals/1887493 Forex Indicator "INFO Display" for MT4 , Trading Support tool. INFO Display indicator shows current S pread and Swaps of forex pair whe
FREE
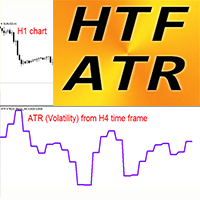
Forex Volatility Indicator HTF ATR for MT4 Average True Range itself is one of the most impotrant indicators for traders - it shows market volatility H TF ATR is a market volatility indicator used in technical analysis . HTF means - H igher Time Frame ATR is great to plan your dynamic Take Profits / SL locations: For example most optimal SL values are located in 1.2-2.5 ATR values This indicator is a useful tool to add to any trading system HTF ATR Indicator allows you t
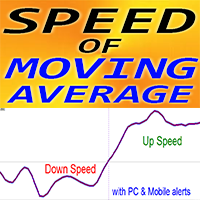
Forex Indicator "MA Speed" for MT4, No Repaint. SPEED of Moving Average - is unique trend indicator The calculation of this indicator is based on equations from physics . Speed is the 1st derivative of Moving average MA Speed indicator shows how fast MA itself changes its direction There are plenty of opportunities to upgrade even standard strategies with MA Speed . Suitable for SMA, EMA, SMMA and LWMA It is recommended to use MA Speed in trend strategies , if indic
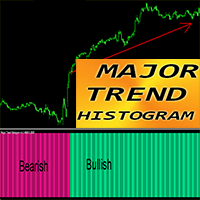
Forex Indicator "Major Trend Histogram" for MT4 Major Trend Histogram indicator designed to catch really huge trends Indicator can be in 2 colors: DeepPink for bearish trend and SpringGreen for bullish one (colors can be changed) It detects trends on the beginning stages - way more efficient than any standard MA cross M ajor Trend Histogram can be combined with any other trading methods: Price Action, VSA, other indicators Indicator has built-in Mobile and PC alerts
// More great Exper
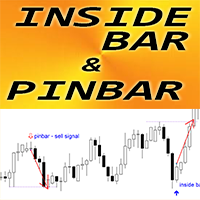
Forex Indicator " Inside Bar & PinBar Patterns" for MT4 Indicator " Inside Bar & PinBar Patterns " is very powerful for Price Action trading Indicator detects Inside Bar and PinBar Patterns on chart: Bullish pattern - Blue arrow signal on chart (see pictures) Bearish pattern - Red arrow signal on chart (see pictures) No repaint; No delays; Inside Bar itself has High R/R ratio (reward/risk) with PC, Mobile & Email alerts Indicator " Inside Bar & PinBar Patterns " is excellent t
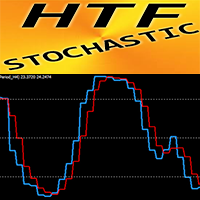
Forex Indicator HTF Stochastic for MT4 Stochastic oscillator is one of the best indicators on the market - perfect tool for many traders. H TF means - H igher Time Frame OverBought zone - above 80; OverSold one - below 20 HTF Stochastic indicator is excellent for Multi-Time Frame trading systems especially with Price Action entries. This Indicator allows you to attach Stochastic from Higher time frame to your current chart --> this is professional trading approach I n
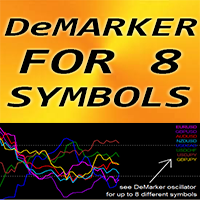
Forex Indicator "DeMarker for 8 Symbols" for MT4, No repaint DeMarker oscillator curve indicates the current price position relative to previous highs and lows during the indicator calculation period DeMarker provides the most efficient regular divergence signals among other oscillators It is great to take Sell entries with regular divergence in OverBought zone (above 0.7) and Buy entries with regular divergence in OverSold zone (below 0.3) "DeMarker for 8 Symbols" gives oppo
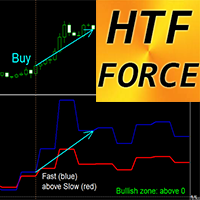
Forex Indicator HTF Force Oscillator for MT4 HTF Force is powerful indicator for Multi-Time Frame trading . HTF means - H igher Time Frame Force index is one of the top indicators that combines price and volume data into a single value Values from High time frame can show you the trend direction (downtrend - below 0; uptrend - above 0) Fast Force - Blue line, Slow Force - Red line Buy signal - Fast line crosses Slow line upward and both - above 0 (see picture) Sell signal - Fast line cr
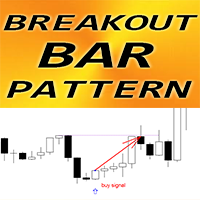
Forex Indicator " Breakout Bar pattern" for MT4 Indicator "Breakout Bar pattern" is very powerful indicator for Price Action trading: No repaint, No delays; Indicator detects Breakout Bar patterns on chart: Bullish Breakout Bar pattern - Blue arrow signal on chart (see pictures) Bearish Breakout Bar pattern - Red arrow signal on chart (see pictures) with P C, Mobile & Email alerts Indicator " Breakout Bar pattern" is excellent to combine with Support/Resistance Levels : htt

The "Trend Tandem" indicator is a trend analysis tool in financial markets that helps traders determine the direction of price movement.
Options:
RISK: Determines the level of risk taken into account in the trend analysis. The higher the value, the more aggressively volatility is taken into account. SSP (SSP Period): Defines the period of the moving average used to identify a trend. The higher the value, the smoother the trend signal will be. CountBars: Determines the number of bars on whic
This indicator informs the user when the ATR is above a certain value defined by the user, as well as when the ATR prints a percentage increase or percentage decrease in its value, in order to offer the user information about the occurrence of spikes or drops in volatility which can be widely used within volatility-based trading systems or, especially, in Recovery Zone or Grid Hedge systems. Furthermore, as the volatility aspect is extremely determining for the success rate of any system based o
FREE

The "Trend Api" indicator is an innovative tool for trend analysis in the Forex market. It has unique features and a wide range of settings that will help traders make informed decisions when trading.
This indicator is based on the analysis of the market trend and helps to identify the direction of price movement. It uses various mathematical algorithms and statistical methods to determine the strength and sustainability of a trend in the market.
One of the key features of the "Trend Api" i

缠中说禅在MT4的应用,该指标自动识别分型,划笔,划线段,显示笔中枢,线段中枢,也可以根据需求在参数中设置显示自己所需要的。 1.笔采用条件较为宽松的新笔。 2.当前分型与前面分型不能构成笔时,若与前面笔同向且创新高或新底时会延伸笔,若与前面笔异向且符合替换条件则去除倒数第一笔,直接倒数第二笔。 3.线段的终结第一类情况:缺口封闭,再次创新高或新底新低,则判为终结,同时破坏那一笔的右侧考虑特征序列包含。 4.线段终结的第二类情况,缺口未封闭,考虑后一段特征序列分型出现新的顶底分型,同时做了包含处理。 5.中枢显示笔中枢和段中枢可在参数选择 6.第一类买卖点两种方式可选,参数1为MACD动能柱面积,参数2为斜率

本指标是根据黄金分割理论,分别获取过去22(默认)根K线高低价,并通过黄金分割系数计算得出支撑、压力曲线。 当价格第一次向上靠近压力线,或者多次靠近压力线时,会出现向下的箭头符合,提示有压力,适宜做空sell; 当价格第一次向下靠近支撑线,或者多次靠近支撑线时,会出现向上的箭头符合,提示有支撑,适宜做多buy; 在数据窗口,会提示各条支撑、压力线的价格数值,出现的箭头符合数值为up、down。
这个指标,适合在所挂的图表里做短线,也即进场开仓后,持仓几根K线柱,然后可以平仓。做多的话,止损可以在支撑线下方,止盈在压力线附近。做空的话,止损可以在压力线上方,止盈在支撑线附近。
本指标涉及的黄金分割系数分别为0.382、0.618、1.618、2.168、4.236,计算得到对应的支撑压力线。 由于MT4的指标数量有限,本指标分成了2个EX4文件,第一个的黄金分割系数为0.382、0.618、1.618,第二个为2.168、4.236,第二个文件名为“Golden Ratio Support Pressure Indicator extend”,可免费下载和使用。
FREE

Indicador de Bandas de Fibonacci para Metatrader 4 . Este indicador funciona de forma similar a las conocidas Bandas de Bollinger clásicas, pero en lugar de usar la desviación estándar para trazar las bandas usa números de Fibonacci y el ATR (Average True Range). Puede usarse para trazar niveles de soporte y resistencia que pueden emplearse en sistemas de scalping de corto plazo y swing trading. Las bandas del indicador son calculadas de la siguiente forma: Línea central : Media móvil de n peri
FREE

The Breakout Line in technical analysis serves as a crucial tool for understanding market dynamics and potential shifts in price direction. It's designed to highlight rapid accelerations or declines in the market's trajectory. Unconventional Analysis : The Breakout Line is not your typical technical indicator; it's tailored to capture swift market movements, offering a unique perspective on price trends. Angle of the Breakout Line : The sharper the angle formed by the Breakout Line, the stro

Smart Mone Liquidity Zone
Overview : Smart Mone Liquidity Zone is a sophisticated MetaTrader 4 indicator meticulously crafted to illuminate crucial liquidity zones on price charts, amplifying traders' capacity to discern optimal trading opportunities. Engineered by Yuri Congia, this indicator empowers traders with profound insights into market dynamics, enabling astute decision-making within various timeframes.
Limited-time Special Opportunity:
Seize the moment! Be among the first 10 (Pu
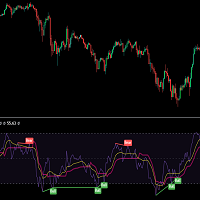
MOST is applied on this RSI moving average with an extra default option added VAR/VIDYA (Variable Index Dynamic Moving Average)
MOST added on RSI has a Moving Average of RSI and a trailing percent stop level of the Moving Average that can be adjusted by changing the length of the MA and %percent of the stop level.
BUY SIGNAL when the Moving Average Line crosses above the MOST Line
LONG CONDITION when the Moving Average is above the MOST
SELL SIGNAL when Moving Average Line crosses belo

MA Trend Following Indicator for MT4 is a simple technical analysis tool designed to follow the trend in any currency pair chosen by the trader by combining 3 moving averages on two different time frames, one long term and one short term.
It basically provides a bullish or bearish signal when the moving averages on one time frame align with the moving averages on a different time frame to have a confluence signal.
The indicator is presented as a screener with multiple currency pairs (that

This tool helps you to find easily and clearly when you enter trade with day time and price examples Entered Buy at Monday 20:30 with price 2150 Exited buy at Tues 10: 30 with price 2187 You can convert as local time by inputting shift hours and minutes.
Trading is a learning skill, so you have to evaluate your trading performance at the end of your day. Did you follow your rules? If you did then it was a win, regardless if you earned pips or not. If you didn't follow my rules then is a

MAXLUM SYSTEM is a Trading System that uses anti-Margin Call without using SL with a positive correlation Hedging Strategy
Simple example of BUY on EURUSD and SELL on GBPUSD at the same time This kind of trading will not occur as a Margin Call By calculating the GAP difference between the 2 pairs we can take advantage of the GAP
This indicator will be more effective if you use Data Analysis download excel file on telegram Group Please join the Maxlum System Telegram group for details t.me/m

Direct translation of blackcat's L3 Banker Fund Flow Trend Oscillator. Get push notifications on your phone app when a signal bar has formed. Historical signals are shown with buy/sell arrow right on the main chart. Indicator uses two data calculations to check for a cross below 25% level (a signal to go long) and above 75% level (a signal to short). For any further questions feel free to contact me directly. Including requests for product improvements.

Kesin işlem analizi parmaklarınızın ucunda: Yeni nesil işlem analizi yazılımı Piyasada bulunan ana akım işlem analizi yazılımları genellikle yalnızca saatlik veya haftalık kar ve zarar oranı istatistikleri sunar; bu da daha hassas işlem analizi ihtiyacını karşılamaktan uzaktır. Ancak, gerçek işlem piyasasında her gün benzersiz koşullar ortaya çıkar. Pazartesi günleri sakindir, çarşamba günleri üçlü gecelik faizle aktiftir ve cuma günleri önemli veri yayınlarının olması nedeniyle olağanüstü akti
FREE
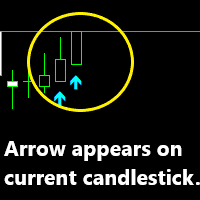
Advanced artificial intelligence indicator that is 100% non-repaint and appears on current candlestick. The indicator is based on arrows which serve as your entry points. Buy arrow is your buy signal and orange arrow are your sell signal as more arrows appear the stronger the trend and you can add more entries. The indicator works on all timeframe from the one-minute timeframe to the monthly timeframe. The AI Non-repaint indicator works on all forex pairs.

Metatrader için hacim profili göstergemizle hacim analizinin gücünü keşfedin! / MT5 Sürümü
Temel Hacim Profili, işlemlerini optimize etmek isteyen manuel yatırımcılar için özel olarak tasarlanmış bir göstergedir. Hacim Profili Göstergesi, piyasa davranışını daha iyi anlamak isteyen tüm ciddi yatırımcılar için önemli bir araçtır. Yenilikçi çözümümüzle, işlem hacminin fiyatlara nasıl dağıldığını açık ve net bir şekilde görselleştirebilirsiniz. Bu sayede destek ve direnç seviyeleri, birikim ve d
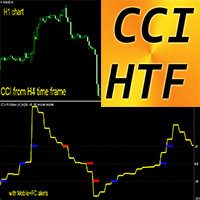
Forex Indicator CCI HTF Oscillator for MT4 Upgrade your trading methods with the professional CCI HTF Oscillator for MT4. H TF means - H igher Time Frame Commodity Channel Index (CCI) measures the difference between the current price and the historical average price Important levels: +/-200, +/-100
It is great to take Sell entries from above +200 zone and Buy entries from below -200
This indicator is excellent for Multi-Time Frame trading systems with Price Action entries
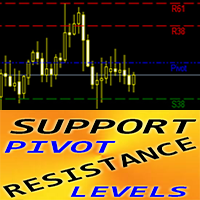
Forex Indicator "Pivot Support Resistance Levels Day Week Month" for MT4 Indicator " Pivot SR Levels D_W_M " is a very powerful auxiliary indicator for Price Action trading This particular indicator is using Fibonacci numbers in calculation. Pivot Levels are calculated as an average of significant prices from the performance of a market in the prior trading period Pivot Levels itself represent levels of highest resistance or support, depending on the overall market condition Indicator "
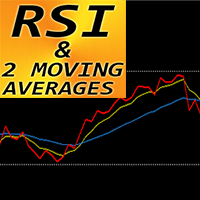
Forex Indicator "RSI and 2 Moving Averages" for MT4 This indicator is excellent for Momentum trading systems . " RSI and 2 MAs" Indicator allows you to see Fast and Slow Moving Averages of RSI itself Indicator gives opportunities to see the trend change very early " RSI and 2 MAs" can be used to catch the momentum into the trend direction It is very easy to set up this indicator via parameters (see the picture) Indicator can be used on any time-frame // More great Expert Advisors and I
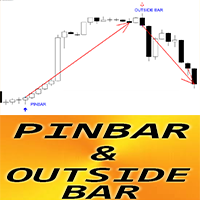
Forex Indicator " Pin Bar & Outside bar Patterns" for MT4 Indicator " Pin Bar & Outside Bar Patterns " is very powerful for Price Action trading Indicator detects Pin Bar and Outside bar Patterns on chart: Bullish pattern - Blue arrow signal on chart (see pictures) Bearish pattern - Red arrow signal on chart (see pictures) No repaint; No delays; with PC, Mobile & Email alerts Indicator "Pin Bar & Outside Bar Patterns " is excellent to combine with Support/Resistance Levels:

buy sell star indicator has a different algoritms then up down v6 and buy sell histogram indicators. so that i put this a another indicator on market. it is no repaint and all pairs and all time frame indicator. it need minimum 500 bars on charts. when the white x sign on the red histogram that is sell signals. when the white x sign on the blue histogram that is sell signals. this indicator does not guarantie the win.price can make mowement on direction opposite the signals. this is multi tim
MetaTrader Mağaza - yatırımcılar için ticaret robotları ve teknik göstergeler doğrudan işlem terminalinde mevcuttur.
MQL5.community ödeme sistemi, MetaTrader hizmetlerindeki işlemler için MQL5.com sitesinin tüm kayıtlı kullanıcıları tarafından kullanılabilir. WebMoney, PayPal veya banka kartı kullanarak para yatırabilir ve çekebilirsiniz.
Ticaret fırsatlarını kaçırıyorsunuz:
- Ücretsiz ticaret uygulamaları
- İşlem kopyalama için 8.000'den fazla sinyal
- Finansal piyasaları keşfetmek için ekonomik haberler
Kayıt
Giriş yap
Gizlilik ve Veri Koruma Politikasını ve MQL5.com Kullanım Şartlarını kabul edersiniz
Hesabınız yoksa, lütfen kaydolun
MQL5.com web sitesine giriş yapmak için çerezlerin kullanımına izin vermelisiniz.
Lütfen tarayıcınızda gerekli ayarı etkinleştirin, aksi takdirde giriş yapamazsınız.