YouTube'dan Mağaza ile ilgili eğitici videoları izleyin
Bir alım-satım robotu veya gösterge nasıl satın alınır?
Uzman Danışmanınızı
sanal sunucuda çalıştırın
sanal sunucuda çalıştırın
Satın almadan önce göstergeyi/alım-satım robotunu test edin
Mağazada kazanç sağlamak ister misiniz?
Satış için bir ürün nasıl sunulur?
MetaTrader 4 için yeni teknik göstergeler - 9
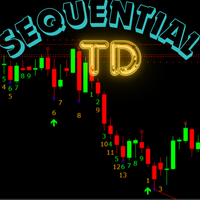
If you are unsure how to use this indicator, please feel free to reach out to me. I will explain it to you and provide reading materials to help you make the most of it. Here’s a brief description of how to use the indicator effectively. How to Use TD Sequential by Tom DeMark The TD Sequential is a technical analysis indicator developed by Tom DeMark, designed to identify potential turning points in market trends. It is widely used by traders to anticipate market reversals and manage trading ris
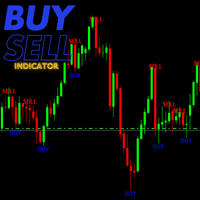
This tool is designed specifically for traders seeking to identify market reversals, allowing you to capitalize on advantageous trading opportunities. The indicator has undergone extensive testing and has established itself as a leading indicator; it often predicts market movements effectively. When a buy or sell signal is generated by the indicator, it tends to align with the market’s subsequent behavior, following the trend indicated by the signal.
By utilizing this indicator, you can enhance
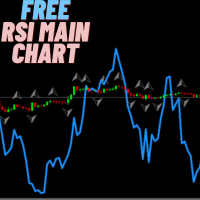
This indicator functions similarly to the traditional Relative Strength Index (RSI), but it's integrated directly onto the main price chart. This setup allows traders to more easily identify price fluctuations and recognize conditions of overbought or oversold markets. By observing the indicator in conjunction with price movements, you can gain valuable insights into potential trend reversals or continued momentum. Keep an eye on these signals to enhance your trading strategy. Happy trading, eve
FREE
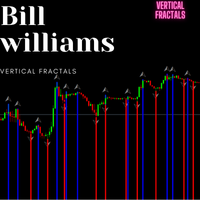
The indicator I’m referring to is a leading indicator, similar to the Bill Williams Fractals indicator, but with an added feature: it draws vertical lines on the chart to mark significant points in time. This functionality makes it particularly useful for traders as it provides clear visual cues for potential trading opportunities.
What sets this indicator apart is its versatility; it can be applied across all timeframes and any currency pair, making it suitable for a wide range of trading stra
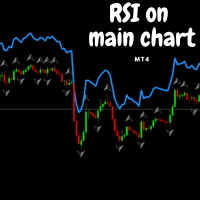
This indicator functions similarly to the Relative Strength Index (RSI), but with a key difference: instead of being displayed in a separate window, it overlays directly on the main price chart. This allows for more convenient visualization and interpretation of market momentum alongside price movements. I believe this indicator will enhance your trading experience by providing clearer insights into market conditions. Wishing you successful trading!

Lion’s Roar - Trend Strength Indicator Are you ready to take control of your trading journey? The Lion’s Roar - Trend Strength Indicator is here to help you identify and harness powerful market trends with precision and confidence. Designed with traders in mind, this advanced tool is built on a robust strategy that combines trend direction with momentum validation using the Average True Range (ATR). This indicator is not pre-optimized, giving YOU the freedom to tailor it to your unique trading

Unleash Market Volatility with the Titan Force Indicator! Are you ready to dominate the market by capitalizing on volatility? The Titan Force Indicator is your ultimate trading tool, designed for traders who thrive during periods of heightened market activity. Not Optimized for You – Yet! This indicator is a canvas for your creativity. It's been crafted to let you optimize it according to your unique trading strategies and preferences. Your skills, your edge! How Does the Titan Force Indicator

Introducing the Falcon Turn Indicator Designed for customization and optimization, this indicator empowers traders to adapt it to their unique strategies. Why Choose the Falcon Turn Indicator? The Falcon Turn Indicator leverages the power of the Parabolic SAR strategy to highlight potential buy and sell opportunities with precision and clarity. It is perfect for trend-following enthusiasts and those who value flexibility in fine-tuning their trading tools. Key Features: Parabolic SAR-Based Sign
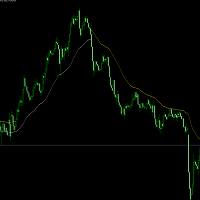
超级趋势指标 展示信号: https://www.mql5.com/zh/signals/2295318?source=Site +Profile+Seller 开发于2024年12月,测试效果不错。 适用于,黄金1小时,可配合 5分钟和15分钟趋势线。 白线上只做多,黄线下只做空。 其它品种可根据自己的经验使用。 如果使用中有什么问题可提供宝贵意见。谢谢。 超级趋势指标 开发于2024年12月,测试效果不错。 适用于,黄金1小时,可配合 5分钟和15分钟趋势线。 白线上只做多,黄线下只做空。 其它品种可根据自己的经验使用。 如果使用中有什么问题可提供宝贵意见。谢谢。 超级趋势指标 开发于2024年12月,测试效果不错。 适用于,黄金1小时,可配合 5分钟和15分钟趋势线。 白线上只做多,黄线下只做空。 其它品种可根据自己的经验使用。 如果使用中有什么问题可提供宝贵意见。谢谢。

The Mountain Guard Indicator is a highly customizable tool designed for traders who want full control over their optimization. It has not been pre-optimized, giving you the freedom to adapt it to your specific trading strategies and preferences. Key Features: Buy and sell signals displayed with lime (buy) and red (sell) arrows on the chart. SAR line represented as a dotted Dodger Blue line to visualize the Stop-and-Reverse (SAR) trend-following indicator. Adjustable parameters to control SAR st

Ocean State Indicator Unleash the Power of Precision Trading! Introducing the Ocean State Indicator, an innovative tool designed to elevate your trading experience. This indicator is a versatile, dynamic solution that equips you with the tools needed to analyze market trends and identify profitable entry and exit points. Priced at just $65, it’s an incredible value for traders seeking to optimize their strategies. Important Note: The Ocean State Indicator is not pre-optimized. It’s been created

Wolf Signal Indicator Note: This indicator is not optimized and is designed for traders who prefer to tailor it to their unique strategies. It provides a robust framework, giving you the freedom to adjust parameters and refine its behavior to suit your trading style. Why Choose the Wolf Signal Indicator?
The Wolf Signal Indicator is a powerful and versatile tool for identifying trading opportunities across multiple market conditions. Designed with precision, this indicator harnesses advanced al

Discover the untapped potential of market range trading with the Forest Shadow Indicator! Designed for traders who want to optimize their strategies, this tool provides raw, powerful insights into market trends and turning points. Note: The indicator is unoptimized, offering you full flexibility to tailor it to your unique trading needs. Core Logic: The Forest Shadow Indicator uses a combination of stochastic momentum and visual signals to highlight potential buy and sell zones within range-bou
Mountain Echo Indicator
Your key to uncovering trade opportunities, designed for custom optimization.
Price: $65 Key Features: Visual Buy and Sell Signals
The indicator places visually appealing arrows directly on your chart: Lime Green Arrows indicate potential buy opportunities. Red Arrows signal potential sell opportunities. Customizable Stochastic Parameters
Includes key inputs like: %K Period (default: 14) %D Period (default: 3) Slowing (default: 3) Bars to Wait Between Signals (default: 1

Welcome to the Ocean's Gate Stochastic Indicator! Note: This indicator is not optimized by default—it has been crafted for you to tweak and optimize based on your unique trading style! Dive into precise decision-making with this advanced trading tool that harnesses the power of the stochastic oscillator. The Ocean's Gate Stochastic Indicator not only visualizes overbought and oversold conditions but also identifies critical crossovers, allowing you to anticipate market movements with confidence

Introducing the River Flow Divergence Indicator Are you ready to unlock your trading potential? Meet the River Flow Divergence Indicator, a powerful tool designed to help you navigate market trends and reversals with precision. This indicator is tailored for traders who are eager to fine-tune their strategies and take control of their success. Note: This indicator is not optimized out of the box. It’s crafted for you to customize and optimize according to your unique trading style and goals. Ho

Introducing the Star Path Stochastic Cross Indicator Ready to explore your trading potential? The Star Path Stochastic Cross Indicator is here to guide your path. Designed for traders who love flexibility, this indicator is not optimized, giving YOU the freedom to tailor it to your strategies. Whether you're a beginner or an experienced trader, this tool is the perfect addition to your toolkit. The Logic Behind the Indicator
This indicator leverages the powerful stochastic oscillator to identif

Wind Dancer Indicator Ready to take control of your trading journey? The Wind Dancer Indicator is here to empower your strategies with a unique, visually intuitive approach. Designed with flexibility in mind, this indicator is not optimized, giving you the creative freedom to fine-tune and adapt it to your specific trading needs. How Does the Wind Dancer Indicator Work? The logic behind the Wind Dancer Indicator is a blend of sophisticated signals and a seamless visualization algorithm: Signal

Aurora Cross: Your Customizable Path to Trading Success! Price: $65
Explore More Tools and Strategies Here About This Indicator
The Aurora Cross Indicator is designed to empower traders to refine and optimize their strategies. It’s a versatile tool created specifically for you to customize and tailor to your unique trading approach. It is not pre-optimized, giving you complete freedom to experiment and find the perfect settings for your trading style. How It Works
At its core, the Aurora Cross

Cosmos Dance Indicator The Cosmos Dance Indicator is your next powerful tool in financial trading, designed for traders who value precision and flexibility. This indicator is not pre-optimized, giving you the freedom to fine-tune and adapt it to your specific trading strategy. With Cosmos Dance, you hold the reins to enhance your trading edge. Key Features and Logic: Clear Buy and Sell Signals: Visual arrows for "Buy" (green) and "Sell" (red) opportunities, helping you identify potential market

Not Optimized – Created for Your Custom Optimization! Introducing Diamond Crush – your pathway to mastering market squeezes! This indicator is designed to identify powerful trading opportunities by analyzing market conditions and visualizing key areas of market compression and expansion. Why Diamond Crush? Band Squeeze Analysis: Harness the power of dynamic upper and lower bands to capture market volatility and trend shifts effortlessly. Buy & Sell Signals: Visual cues guide you through potenti

Moon Touch Indicator Unlock the full potential of your trading strategy with the Moon Touch Indicator! This advanced tool is designed for traders who want to fine-tune their approach and optimize their results. While the indicator isn't pre-optimized, it gives you the flexibility to tailor it perfectly to your trading style and market conditions. How Does It Work? The Moon Touch Indicator is a versatile signal tool that works by identifying key market conditions: Buy and Sell Signals: Clearly m

Solar Flare Indicator The Solar Flare Indicator is a versatile and customizable tool designed for traders who value precision and adaptability. Built to empower traders of all levels, this indicator highlights key market dynamics to support strategic decision-making. Please note, the indicator is provided without pre-optimization, giving you the freedom to tailor its settings to your specific needs. Behind the Strategy – How It Works: The Solar Flare is rooted in a combination of technical anal

Unlock the Power of the Storm Break Indicator The Storm Break Indicator is a cutting-edge tool designed to identify precise market entry points using the proven logic of Bollinger Bands. While this indicator is not optimized out of the box, it offers you an exceptional opportunity to tailor it to your trading style and maximize its potential. What Makes the Storm Break Indicator Unique? Core Logic: The indicator leverages Bollinger Bands, a time-tested technical analysis tool, to identify overb

Visual EMA CrossPro - Your Ultimate Trading Companion! Are you ready to enhance your trading strategy with a powerful yet easy-to-use tool? Introducing the Visual EMA CrossPro, an intelligent indicator designed to help traders identify precise market entry and exit points based on EMA crossovers. For just $65, you get access to a reliable solution to simplify your trading journey. How It Works:
The Visual EMA CrossPro leverages two key EMAs (Exponential Moving Averages) to identify trends and
Visual EMA MultiFlex Indicator - Master the Trends with Precision! Achieve trading mastery with the Visual EMA MultiFlex Indicator, a dynamic tool designed to enhance your decision-making by combining the power of three Exponential Moving Averages (EMAs). Whether you're a beginner or an experienced trader, this indicator is your gateway to identifying precise market entries and exits. How It Works:
The Visual EMA MultiFlex Indicator leverages Short, Medium, and Long EMAs to analyze market momen

Visual EMA PriceSync Indicator Price: $65 Discover a cutting-edge trading indicator designed to synchronize price action with EMA (Exponential Moving Average) trends. The Visual EMA PriceSync Indicator is your ultimate tool for identifying precise market entry and exit points, making it an essential addition to any trader’s arsenal. What does it do?
The indicator detects crossover signals between the price and EMA, which signify potential trend reversals or market corrections. These signals are

The Visual EMA ReversalScout Indicator combines a powerful EMA crossover strategy with RSI-based divergence detection to generate reliable buy and sell signals. Its advanced logic ensures robust and actionable market insights while maintaining flexibility for optimization. Strategy Breakdown: EMA Crossovers: Uses Fast EMA and Slow EMA to identify trend directions and reversals. Bullish signals arise when the Fast EMA crosses above the Slow EMA, indicating an uptrend. Bearish signals occur when

Unleash Your Trading Potential with the Visual EMA SignalLine Pro! This innovative indicator is designed to revolutionize the way you approach trading. While it’s not pre-optimized, its raw power lies in its flexibility and precision, making it a must-have tool for traders eager to fine-tune strategies to their unique style. Why Choose the Visual EMA SignalLine Pro?
The indicator is built around the powerful concept of Exponential Moving Averages (EMA) combined with dynamic signal line strategi

Empower Your Trading Journey with the Visual EMA TrendForce! This advanced indicator is designed to give you the edge you need in the dynamic world of trading. Although it’s not pre-optimized, it provides a robust foundation for traders to customize and optimize according to their unique trading needs. Why Visual EMA TrendForce Stands Out
The indicator leverages the proven strength of Exponential Moving Averages (EMA) combined with trend-detection algorithms. Here’s how it can transform your tr

Visual CrossPulse Indicator The Visual CrossPulse Indicator is a tool designed for precision and ease, combining technical analysis with user-friendly features to identify profitable market opportunities. This hybrid strategy tool integrates the MACD (Moving Average Convergence Divergence) with an optional RSI (Relative Strength Index) filter, visually signaling high-probability trade setups for confident market entries. How It Works The indicator uses the MACD to detect trend momentum shifts.

HistoEdge Indicator HistoEdge is a powerful and customizable MetaTrader 5 indicator designed to provide insights for informed trading decisions. It is not optimized by default, allowing traders to fine-tune it according to their strategies. Key Features Utilizes the MACD histogram to highlight market momentum and potential reversals. Displays fast, slow, and signal periods for a comprehensive view of market dynamics. Fully customizable parameters, including fast period (default: 12), slow perio

Master the Market with the Visual SignalPro Divergence Indicator! Designed for traders who want to uncover hidden opportunities, this indicator is your gateway to identifying high-probability divergence setups. It’s not pre-optimized, giving you the freedom to fine-tune it to match your unique trading style and preferences. What Makes the Visual SignalPro Divergence Indicator Unique?
Divergence is a powerful concept that reveals when price action and momentum indicators move in opposite directi

MACD Momentum Shift Unleash the power of momentum in your trades with the MACD Momentum Shift, an advanced trading indicator based on the Moving Average Convergence Divergence (MACD). This tool is designed for traders who want to optimize and adapt it to their personal trading style. This indicator is not pre-optimized, allowing full customization. Modify MACD fast, slow, and signal periods, as well as the delay between signals, to match different market conditions and strategies. It provides c

Dragon State Indicator is a powerful trading tool designed to empower traders by giving them the foundation to optimize it further. This indicator is not optimized, making it a perfect choice for traders who love to tweak and customize trading tools to suit their unique strategies. The Logic Behind the Indicator The Dragon State Indicator identifies pivotal market movements using these components: Buy and Sell Signals: Buy Signal: Clearly displayed with lime-green arrows when conditions suggest
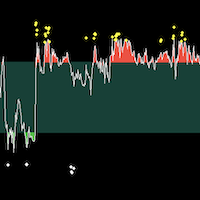
BS Trend Line For MT4是一款很好的买卖指示器,不含有未来函数,不会重绘,新版本已经加入了更好的过滤算法,开单成功率有了很大的提高,是一个很好的波段交易提示器,尤其是配合 SourcePoint For MT4 会有更明显的效果,它能帮你过滤掉接近70%以上的无效交易信号。 ===================参数列表===================== timeframe:M5
gip:30 sip:6 up line:80 down line:20 ===================使用方法===================== 配合 SourcePoint For MT4 使用时, SourcePoint For MT4 的参数 fastP: 96
slowP:208 avgP:72
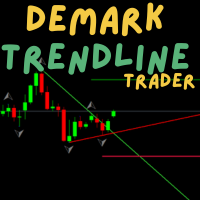
If you are unsure how to use this indicator, please feel free to reach out to me. I will explain it to you and provide reading materials to help you make the most of it. Most effective with TD sequential : MT4: https://www.mql5.com/en/market/product/129509?source=Site +Profile+Seller MT5: https://www.mql5.com/en/market/product/129507?source=Site +Profile+Seller My Other products: https://www.mql5.com/en/users/1700046313/seller
Here’s a brief description of how to use the

Great For Binary options. Works on all timeframes. Recommended for M5 timeframe. one candle expiry. Experienced traders can explore. Strategy is based on price action and multi timeframe analysis. Recommended During high volatility sessions, like the London and new York sessions. For the M1(One minute) timeframe, Traders can use four or five candle expiry, this means it can be applied for 4, 5 or more minutes expiry.
For forex traders, I tested the indicator with the JesVersal universal EA:

Introducing the Phoenix Turn Indicator
The Phoenix Turn indicator is designed for traders who seek to harness the power of precise market-turn detection. This tool provides clear visual cues to identify potential buy and sell opportunities based on dynamic price-action and indicator-based logic. Why Choose Phoenix Turn? Unoptimized for Flexibility: This indicator is provided as a raw tool for you to optimize and customize, fitting perfectly with your unique trading strategy. Clear Visual Signal

Crystal Cross RSI Introducing the Crystal Cross RSI indicator—crafted for traders who seek control over their strategy! This tool is not pre-optimized, leaving room for you to fine-tune and adapt it to your trading style. Key Features: Clear Buy and Sell Signals: Lime arrows highlight buy opportunities, while red arrows signal sell entries—keeping your decisions sharp and informed. Dynamic RSI Analysis: The blue RSI line tracks market momentum, complemented by a signal line for precise crossing

Desert Mirage Indicator Take your trading to the next level with the Desert Mirage Indicator! Designed with flexibility in mind, this tool is your ultimate companion for identifying lucrative opportunities in the forex market. Please note: this indicator is not optimized—it’s built for you to customize and tailor to your unique trading style! Key Features: RSI-Based Signals: Harness the power of the Relative Strength Index (RSI) to spot overbought and oversold market conditions with ease. Gener

Introducing "Dragons Pulse" Are you ready to take your trading strategies to the next level? The Dragons Pulse Indicator is a powerful tool designed with flexibility in mind, empowering you to optimize it according to your unique trading style. While not pre-optimized, this indicator provides you with a foundation to unleash your creativity and craft strategies that truly work for you! Key Features: RSI-Based Insights: Uses the trusted Relative Strength Index (RSI) to analyze market momentum. P
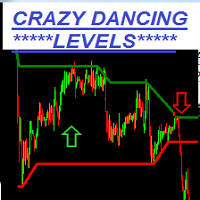
Crazy Dancing moving RES/SUP Levels Automatic redrawing of moving Supports and resistances levels to indicate price breaking supports (signal SELL) or breaking resistance levels (signal BUY) Very simple appearing indicator but very clever and smart too !!!! Main Inputs: # of bars for the support and resistances levels + the initial shift from start + moving average for filter signaling Smaller values for bars /shift inputs when using Higher Time frames (D1-H4) and the reverse higher values for

Introducing the Phoenix RSI Indicator – your gateway to mastering market momentum and identifying profitable trading opportunities! Designed for traders who value control, this indicator comes pre-equipped with powerful features but is intentionally left unoptimized to empower YOU to tailor it to your unique trading strategy. What Makes the Phoenix RSI Indicator Special? Customizable RSI Analysis :
Visualize market momentum with a sleek RSI line directly on your chart.
Adjust the RSI period to

Introducing the Thunder Wave Indicator The Thunder Wave Indicator is a powerful tool designed for traders who love to optimize and tailor their strategies. This indicator is not pre-optimized, giving you full control to adjust it according to your trading style and market conditions. Why Choose Thunder Wave? The Thunder Wave Indicator leverages the Relative Strength Index (RSI) to deliver actionable insights, while incorporating delay and visualization features to ensure precision and clarity.

LevelGuard SmartSMA Indicator Master Support & Resistance Analysis with Precision LevelGuard SmartSMA is a powerful tool designed to simplify your trading decisions by identifying dynamic support and resistance levels. This indicator leverages moving averages to provide precise insights into market movements, helping traders master their strategy with confidence. How It Works Core Strategy: Uses a central SMA (e.g., 50 or 200-period) as a dynamic support or resistance line. Additional SMAs (opt
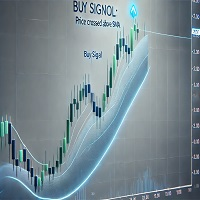
The PriceBreak SmartSMA Indicator is designed for traders who want a powerful price action tool with full customization options. It offers valuable insights into market trends and potential trading opportunities, allowing you to refine your strategy to fit any market condition. How It Works SMA Crossover Logic Uses a 20-period SMA (customizable) to identify market trends. Buy Signals: Triggered when price crosses above the SMA. Sell Signals: Triggered when price crosses below the SMA. You can a

The "Pure Directional SMA Indicator" is a powerful tool designed for traders seeking precise trend direction and actionable signals. This indicator is not pre-optimized, offering flexibility to tailor it to your unique trading style and market preferences. The Logic Behind the Indicator:
At its core, this indicator uses Simple Moving Averages (SMAs) to determine trend direction and generate buy/sell signals. Here's how it works: Three SMA Lines: Short SMA : Reacts quickly to price changes, ide
Engulfing Pattern Indicator Introducing the Engulfing Pattern Indicator. Are you ready to take your trading strategy to the next level? The Engulfing Pattern Indicator is your ultimate tool to spot powerful market reversals and trends based on the time-tested Engulfing Candlestick Pattern. This indicator is crafted to provide you with actionable insights, but remember: it’s not optimized—you have the freedom to optimize it to suit your trading needs. Why the Engulfing Pattern? The Engulfing Pat

Unleash the power of precision trading with the RangeRider SmartSMA Indicator!
This tool is not optimized, providing you with the ultimate freedom to customize it according to your trading strategy. Perfect for traders seeking control and adaptability, this indicator is designed to help you refine your approach and optimize for success. How it Works:
The RangeRider SmartSMA Indicator combines Simple Moving Average (SMA) calculations with Range and Relative Strength Index (RSI) thresholds to pro

The Visual SmartSMA Indicator MT4 is a versatile tool designed to assist traders in identifying potential buy and sell signals based on Simple Moving Average (SMA) crossovers. With advanced customization options and additional divergence analysis, this indicator provides a clear visual representation of potential market entries while allowing traders to tailor the strategy to their preferences. Features and Highlights: SMA Crossover Detection : Tracks Fast and Slow SMA interactions to generate

Visual Simple Cross Indicator Unlock the power of moving average crossovers with this sleek, fully visual indicator designed to help you identify buy and sell opportunities directly on your chart. The Visual Simple Cross Indicator is simple yet versatile, catering to traders who prefer a no-frills approach to trend-following strategies. Features & Benefits: Customizable Moving Averages: Configure the fast and slow MA periods, methods, and applied prices to suit your trading style. Clear Buy & S

Unlock the Power of Precision with the Storm Peak Indicator! The Visual Storm Peak Indicator is a sophisticated, signal-driven tool designed for traders who seek clear and actionable market insights. It's built on a robust logic foundation, leveraging the Commodity Channel Index (CCI) to identify market peaks and reversals effectively. While the indicator comes with a pre-set structure, it has been specifically created for you to optimize and adapt to your unique trading style. Why Choose the S

Wind Shift Indicator Are you ready to harness market shifts with precision? The Wind Shift Indicator is your tool for identifying potential reversals and trend continuations. Designed for traders who prefer to fine-tune their tools, this indicator is not optimized, giving you the freedom to tailor it to your unique trading style. Logic Behind the Strategy: The Wind Shift Indicator employs a combination of Commodity Channel Index (CCI) logic and visual signal plotting to detect shifts in market

Trend Line Magical : Your Trusted Indicator for MetaTrader 4
The Trend Line Magical is a powerful indicator for MetaTrader 4, designed to identify the most relevant trends in the financial market. If you are looking for a tool that accurately anticipates movements, Trend Line Magical is the ally you need.
Trend Line Magical is an indicator which is based on natural trading principles of the market which include volatility and volume analysis. The indicator can be used with any time frame a
The indicator can be used as a standalone trading system or can be part of any system you are currently using. This is because the indicator deals with the aspects of the market that are very important for any strategy. The indicator can be used to enter with or against the trend and also as a tool that shows the ideal exit position where you can close your trades. The indicator is very easy to use. All you need to do is attach the indicator to your chart and follow its signals according to your
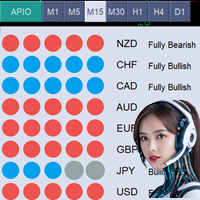
Ürünün mevcut fiyatı 49$'dır ve sınırlı bir süre için geçerlidir. Bir sonraki fiyat 99$ olacaktır. All Power In One (APIO) Göstergesi All Power In One (APIO) göstergesi, USD, EUR, GBP ve diğer ana para birimlerinin gücünü değerlendirmek için tasarlanmış güçlü bir araçtır. Seçilen zaman dilimlerinde farklı döviz çiftlerinin hareketlerini ve yönlerini analiz ederek, APIO, traderlara para birimlerinin gücü ve potansiyel ticaret fırsatları hakkında net bir anlayış sunar. APIO'nun MT5 versiyonu mevc

Binary SS , ikili opsiyon ticareti için kullanılan bir araçtır ve: Herhangi bir zaman diliminde çalışır. Tüm döviz çiftleriyle uyumludur. Trende dayalı yüksek doğrulukta sinyaller üretir. Nasıl çalışır? Bir sonraki mum için sinyal , mevcut mum kapanmadan önce grafikte bir ok olarak görünür: Mavi ok — alım sinyali. Kırmızı ok — satış sinyali. Varsayılan vade süresi 1 mum dur, ayarlardan 1 ile 4 mum arasında değiştirilebilir. Kurulum: "MQL5" klasörünü indirin :
Buradan indirin . Terminal

Zone to Zone Indicator for MT4 Introducing the "Zone to Zone" indicator for MetaTrader 4, designed to enhance your trading strategy with precision and versatility. Key Features: Accurate Historical Resistance/Support Zones : Effortlessly identify key resistance and support zones on your chart, drawn with pinpoint accuracy. Highly Configurable : Tailor the indicator to your specific needs with a wide range of input parameters. Customizable Parameters : Specify the length, width, and number of hig

FIFTY göstergesi artık manuel seviye çizme ihtiyacını ortadan kaldıran otomatik bir versiyonla sunulmaktadır. Bu versiyon, günlük, haftalık, aylık ve yıllık seviyeleri otomatik olarak grafiğe çizer, böylece doğruluk sağlanır ve zaman tasarrufu yapılır. Ayrıca, bu seviyelerin görünürlüğünü açıp kapatmak için düğmeler mevcuttur, bu da tamamen özelleştirilebilir bir kullanım sunar. Manuel kullanımı tercih edenler için, göstergeyi ücretsiz versiyonu hâlâ mevcut olup tam işlevselliğe sahiptir. Böylec
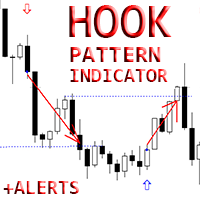
Crypto_Forex Göstergesi MT4 için "Kanca deseni".
- Gösterge "Kanca deseni" Fiyat Hareketi ticareti için çok güçlü bir göstergedir: Yeniden boyama yok, gecikme yok; - Gösterge grafikte boğa ve ayı Kanca desenlerini algılar: - Boğa Kancası - Grafikte mavi ok sinyali (resimlere bakın). - Ayı Kancası - Grafikte kırmızı ok sinyali (resimlere bakın). - PC, Mobil ve E-posta uyarılarıyla. - Gösterge "Kanca deseni" Destek/Direnç Seviyeleriyle birleştirmek için iyidir.
// Harika Ticaret Robotları ve Gö
The ChannelSgnals Indicator for MT4 is an effective Forex trading tool designed to track market movements. The MT4 signal point indicator effectively detects trend reversals after they have already occurred. The ChannelSgnals Indicator is a fully automated technical tool that includes a number of parameters to track market trends. It automatically examines the ever-changing price dynamics of the market, compares the information with earlier data and generates a trading signal. Because the
FREE

New Support and Resistance Indicator with Probabilities and Alerts Description: Maximize your profits with the newest Support and Resistance indicator! Our indicator automatically calculates support and resistance levels based on 24-hour analysis periods and provides detailed probabilities for each level. Additionally, you can set up custom alerts to be notified when the price touches specific levels, directly on your mobile device. Features: Support and resistance analysis based on hourly data
FREE
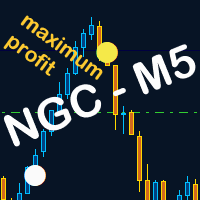
NGC indicator - M5
I recommend the M5 and M15 timeframes and a target profit of 5, 7, 10 pips or an exit at the Murray Math lines.
The indicator provides very accurate signals.
Although it works on any time frame, on the longer time frames the trading signals are much less frequent.
This can be compensated for by trading multiple currency pairs.
NGC - M5 is designed to help traders accurately identify potential trend reversals.
Because the indicator signal is so easy to understand, even i

Moving Average Stack: MA Stack single timeframe, multi-timeframe and multi-currency versions for MT4 (Metatrader 4) Very useful for finding current and higher timeframe trends. Best suited for long term trend based trading. For quick scalping use fewer moving averages. And not suitable during low volatility. Only use during high volatility and steady trending markets. Use this to enhance your existing Trend based strategies to find best trends. Instead of using as a standalone indicator.
You ca
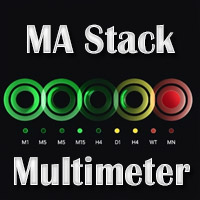
Basic MA Stack Indicator: This is a single timeframe & single currency indicator. It looks at MAs and show 3 possible states on chart: When all MA Align Upwards: Stack Up When all MA Align Downwards: Stack Down If MAs not aligned: Stack None Available for free here: https://www.mql5.com/en/market/product/69539
You can position the small block on your chart. And get current status of the Stack. It is simplistic and very eash to use and can guide you to find good trends in your strategies. Buy St
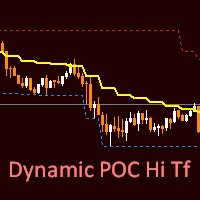
The new Dynamic PACK Hi Tf indicator is based on tick volumes. The middle line shows the average price for the selected period of the selected senior timeframe. The upper and lower lines show the maximum/minimum of the same selected period of the same timeframe. In the settings, the user can optionally choose which timeframe and bar calculation period he needs. You can also change the style, thickness, and color of each of the lines.
In the "StsrtBars" parameter, you can select the start peri

ZLMA Trend Candles indicator uses an enhanced Zero-Lag Moving Average to highlight key trend shifts, repainting candles in real time. It reacts faster than traditional moving averages, helping you spot potential market turns earlier. Gain clear entry and exit signals and filter out market noise with ease! This product is also available for MetaTrader 5 => https://www.mql5.com/en/market/product/129278 1. What Is ZLMA Trend Candles?
ZLMA Trend Candles is a MetaTrader 4/5 indicator based on the Z

The Dead Fish Pattern Indicator is a refined adaptation of the Quasimodo (QM) pattern, originally taught by Cikgu Mansor Sapari. This specialized tool focuses exclusively on bullish setups in uptrending markets, deliberately omitting bearish patterns due to their higher likelihood of generating false signals.
The pattern follows the classic QM structure of Low (L) - High (H) - Lower Low (LL) - Higher High (HH), but with an innovative twist in its execution strategy. When the pattern forms, the

Divergentor — это продвинутый индикатор предназначенный для выявления дивергенции - точек расхождения цены у двух различных пар с известной корреляцией. Например EURUSD и индекса доллара DXY, USDCHF и EURUSD, ETHUSD и BTCUSD, Nasdaq100 и SP500 и тп. Индикатор использует фундаментальную закономерность движения цены за основным активом и дает преимущество в более раннем определении разворота на текущей паре. Индикатор может быть использован как готовая стратегия входа. Идеально подходит как для
MetaTrader mağazası, MetaTrader platformu için uygulama satın almak adına rahat ve güvenli bir ortam sunar. Strateji Sınayıcıda test etmek için Uzman Danışmanların ve göstergelerin ücretsiz demo sürümlerini doğrudan terminalinizden indirin.
Performanslarını izlemek için uygulamaları farklı modlarda test edin ve MQL5.community ödeme sistemini kullanarak istediğiniz ürün için ödeme yapın.
Alım-satım fırsatlarını kaçırıyorsunuz:
- Ücretsiz alım-satım uygulamaları
- İşlem kopyalama için 8.000'den fazla sinyal
- Finansal piyasaları keşfetmek için ekonomik haberler
Kayıt
Giriş yap
Gizlilik ve Veri Koruma Politikasını ve MQL5.com Kullanım Şartlarını kabul edersiniz
Hesabınız yoksa, lütfen kaydolun
MQL5.com web sitesine giriş yapmak için çerezlerin kullanımına izin vermelisiniz.
Lütfen tarayıcınızda gerekli ayarı etkinleştirin, aksi takdirde giriş yapamazsınız.