YouTube'dan Mağaza ile ilgili eğitici videoları izleyin
Bir alım-satım robotu veya gösterge nasıl satın alınır?
Uzman Danışmanınızı
sanal sunucuda çalıştırın
sanal sunucuda çalıştırın
Satın almadan önce göstergeyi/alım-satım robotunu test edin
Mağazada kazanç sağlamak ister misiniz?
Satış için bir ürün nasıl sunulur?
MetaTrader 4 için yeni teknik göstergeler - 8
Introduction to the use of MT4 platform AI Color Gradient Volume indicators I. Overview of indicators
AI Color Gradient Volume is an innovative volume analysis indicator based on artificial intelligence technology for the MT4 platform. By converting the volume data into an intuitive color gradient graph, it helps traders to have a more acute insight into the inflow and outflow of funds in the market and the strength of the buying and selling forces, so as to provide strong support for trading

The Pure Price Action ICT Tools indicator is designed for pure price action analysis, automatically identifying real-time market structures, liquidity levels, order & breaker blocks, and liquidity voids. Its unique feature lies in its exclusive reliance on price patterns, without being constrained by any user-defined inputs, ensuring a robust and objective analysis of market dynamics. Key Features Market Structures A Market Structure Shift, also known as a Change of Character (CHoCH), is a pivot
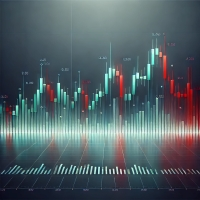
Description of Support and Resistance Indicator Based on Volume Profile for MetaTrader 4 Introduction The financial market is an arena where traders and investors constantly seek ways to gain a competitive edge. One of the most widely used and respected concepts in any market is support and resistance . These levels represent key price zones where supply and demand balance out, and where significant decisions are made by participants who drive the market. Our Support and Resistance Indicator wit
This custom trading indicator utilizes the Average True Range (ATR) to identify buy and sell opportunities based on price movement. It can optionally employ Heikin Ashi candles to reduce noise and produce smoother signals. The indicator is optimized for use on a 1-hour timeframe and is designed for long-term trading strategies. Works best with symbols: AUDUSD, EURUSD, USDJPY, GBPUSD, US500, US30, XAUUSD, BNBUSD Configure Settings : Configure Settings : Set KeyValue to 9.0 . Set ATRPeriod to 11 .
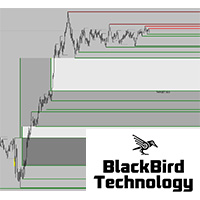
New market liquidity indicator, more accurate with two levels, will really unhide the "hidden agenda" of the price action in any timeframe. Forget all other indicator and use what professional traders are using ! For more information about market liquidity, a manual on how to use this indicator please send me a message.
A lot of information can be found on the net. (search liquidity trading/ inner circle trader)
https://www.youtube.com/watch?v=yUpDZCbNBRI
https://www.youtube.com/watch?v=2LIad2
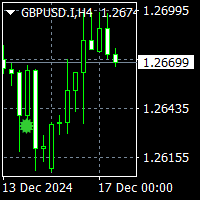
To get access to MT5 version please click here . This is the exact conversion from TradingView: "Exit-Willy Alerts" by " barrettdenning ". This is a light-load processing and non-repaint indicator. All input options are available. Buffers are available for processing in EAs. You can message in private chat for further changes you need. Thanks for downloading
HTF Heiken Ashi Candles MT4is an indicator which plots the bigger version of the higher time-frame Heiken Ashi Candles on the lower candle. The indicator plots only closed candles, with no lag or repainting. i.e. Once the higher time-frame candle has closed, it is immediately plotted on the lower time-frame. this is done to keep your chart simple, and make you more focused.
The indicator also allows you to choose different higher time-frames for each lower time-frame at the first loading of the
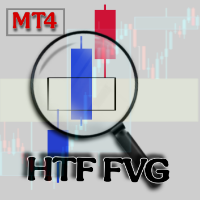
HTF Fair Value Gaps MT4 is an indicator which plots the bigger version of the higher time-frame Fair Value gaps on the lower time-frame chart. The indicator plots only fair value gaps from closed candles, with no lag or repainting. i.e. Once the higher time-frame candle has closed, if it left behind a fair value gap, it is immediately plotted on the lower time-frame. The FVGs can be plotted in three ways, which can be selected via input.
Only on last candle: In this case the FVG will be plotted

Wave Trend Pro: Market Trend Analysis Tool Key Features Smart Signal Analysis Provides structured BUY/SELL signal insights Helps detect potential trend reversals Assists in exit point identification Offers real-time market condition tracking Advanced Visual Analytics Color-coded trend strength representation Dynamic trend momentum evaluation Market volatility tracking system Noise reduction filtering for clarity Performance Benefits Designed for efficient signal processing Developed to improve
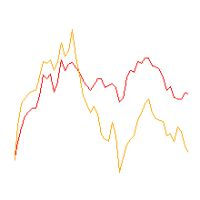
Line1: simple calculation of change in closing price for the chosen input period - named Velocity. Line2: simple calculation of change in velocity for the chosen input period - named Acceleration. Feel free to play with the input periods to find a profitable combination. For faster results it is best to do it in MT Optimizer. Can assist in either manual or automatic trading.

After your purchase, feel free to contact me for more details on how to receive a bonus indicator called VFI, which pairs perfectly with Easy Breakout for enhanced confluence!
Easy Breakout is a powerful price action trading system built on one of the most popular and widely trusted strategies among traders: the Breakout strategy ! This indicator delivers crystal-clear Buy and Sell signals based on breakouts from key support and resistance zones. Unlike typical breakout indicators, it levera

Upper and Lower Reversal - Tersine dönme anlarının erken tahminine yönelik sistem. Üst ve alt fiyat hareket kanallarının sınırlarında fiyat dönüm noktalarını bulmanızı sağlar.
Gösterge asla sinyal oklarının konumunu yeniden renklendirmez veya değiştirmez. Kırmızı oklar alış sinyali, Mavi oklar ise satış sinyalidir.
Herhangi bir zaman dilimine ve ticaret aracına göre ayarlanır Gösterge yeniden çizilmez, yalnızca mum kapandığında çalışır. Sinyaller için çeşitli uyarı türleri vardır Göstergenin k

Special offer : ALL TOOLS , just $35 each! New tools will be $30 for the first week or the first 3 purchases ! Trading Tools Channel on MQL5 : Join my MQL5 channel to update the latest news from me Supertrend Fakeout Göstergesi, klasik Supertrend göstergesinin geliştirilmiş bir versiyonudur ve daha güvenilir trend sinyalleri sunmak için tasarlanmıştır. Fakeout Index Limit ve Fakeout ATR Mult gibi gelişmiş özellikler sayesinde, bu gösterge kısa vadeli fiyat dalgalanmaları veya piyas
FREE
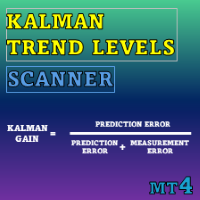
Special offer : ALL TOOLS , just $35 each! New tools will be $30 for the first week or the first 3 purchases ! Trading Tools Channel on MQL5 : Join my MQL5 channel to update the latest news from me Kalman Trend Levels , ileri düzey Kalman filtre teknolojisini kullanan, trend takipli bir gösterge olup traderlara güçlü analitik sinyaller sunar. Hassasiyet ve uyarlanabilirlik için tasarlanmış bu araç, yalnızca kritik destek ve direnç bölgelerini belirlemekle kalmaz, aynı zamanda piyas
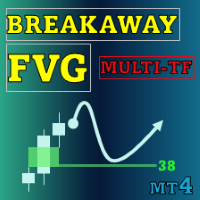
Special offer : ALL TOOLS , just $35 each! New tools will be $30 for the first week or the first 3 purchases ! Trading Tools Channel on MQL5 : Join my MQL5 channel to update the latest news from me Breakaway Fair Value Gaps (FVG) aracı, fiyatın dengeden uzaklaştığı alanları tanımlamak için tasarlanmış, tüccarlara derinlemesine içgörüler sağlayan son teknoloji bir çözümdür. Bu araç yalnızca kritik sinyalleri vurgulamakla kalmaz, aynı zamanda karar verme doğruluğunu artırmak için gel
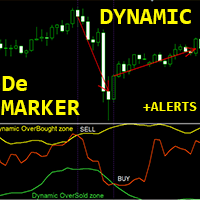
MT4 için "Dinamik Aşırı Satış/Aşırı Satın Alma bölgeli DeMarker" Forex Göstergesi. Yeniden boyama yok.
- DeMarker osilatör eğrisi, gösterge hesaplama dönemi boyunca önceki yüksek ve düşük seviyelere göre mevcut fiyat pozisyonunu gösterir. - Dinamik Aşırı Satın Alma bölgesinden Satış girişleri ve dinamik Aşırı Satın Alma bölgesinden Satın Alma girişleri yapmak harikadır. - Bu gösterge, Price_Action girişleriyle birleştirmek için de mükemmeldir. - Dinamik Aşırı Satın Alma bölgesi - sarı çizginin
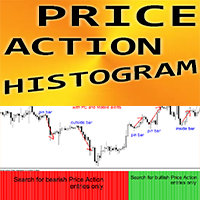
Price_Action Filtre Histogramı - Fiyat Hareketi ticareti için etkili bir yardımcı ticaret aracıdır! Yeniden boyama yok.
Bu gösterge, yatırımcıya girişlerin yönünü önerir. Ardından yatırımcının tek yapması gereken o yöndeki Fiyat Hareketi sinyallerini aramaktır. Fiyat Hareketi Filtre Histogramı, Fiyat Hareketi desenleri ve destek/direnç seviyeleriyle birleştirilmelidir Yeşil renkli histogram - Boğa girişlerini arayın Kırmızı renkli histogram - Ayı girişlerini arayın Bu göstergeyle standart stra
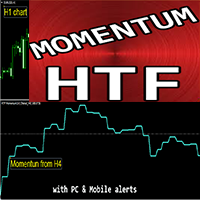
MT4 için Forex Göstergesi "HTF Momentum".
- HTF Momentum, fiyat değişim oranını ölçen önde gelen göstergelerden biridir. HTF, şu anlama gelir - Daha Yüksek Zaman Çerçevesi - Bu gösterge, trend yönünü gösterir ve mevcut ve geçmiş değerleri karşılaştırarak fiyat değişiminin hızını ölçer - HTF Momentum göstergesi, Scalping girişleri veya diğer göstergelerle kombinasyon halinde Çoklu Zaman Çerçevesi ticaret sistemleri için mükemmeldir. - Bu Gösterge, Daha Yüksek zaman çerçevesinden Momentum'u mevc
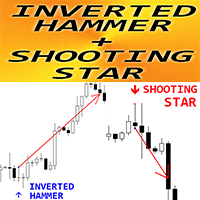
MT4 için Forex Göstergesi "Ters Çekiç ve Kayan Yıldız deseni"
- "Ters Çekiç ve Kayan Yıldız deseni" göstergesi, Fiyat Hareketi ticareti için çok güçlü bir göstergedir: Yeniden boyama yok, gecikme yok; - Gösterge, grafikte boğa Ters Çekiç ve ayı Kayan Yıldız desenlerini algılar: - Boğa Ters Çekiç - Grafikte mavi ok sinyali (resimlere bakın) - Ayı Kayan Yıldız - Grafikte kırmızı ok sinyali (resimlere bakın) - PC, Mobil ve E-posta uyarıları dahildir - "Ters Çekiç ve Kayan Yıldız" göstergesi, Dest
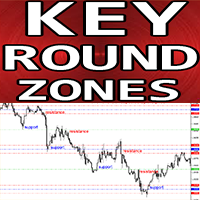
MT4 için Forex Göstergesi "Anahtar Tur Bölgeleri".
- "Anahtar Tur Bölgeleri" göstergesi, destek/direnci dikkate alan yatırımcılar için olmazsa olmaz bir yardımcı göstergedir. - 1000 ve 500 tur seviyeleri fiyat tarafından saygı görür - fiyat bunlardan çok sık geri döner. - Büyük 1000 seviyelerinin etrafında ayrıca güçlü Destek/Direnç bölgeleri (her tarafta 100 puan) bulunur. - Ayrıca 1000 ve 500 tur seviyeleri, Kar Al (tur seviyesinin önünde) ve SL (tur seviyesinin arkasında) yerleştirmek için
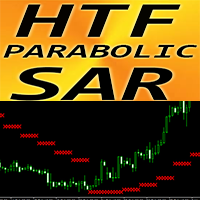
Forex Göstergesi Parabolik SAR MT4 için Daha Yüksek Zaman Çerçevesi. Yeniden boyama yok.
- MT4 için harika bir yardımcı HTF PSAR göstergesi ile işlem yöntemlerinizi yükseltin. HTF, Daha Yüksek Zaman Çerçevesi anlamına gelir. - PSAR, trend yönünü ve fiyat hareketindeki olası geri dönüşleri belirlemek için kullanılır. - Bu gösterge, Trailing Stop amacıyla kullanmak için harikadır. - PSAR fiyatın üzerinde yer alıyorsa - bu aşağı yönlü bir trenddir. - PSAR fiyatın altında yer alıyorsa - bu yukarı
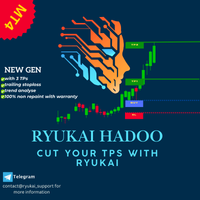
THER IS ERREUR WHILE UPLOADING THE FILE PLEAS CONTACT ME FOR FREE TRIAL RYUKAI HADOO is a professional and easy to use Forex trading system which is based on the best principles of trading using the best estrategys. The indicator provides accurate BUY and SELL signals including Stop Loss and Take Profit levels. You can trade even on the go using PUSH notifications. PLEASE CONTACT ME AFTER PURCHASE TO GET MY TRADING TIPS! If you're familiar with trading, you’ve likely come across popular strate
The Circle Intelligent Trend Indicator is a cutting-edge tool designed for MetaTrader 4 users who demand efficiency. This indicator brings the seamless TradingView experience directly to MT4, eliminating the need for templates and simplifying your trading setup.
Its standout feature is the Circle buy and sell signals, which are optimized for multi-timeframe analysis, allowing traders to make informed decisions with confidence. Whether you’re scalping, day trading or swing trading, the Circle I

The ABC Indicator analyzes the market through waves, impulses, and trends, helping identify key reversal and trend-change points. It automatically detects waves A, B, and C, along with stop-loss and take-profit levels. A reliable tool to enhance the accuracy and efficiency of your trading. This product is also available for MetaTrader 5 => https://www.mql5.com/en/market/product/128178 Key Features of the Indicator:
1. Wave and Trend Identification: - Automatic detection of waves based on mov

Super M5
Welcome back to my page!
Features:
- The Super M5 is actually a complex of three indicators.
- Super M5 was built specifically for the M5 timeframe and all currency pairs.
- Super M5 indicator provides accurate BUY and SELL signals.
- The indicator is perfect for scalping.
- The indicator is easy to use.
- With a simple and intuitive interface, the indicator displays clear arrows on the map, making it easy to interpret and act on signals.
When it detects a good entry point, it

The 50% level holds significant importance in the market because it acts as a dividing line between bullish and bearish movements. Traders often rely on this midpoint to analyze trends and predict potential reversals. It is among the most logical and widely recognized concepts in financial markets. The 50% level also serves as a psychological barrier, influencing decisions of both retail and institutional traders, making it a cornerstone in technical analysis. One of the few indicators on the ma
FREE
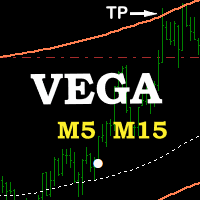
VEGA indicator
VEGA is an indicator designed for scalping and short-term trading, integrated into any chart and financial instrument.
I recommend the M5 and M15 timeframes. The VEGA indicator provides accurate signals.
The indicator uses color-coded circles to signal trading opportunities:
- If a white circle appears, open a buy position (you will receive a BUY alert).
- If a yellow circle appears, open a sell position (you will receive a SELL alert).
I also suggest that you use the inter

The "BioStar" indicator is an innovative tool for trend analysis on the Forex market. It has unique capabilities and a wide range of settings that will help traders make informed decisions when trading.
This indicator is based on the analysis of the market trend and helps to identify the direction of price movement. It uses various mathematical algorithms and statistical methods to determine the strength and stability of the trend in the market.
One of the key features of the "BioStar" indica

Moving average alert plus is an advance moving average alert that will easily monitor the price action based on set moving averages to multiple open charts. Objective: To monitor multiple open charts and notify traders conveniently in a single display panel when using the moving averages to enter/exit a trade. Features: Monitor price action in two timeframes at the same time Supports simple, exponential, smoothed, linear weighted moving averages Trigger an alert based on candle size (full/
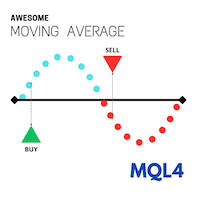
Overview
Discover a powerful yet simple indicator to identify market trends effectively! Awesome Moving Average (AWMA) is designed to detect bullish or bearish trends by analyzing price breakouts beyond the moving average line. Basically, the way this indicator works is similar to the Moving Average indicator available on the MetaTrader platform. As we know, the Moving Average indicator tends to be difficult to use when the market is in a sideways condition because it often gives false breakou
FREE

Hello, I need reviews from you guys. Thank you Fractal Swing Detector Pro Indicator is designed to help traders identify key swing points in the market . By combining fractal an d pivot analysis, this indicator provides deeper insights into price movements an d potential reversals. Key Features: Fractal Analysis: Identify high and low fractals with the option to use either 3 or 5 bar fractals . Fractals help detect minor reversal points within trends. Pivot Points: Advance d pivot
FREE

The Breakaway Fair Value Gap (FVG) is a typical FVG located at a point where the price is breaking new Highs or Lows.
USAGE Figure 1 In the figure 1, the price range is visualized by Donchian Channels.
In theory, the Breakaway FVGs should generally be a good indication of market participation, showing favor in the FVG's breaking direction. This is a combination of buyers or sellers pushing markets quickly while already at the highest high or lowest low in recent history. Figure 2 Whi
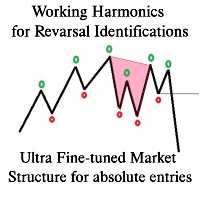
Last & Ultimate Indictor a trader would ever need while trading.
Confirmation Based Harmonic Patterns for Trend Reversal Identification .
Ultra finetuned Candle Based Market structure(not pivot or average based like other noisy indicators) for a sniper & confirmational Entry Added false breakout entry for dual parameter low risk entry
This is the finest structure marking you will ever find in any market. indicator is coded based on actual candle breaks and not coded base
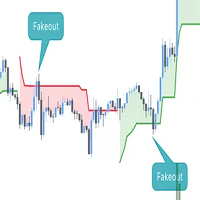
This script is an enhanced version of the classic Supertrend indicator. It incorporates an additional feature that ensures trend reversals are more reliable by introducing a Fakeout Index Limit and a Fakeout ATR Mult. This helps avoid false trend changes that could occur due to short-term price fluctuations or market noise. In smart money concept, when institute , "big-fish" want to buy, they usually sell first to take sellside liquidity and vice versal. This is why the indicator become importan

Super Scalp Indicator MT4 is a unique trend reversal 100% non-repainting multi-algo indicator that can be used on all symbols/instruments: forex, commodities, cryptocurrencies, indices, stocks . Super Scalp Indicator MT4 will determine the current trend at its early stages, gathering information and data from up to 10 standard algos When indicator give a valid buy or sell signal, a corresponding arrow will be printed on the chart, open trade at start of the next candle/bar

This product enables you to trade in opportunities that are detected by the indicator. Using advanced Calculations and formulae this product enables you to profit from trend opportunities. Trend master has Channels that show areas the trend is strong and you are likely to profit. Once this zone Is breached the price is on in uncertain territory and there is no guarantee the trend will continue This means there might be reversal and it is advisable to exit a trade here.

Do you want to beat the market? This indicator uses advanced mathematical formulae That include regression analysis to predict market trends. So what happens is That when the price is above the indicator line as depicted in the screenshot The trend is rising and when the price is below the indicator line the Trend is falling. This opportunities appear multiple times each day enabling You to profit. This indicator makes the trend your friend.
Bollinger trading is an indicator for mt4 that uses Bollinger bands and other trend following strategies To detect the direction of the market. Just as attached in the screenshot the light blue line shows areas The market is rising. This means opening positions here is in the direction of the trend. The dark blue lines cane be used for sell trades when the market moves in the opposing direction. Using this tactics you can have a clear sense of where the market is headed.

This product works by detecting trend opportunities. So as shown in the screenshot when The indicator shows an upward arrow it shows the market is on an uptrend and when the indicator Shows a downward arrow it shows the market is on a downward direction. What makes this indicator Special is that it has additional signals just below the arrow signals. It is up to the trader to be Creative and combine these signals with the arrow signal to get accurate forecasts.

Manh RSICrossingAlert with Alert Indicator is a versatile technical analysis tool that aids traders in identifying market trends and potential entry and exit points. It features a dynamic Manh RSICrossingAlert , adapting to market conditions for a clear visual representation of trend direction. Traders can customize parameters to align with their preferences and risk tolerance. The indicator assists in trend identification, signals potential reversals, serves as a trailing stop mechanism, and p

Best Divergence Indicator for advanced traders without distraction of lines or arrows. It is not a magic blackbox for novice traders rather a great tool for experienced traders to decide their entry and exit. Can be used for most of the Forex pairs, Gold, Oil, Crypto. Flexibility to play with input to customize ur unique research too. Therefore, I will suggest turning off arrows and divergence line to reduce clutter and instead use the following advice: For sell on divergence indicator start tu

Special offer : ALL TOOLS , just $35 each! New tools will be $30 for the first week or the first 3 purchases ! Trading Tools Channel on MQL5 : Join my MQL5 channel to update the latest news from me Volumatic VIDYA (Variable Index Dynamic Average) , trendleri izlemek ve her trend aşamasında alım-satım baskısını analiz etmek için tasarlanmış gelişmiş bir göstergedir. Dinamik Ortalama Değişken Endeksi (Variable Index Dynamic Average) temel bir dinamik düzleştirme tekniği olarak kullan
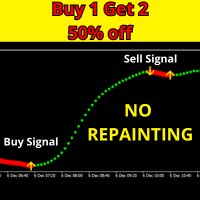
Başlıca Özellikler: Gelişmiş ve Test Edilmiş Algoritma: Scalper Trend Signals No Repaint , piyasanın en optimize edilmiş algoritmalarından biriyle donatılmıştır, böylece doğru ve güvenilir trend analizleri sağlar. Dünya çapında yapılan 15.000'den fazla test ile her seviyedeki işlemciler için son derece etkili bir araçtır. Yanlış Sinyalleri Engelleyen Özel Filtreler: Yeni gösterge, yanlış sinyalleri en aza indiren özel algoritma filtreleri ile donatılmıştır. Bu, özellikle scalping stratejisi kull

GOLDEN ARROW SCALPER! Ana Özellikler: Doğru Giriş Sinyalleri : Matematiksel hesaplamalara dayalı olarak piyasaya giriş için ideal zamanları belirleyin ve ticaret kararlarınızı optimize edin. Anlık Uyarılar : Ticaret sinyalleri oluşturulduğunda anında sesli bildirimler alın. Özelleştirilebilir Ayarlar : EMA parametrelerini ayarlayarak göstergenizi ticaret stratejiniz ve tarzınıza göre uyarlayın. Intuitif Görselleştirme : Kontrast renkler (Deniz Yeşili ve Kırmızı) kullanarak sinyalleri vurgulayın

The Scalper Boss indicator is a cutting-edge analytical tool designed to assess market conditions and identify optimal entry and exit points using a multi-layered logic framework. It adapts to changing market environments, providing traders with clear visual signals and trend lines. Its primary value lies in its ability to enhance market analysis by filtering noise and capturing meaningful movements, making it especially beneficial for scalping and intraday trading. While Scalper Boss does not g
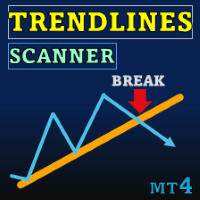
Special offer : ALL TOOLS , just $35 each! New tools will be $30 for the first week or the first 3 purchases ! Trading Tools Channel on MQL5 : Join my MQL5 channel to update the latest news from me Trendlines with Breaks Scanner , traderların kritik trendleri tanımlamasına ve gerçek zamanlı olarak kırılmaları tespit etmesine yardımcı olmak için tasarlanmış son teknoloji bir ticaret aracıdır. Pivot noktalarına dayalı olarak otomatik üretilen trend çizgileri sayesinde, bu gösterge tr
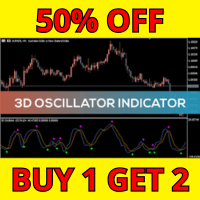
3D Osilatörün 7 Faydası Piyasaya Üçlü Bakış Açısı "3D Osilatör" adı tesadüf değildir. Bu araç, RSI, Stokastik ve CCI gibi üç tanınmış göstergeleri tek bir panelde birleştirir. Bu kombinasyon, piyasaya üç boyutlu bir bakış sunarak gizli trendleri keşfetmenize ve tuzaklardan kaçınmanıza yardımcı olur. Özelleştirilebilir Ayarlar D1RSIPer, D2StochPer ve D3tunnelPer gibi ayarlanabilir parametrelerle, agresif bir scalper ya da sabırlı bir swing trader olsanız da bu gösterge her ticaret tarzına uyum s

Golden Scalper XAU/USD – Altın (XAU/USD) İçin Mükemmel Scalping Ticaret Göstergesi Altın ticaretinde (XAU/USD) scalping stratejilerinizi en üst düzeye çıkarmak isteyen yatırımcılar için Golden Scalper XAU/USD mükemmel bir araçtır. Bu gösterge, ileri düzey desen tanıma tekniklerini kullanarak, yüksek doğruluk oranına sahip giriş sinyalleri oluşturur ve altın piyasasında işlemlerinizi optimize eder. Ana Özellikler: Scalping için Eşsiz Doğruluk: Golden Scalper XAU/USD , altın piyasasına özel olarak
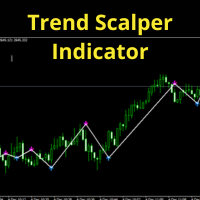
Öne Çıkan Özellikler: Otomatik Model Tanıma: YZ, piyasa hareketlerini gerçek zamanlı analiz ederek yüksek başarı oranıyla tekrar eden modelleri tanımlar. Üçgenler, bayraklar, baş ve omuzlar gibi klasik formasyonları tanımanın yanı sıra, YZ tarafından keşfedilen daha karmaşık modelleri de tanır. Alış ve Satış Sinyalleri: Sinyaller, grafikte yeşil oklarla (alış) ve kırmızı oklarla (satış) doğrudan görüntülenir ve sesli bildirimler ile push bildirimleriyle desteklenir. Otomatik Trend Çizgisi Çizimi
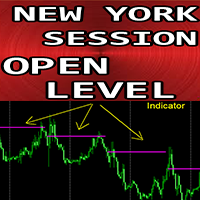
MT4 için "New York Oturum Açılış Seviyesi" Forex Göstergesi
"New York Oturum Açılış Seviyesi" göstergesi, günlük alım satım için çok kullanışlı bir yardımcı göstergedir Seans açılış fiyat seviyesi çok önemlidir çünkü fiyat gün içinde sıklıkla o bölgeye geri döner. Gösterge size her gün için günlük NY oturum açılış fiyat seviyesini gösterir Ayrıca gösterge pazartesi günleri haftalık açılış seviyesini gösterir Gün içi yatırımcıların hedefler belirlemesi veya destek/direnç alanı olarak kullanması
MT4 için Binary exfish Göstergesi Binary exfish göstergesi, M1 ve M5 zaman dilimlerinde ikili opsiyon ticareti için tasarlanmıştır. Herhangi bir döviz çifti ile çalışır, trendleri analiz eder ve grafikte oklar şeklinde giriş sinyalleri sağlar: Mavi ok — alım sinyali. Kırmızı ok — satım sinyali. Özellikler: Varsayılan sona erme süresi : 1 mum. Ayarlanabilir sona erme süresi: 1 ila 3 mum. Sinyaller, mevcut mum kapanmadan önce görüntülenir ve hızlı karar vermeye olanak tanır. Sesli, açılır pencere,

Piyasa Faiz Göstergesi: Ticaret Duygusu Analizinde Avantajınız Temel Faydalar: Gerçek zamanlı piyasa katılımcısı katılımını nicelleştirir Fiyat hareketini ve hacim dinamiklerini harmanlar Geleneksel göstergelerin ötesinde gizli piyasa duyarlılığını ortaya çıkarır Birden fazla zaman dilimi ve varlığa uyarlanabilir Potansiyel trend değişimleri için erken uyarı sistemi Tüccar Avantajları: Pazar coşkusunun arttığı/azaldığı dönemleri belirleyin Potansiyel momentum değişikliklerini tespit edin Hassasi

Please contact me after your full purchase for great bonuses.
Adaptive Reversal Star Expert Advisor and an additional indicator as a gift Info Panel are waiting for you. Adaptive Reversal Star is a new generation indicator with an advanced Adaptive algorithm , which additionally tracks potential reversal points and compares the values of the current market volatility when forming the main signals
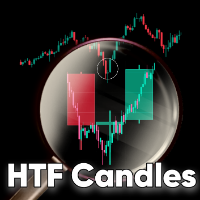
HTF Candles MT4 is a mt4 indicator which plots the outline of the higher time-frame candles on the lower candle, including any MT5 higher time-frame chosen. The indicator plots only closed candles, with no lag or repainting. Features MT5 Period Candles: This indicator plots any mt5 time-frame candle e.g m12, m20... on the lower time-frame. Heiken Ashi Options: You have the option to view the HTF Heiken ashi instead of the normal candleSticks.
No objects drawn on chart: The indicator does not plo
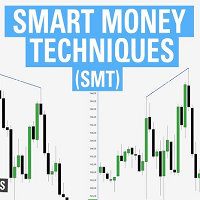
ICT SMT divergence represent a situation in the market where two correlated assets, being seen within the same timeframe, exhibit opposing structure. This can be seen in two positively correlated assets, as one asset forming a higher low, while the other forming a lower low instead of higher low. Version 1.03: Add Higher Timeframe support An ICT SMT divergence serves as the primary signal of reversal for correlated assets. If two positively correlated assets are moving higher and at a point one
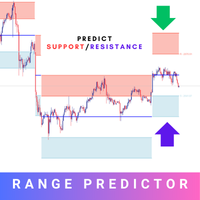
Introducing the Range Predictor : Your Ultimate Guide to Future Trading Ranges! Imagine having the power to see into the future of market moves— Range Predictor brings this dream to life. Designed to deliver real-time, predictive support and resistance levels , this tool goes beyond standard indicators, offering trend direction insights and precise range forecasts . Whether you're a day trader or a swing trader, the Range Predictor is your all-in-one toolkit for mastering the markets. MT5 Ver

The Trend Ultimate Indicator is designed for visualizing and analyzing market trends, allowing traders to quickly assess current market tendencies. It is particularly useful for: Determining the duration of the current trend (bullish or bearish). Providing a clear visualization of price behavior relative to key moving averages and the MACD indicator. Supporting decision-making based on histogram dynamics (trend direction and intensity). Trend Ultimate does not guarantee profit but assists trader
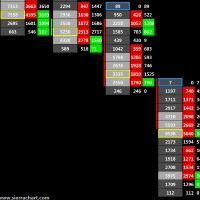
Volume Cluster Indicator for MetaTrader 4: Advanced Analysis of Support, Resistance, and Market Dynamics The Volume Cluster Indicator for MetaTrader 4 is a powerful tool designed for traders seeking an in-depth understanding of market dynamics. It provides detailed insights into volume behavior within each candlestick, highlighting levels where volume is "overpriced" and areas of weakness. This enables precise identification of support and resistance zones, making it indispensable for traders le

This custom indicator for MetaTrader 4 is a powerful tool designed to help traders of all experience levels identify clear trends in the financial market. It is built to provide precise visual support, eliminating the confusion and subjectivity often associated with chart analysis. Additionally, it ensures that you can stay in a profitable position throughout the entire duration of a trend, avoiding premature exits before the movement is fully realized. Identifying Clear Trends The foundation o
Is Zero Lag profitable? Not always, different system is for different pairs. You can play around with this indicator from Mladen, I have modified it with Bollinger Bands over T3.
You can change the period and how it calculate. MT5 version is available too.... Please leave a review , it helps us and we will share more indicators. .... Thank you and happy trading
FREE

The indicator is a histogram that is great for showing when to enter the market
When the hump moves above the median go long and when it moves below the median go short
The colors can be adjusted as preferred
Suitable for any timeframe
Test in demo before purchase
Enjoy -------------------------------------------------------------------------------
Old Time Frame EMA Индикатор двух динамических уровней сопротивления и поддержки Moving Average.
Данный индикатор рисует на открытом графике младшего тайм фрейма, ЕМА со старшего тайм фрейма. Создан для наглядности сигналов, для входа в рынок, для тех трейдеров, у кого Средние Скользящие Цены (ЕМА или МА),
являются основным сигналом для открытия или закрытия сделок. А также ориентиром, направлением тренда в движении
текущих цен, внутри дня и в среднесрочной торговле.
Возможные типы сред

The Market Heart indicator scans market entries after high volatility is noticed. Most big moves occur a short time after market volatility. Most big moves occur a short time after market volatility. The idea is to look for entries after the rectangles form and not necessarily as trade entry signals. . For example, you could use the Retracement Feeder indicator that generates arrow signals.
Market Heart MT5 Version
How to use: 1. Primary use The White Box is the first to be formed and
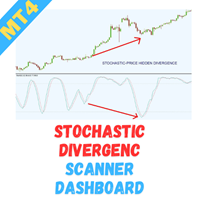
Welcome to the Stochastic Divergence Multicurrency Scanner Dashboard , an advanced tool designed to help traders efficiently detect Stochastic divergence patterns across multiple currency pairs. This scanner enables swift identification of potential reversal opportunities, providing a strategic advantage in your trading endeavors. Key Features: Effortless Multicurrency Scanning Monitor multiple currency pairs in real-time and receive instant alerts when significant Stochastic divergence patterns
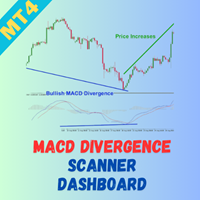
Welcome to the MACD Divergence Multicurrency Scanner Dashboard , a powerful tool designed to help traders quickly detect MACD divergence patterns across multiple currency pairs. This scanner allows for efficient identification of potential reversal signals, giving you a competitive edge in your trading strategy. Key Features: Effortless Multicurrency Scanning Monitor multiple currency pairs in real-time and receive instant alerts when significant MACD divergence patterns are identified. This cap
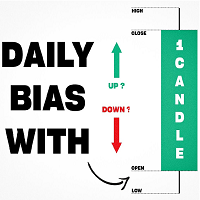
Inspired by TTrades video on daily bias, this indicator aims to develop a higher timeframe bias and collect data on its success rate. While a handful of concepts were introduced in said video, this indicator focuses on one specific method that utilizes previous highs and lows. The following description will outline how the indicator works using the daily timeframe as an example, but the weekly timeframe is also an included option that functions in the exact same manner.
On the daily timefr

This Simple Smart Money Concepts indicator displays real-time market structure (internal & swing BOS / CHoCH), order blocks, premium & discount zones, equal highs & lows, and much more...allowing traders to automatically mark up their charts with widely used price action methodologies.
"Smart Money Concepts" (SMC) is used term amongst price action traders looking to more accurately navigate liquidity & find more optimal points of interest in the market. Trying to determine where institutional

EMA Cloud System is a Trading System Invented by Ripster where areas are shaded between two desired EMAs. The concept that the EMA cloud area serves as support or resistance for Intraday & Swing Trading. Can be utilized effectively on 10 Min for day trading and 1Hr/Daily for Swings. Ripster utilizes various combinations of 5-12 EMA clouds 34-50 EMA clouds among others. 8-9, 20-21 EMA clouds can be used as well. Adjust what works for you. Ideally 5-12 or 5-13 EMA cloud acts as sold fluid Trendlin
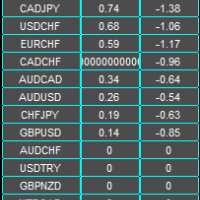
Abbeyfx Swap Dashboard displays your broker swap/interest rate. The implied swap/interest rate differential is for all currency pairs you have in your market watch.
Interest rate differential: The key factor traders consider is the difference in interest rates between two currencies involved in a pair, known as the "interest rate differential
Impact on currency value: A higher interest rate typically makes a currency more attractive, causing its value to rise relative to other currencies with
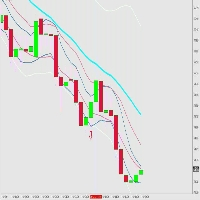
Signal Entry BBMA Low Risk High Reward Entry Friendly Use Using Fibo for TP 1, TP 2 , TP 3 , TP 4, TP 5, TP 6 , TP 7 , TP 8 , TP 9 , TP 10 Entry Low MA or Entry High MA Pair GOLD is The Best Pair EURUSD, GBPUSD, USDJPY Is Good Pair BTCUSD id Good Risk Manajemen only 1% entry and you get Profit 2-10% Recommended Broker https://one.exnesstrack.org/a/yyatk129ng If you want FullMargin Is Good but I recommended using Manajemen your Money
MetaTrader mağazası, geliştiricilerin alım-satım uygulamalarını satabilecekleri basit ve kullanışlı bir sitedir.
Ürününüzü yayınlamanıza yardımcı olacağız ve size Mağaza için ürününüzün açıklamasını nasıl hazırlayacağınızı anlatacağız. Mağazadaki tüm uygulamalar şifreleme korumalıdır ve yalnızca alıcının bilgisayarında çalıştırılabilir. İllegal kopyalama yapılamaz.
Alım-satım fırsatlarını kaçırıyorsunuz:
- Ücretsiz alım-satım uygulamaları
- İşlem kopyalama için 8.000'den fazla sinyal
- Finansal piyasaları keşfetmek için ekonomik haberler
Kayıt
Giriş yap
Gizlilik ve Veri Koruma Politikasını ve MQL5.com Kullanım Şartlarını kabul edersiniz
Hesabınız yoksa, lütfen kaydolun
MQL5.com web sitesine giriş yapmak için çerezlerin kullanımına izin vermelisiniz.
Lütfen tarayıcınızda gerekli ayarı etkinleştirin, aksi takdirde giriş yapamazsınız.