YouTube'dan Mağaza ile ilgili eğitici videoları izleyin
Bir ticaret robotu veya gösterge nasıl satın alınır?
Uzman Danışmanınızı
sanal sunucuda çalıştırın
sanal sunucuda çalıştırın
Satın almadan önce göstergeyi/ticaret robotunu test edin
Mağazada kazanç sağlamak ister misiniz?
Satış için bir ürün nasıl sunulur?
MetaTrader 4 için yeni teknik göstergeler - 42

This indicator tool provides mini charts, with adjustable symbol/tf that can be dragged and resized into place. Lightweight operation with multiple mini charts are supported.
Chart features: adjustable symbol and tf draggable resizeable multiple mini charts color styling and font sizing, foreground/background colors candle coloring candle styles; candles, bars, line, high-low channel
optional background color gradient predfined period separators on all tf's (eg 1hr/1day sep on 1Min, 4hr/1day
Trender is a special TrendLine Indicator because it is combined with a NON-REPAINT Signal Settings: showBars = if showBars= 0 so the indicator will be shown for all the chart PointLevel = Point Levels; 2 = central bar will be higher (lower) then 2 bars on the left side and 2 bars on the right one. qSteps = number of steps/ no more than 3 BackStep = number of steps back startBar= if startBar=0 so we have recommendation for the current bar, if 1 - for possible next bar TrendLine= True = Trendli

This trend following system was designed by Dennis Gartman and Bill Eckhart , and relies on breakouts of historical highs and lows to take and close trades: it is the complete opposite to the "buy low and sell high" approach. This trend following system was taught to a group of average and normal individuals, and almost everyone turned into a profitable trader.
The main rule is "Trade an N-day breakout and take profits when an M-day high or low is breached (N must me above M)" . Example
Indicator Rua Alert Line. This indicator will notify when the High-price of candle breaks any TrendLine or HorizontalLine on the chart. Notifications will be sent to the phone and on MT4. And it have ArrowBuy/ArrowSell on chart. It is very useful for those of you who use the TrendLine or HorizontalLine but do not have time to observe the chart. RuaCoder Zalo_Tel: 033.818.8914 Telegram : https://t.me/Ruacoder
GO Universal Scanner is a simple scanner tool that can be used to scan any indicator on multiple symbols and timeframes. From now on, you don't have to ask anyone for a scanner of your favorite indicator, this scanner can do all the job for you.
You can also jump to the desired symbol and timeframe by simply clicking on the signal on the scanner dashboard. More than that, you the scanner can load your desired template on the newly opened chart. However, please note that, due to mt4 limitations
GT Trend, M1 ve M5 çizelgelerinde işlem yapmak için özel olarak tasarlanmış bir trend göstergesidir. Gösterge, gün içi ticareti tercih eden tüccarlar için idealdir. Bu göstergeyi ticaret sisteminiz için bir temel olarak veya bağımsız bir ticaret çözümü olarak kullanabilirsiniz. Göstergenin kullanımı kolaydır. Sadece sinyalleri takip etmeniz gerekiyor. Ayrıca, bu göstergenin tüm kullanıcılarına ücretsiz olarak ek göstergeler sağlayacağım, bu da bu yöntemin mümkün olduğunca verimli kullanılmasına

İçine Çeken şamdan desenini gösteren bir gösterge. Ayarlarda, yutkunma türünü (gövde, gölge ve kombinasyon) belirtebilirsiniz. Eğilime (2 hareketli ortalama) ve tersine (RSI ve Bollinger Bantları) göre filtrelemek mümkündür. Bu çok popüler bir fiyat hareket modelidir. Çok para birimli gösterge tablosu mevcuttur. Bununla birlikte, grafikler arasında kolayca geçiş yapabilirsiniz.
Ticaret Kalıpları: Trendlere göre tekrar test. Yanlış koparma. Sipariş Bloğu. Başka.
EURUSD, GBPUSD, XAUUSD, ... M
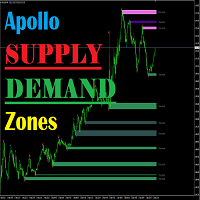
Apollo Arz Talep Bölgeleri, destek ve direnç seviyelerini hesaplayan bir göstergedir. Gösterge, hangi stratejiyi kullandıklarına bakılmaksızın kesinlikle tüm tüccarlar için faydalı olacaktır. Bu gösterge, ticaret sisteminizin ana unsurlarından biri olabilir. Gösterge, hem mevcut zaman dilimindeki seviyeleri hesaplar hem de MTF modunda çalışarak daha yüksek bir zaman dilimindeki seviyeleri gösterir. Bu gösterge kesinlikle herhangi bir zaman diliminde ve herhangi bir ticaret aracıyla kullanılabili

Gösterge, grafikteki terminal RSI osilatörüne dayalı sinyalleri gösterir. Tekrarlanan sinyalleri filtrelemek mümkündür.
Burada osilatör bir ters sinyal aramak için kullanılır. Salıncak stratejilerinde ve seviyelerden alım satımda bir giriş noktası olarak önerilir.
Çok para birimli gösterge tablosu mevcuttur. Bununla birlikte, grafikler arasında kolayca geçiş yapabilirsiniz. Ürün tartışmalarında, panoyu yerleştirebileceğiniz bir algoritma önerebilirsiniz.
Giriş parametreleri.
Ana Ayarlar
FREE

Bu gösterge, aktif ve aktif olmayan işlem seanslarını gösterecek ve ayrıca işlem seansının aktif (1) veya pasif (0) olup olmadığı gibi küresel değişkenleri ayarlayacaktır. iCustom kitaplık işlevini kullanarak, bu göstergeyi bir Uzman Danışmandan veya Komut Dosyasından aşağıdaki gibi çağırabilirsiniz: // Özel göstergeyi çağır iCustom ( Symbol (), PERIOD_D1 , "Market/RedeeCash_TimeZone" , 0 , 0 ,Blue,Red); // global değişkenlerin değerlerini elde etmek double NewYorkSessionIsActive = GlobalVariabl
FREE
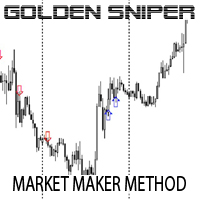
Indicator is based on Market Maker Strategy. NO REPAINT.
MM's are traders and their objective is to make money. This includes strategies to trade against retails traders. The major difference between them and other traders is that they have the ability, through access to massive volumes, to move price at their will. So to make money, they aim to buy at a lower price and then sell at a higher price. They achieve this by: 1. Inducing traders to take positions. This is achieved by using a ran
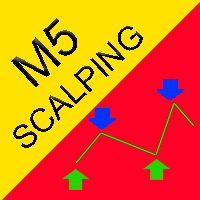
A ready-made trading system that shows with arrows when to buy and when to sell. The indicator does not redraw its arrows. Shows signals with 94% accuracy. Works on all currency pairs and all timeframes (recommended timeframes M5, M15, M30, H1). This is a ready-made trading system that trades according to the scalping strategy. The intraday indicator shows a large number of signals on the M5 and M15 timeframes.
How to trade with this indicator? When the red arrow appears, we need to look at t

Night Crawler is a moving average trend trading strategy and delivers over 89 to 90% wining ratio when applied and traded properly. It work for all Timeframe and for every currency pairs trading on the MQL4 Platform. To have a clear trend bias of the market Apply EMA 50 and EMA 21 to your chat to get the best out of this strategy for your overall Trend View.
The Best Timefarme to use is H1 or H4
ENTRY RULES :
For Buy trades :
1. Wait for EMA 21 to Cross Above 50 2. When the arrow (Bl

harmonic patterns Harmonic patterns can be used to spot new trading opportunities and pricing trends – but only if you know exactly what you are looking for. Harmonic patterns are formed by combining geometric shapes and Fibonacci levels. As a result, Fibonacci levels are the key concept of these patterns. Identifying harmonic patterns requires more practice than other market classical patterns. But by learning these patterns, you can recognize the future trend of the price chart. These patter

66% discount only for the first 5 buyers (4 left), main price: 300 $
Show the signal as a line graph Prediction of 10 future candles and advanced display Prediction of individual candles graphically Can be used in the gold symbol Can be used in 15 minutes time frame Can be used only in gold symbol and only 15 minutes time frame
How the indicator works:
Using complex mathematical calculations, it predicts the future 10 candles. The predictions of this indicator are based on price. Ther

This indicator uses a different approach from the previous version to get it's trendlines. This method is derived from Orchard Forex, and the process of making the indicator is demonstrated in there video https://www.youtube.com/watch?v=mEaiurw56wY&t=1425s .
The basic idea behind this indicator is it draws a tangent line on the highest levels and lowest levels of the bars used for calculation, while ensuring that the lines don't intersect with the bars in review (alittle confusing? I kno
FREE
Beta Fort Trader is a moving average trend trading method and gives above over 75 to 90% wining ratio when used according to the given instructions.
The Best Timeframe to use is H1 or H4
It work for all Timeframe and for every currency pairs trading on the MQL4 Platform. To have a clear trend bias of the market Apply EMA 50 and EMA 21 to your chat to get the best out of this strategy for your overall Trend View.
TRADING INSTRUCTION :
For Sell trades :
1. Look out for EMA 21 to Cross

Optimized for Asia- London- US- Open-Session the best Features from MOMENTUM-SOLO true Momentum - time-based Indicator it's based on a self-developed candle Pattern, in relation to the ATR
Filter
Daytime Weekdays Moving Averages Keltner-Channel
Advantages Optimized for Asia- London- US- Open-Session choose your personal times to trade - select Daytime and Weekdays Keltner-Channel => to reduce market noise - sideways movement will be hidden 3x Moving Averages => for the Trend Sig

Have you ever wondered which currency is the strongest at any particular time? Or which currency pair is trending the most. Well, the currency strength meter helps with just that. It compares USD , EUR , AUD , CHF , GBP , CAD and NZD depending on the timeline you have chosen in settings, and ranks them on the number of pips each has moved compared to the rest. N/B: All currency charts of the above pairs must have loaded. You can do this by highlighting all major and minor currencies
FREE

The currency strength momentum has a lot of similarities with currency strength meter presented in the previous page, but the difference are much more pronounced. You can try putting both in the same chart and see the difference in results. Currency strength momentum measures strength of a currency based on (you guess it) it's momentum relative to other currencies, while currency strength meter measures the strength of a currency based on pips it has moved in a certain direction.
FREE

Divergence and Convergence are important harbingers of reversals in stock markets.
The Divergence Sync indicator is designed to automatically search for divergences on a large number of indicators with different parameters.
The search for divergences is carried out on these indicators: (CCI, CHO, DeMarker, MACD, MFI, Momentum, OBV, OsMA, RSI, Stochastic, WPR, Awesome Oscillator ).
To search for divergences, you can use one technical indicator or search simultaneously on any number of indic
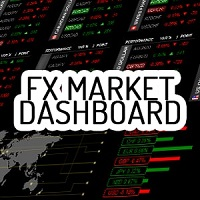
Fx Market Dashboard is a very innovative tool that features very professional graphics. Simplifying the reading of the market has always been our prerogative and we believe that with this tool everyone can better understand the market. This tool is mainly concerned with giving us a clear view of what are the strongest and weakest currencies, through this information we can begin to better understand where the market puts money or takes away money. The reading of the percentage logic serves to h

The Pearson Trend!! My name is Murat Yazici. I have B.Sc. Statistics and M.Sc. Quantitative Methods degrees. I have several scientific papers, conference presentations in Texas, Toronto, London, Istanbul, books and book chapters studies, and many projects about mathematical and statistical modelling. I am also journal reviewer at some scientific journals.
What is The Pearson Trend's Logic? It is based on A Fuzzy Model developed by me. Vague or fuzzy data and application several fields,

Infometer индикатор для вывода информации в одном из углов - сколько пунктов (пипсов) или в валюте депозита профита во всех отрытых ордеров данного торгового инструмента. В меню индикатора внесены такие данные 1. Угол вывода информации. 2. Цвет вывода информации. 3. вывод валюты депозита и пипсов. 4. Выбор вывода информации - профит и пункты - профит -пункты. На белом фоне автоматически информация выводится черным цветом на других фонах цвет вывода информации определяется в меню.
FREE
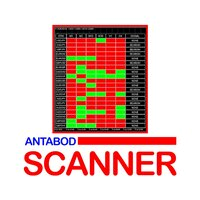
Antabod Scanner, Is a multi-timeframe scanner. It's a metatrader 4 indicator, which allows the detection of the trend of several pairs at a glance. I t will display on the platform any pair or pairs that all the timeframes, from the higher time frame to the lower timeframe, in the inputs, are all bullish or all bearish. When a pair is completely bullish, all the timeframes will be green, or when bearish all the timeframes will be red, and a sound will alert and a written alert will be displayed

Welcome to Investment Castle products This product is exclusively available in the MQL5 market and is not available and will not be available anywehere else. The Combined indicator is a multi-time frame indicator and it is built using 3 indicators: Bands indicator which draws the support and resistance key levels using up to 5 different time frames Patterns indicator which draws the chart patterns using up to 6 different time frames Spots indicator which shows the common candlestick pattern

Basic Fibonacci Calculation Indicator
shows Trend, Stoploss, Profit 1,2,3, will show you your daily Highs and your Daily Lows , it will also show you where it expects the price to move to. best time frame is H1 or higher .
For a better system that also includes my Non-repaint Indicator please check out my paid Fibo Indicator https://www.mql5.com/en/market/product/82323
FREE

As per name Candles Talk, This Indicator is a affordable trading tool because with the help of Popular Developers & Support of M Q L Platform I have programmed this strategy. I tried to input history of candles with average Calculation regarding High, Low, Last High, Last Low with Moving averages. Furthermore, I have also taken help of Moving average So Trader can easily get in touch with market in another way also. What is in for Trader?
Arrows: Buy Sell Indications (Candles Hig
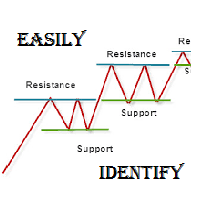
SUPPORT RESISTANCE
Function: Trader will find rejections, Movements & Easily understand to take positions Time Frames: 1 Hour, 4 Hours, Daily Types: Standard, Woodie, Fibonacci Font size & Name: Any Colours: Default black, Trader will find their own Finally this is very important to understand what is indicator. Indicator is just use for indicate not confirmation therefore, experienced traders always guide that do proper cash management & trade wisely. Good Day, Best of Luck :)

This indicator scans the Moving Average values for 2 Moving Averages on multiple pairs and multiple timeframes in realtime and displays a Buy signal when the fast MA is above the slow MA and a Sell signal when the fast MA is below the slow MA.
-All the MA parameters(Period, Method and Applied price) can be changed from the inputs window.
-You can either add your own list of pairs to scan or set the scanner to automatically use the pairs in the market watch using the Symbols Source input.
FREE

Adaptiv Ma это индикатор средняя линия значение которой выставляется в меню и применяется на тейфрейме Н4. В последствии она адаптируется к выбранному определенному таймфрейму. В меню индикатора задаются следующие параметры 1. Период индикатора 2.Метод определения Ма. 3. Стиль Ма. 4.Толщина линии Ма. 5.Цвет линии Ма.
При переключении между таймфреймами автоматически переключается значение периода Ма для адаптации к новому таймфрейму. Пишите насколько вам была полезен такой индикатор.
FREE
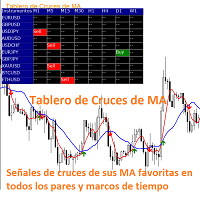
El indicador Tablero de Cruces de MA es un indicador que muestra los cruces de 2 medias móviles seleccionadas en el gráfico de precios indicando si se trata de un cruce alcista o bajista. Además, como su nombre lo indica, muestra un tablero de señales que indica en que mercado y marco de tiempo se produce un cruce de las dos medias móviles. En la ventana de configuración el usuario puede seleccionar los mercados y marcos de tiempo que puede visualizar en el tablero. También tiene la opción de ac

İndirimli fiyatı 299$! Fiyatlar gelecekte artabilir! Aşağıdaki açıklamayı okuyun!
Ultimate Sniper Dashboard için En İyi Giriş Sistemi: NIHAI DINAMIK SEVIYELER. (Lütfen Ürünlerimi Kontrol Edin)
Ultimate Sniper Dashboard, MT4 çoklu para birimi test limitleri nedeniyle SADECE canlı piyasalarda çalışır.
Ultimate-Sniper Dashboard ile tanışın! Hem HA-Sniper hem de MA-Sniper içeren en iyimiz. ve birçok özel mod. Ultimate Sniper Dashboard mutlak bir canavar! Herhangi bir Acemi veya Uzman Tüccar
149'da sadece 9 kopya kaldı! Sonraki fiyat 199!
Keskin Nişancı Kontrol Panelimiz yayında!
Alternatif HA-Sniper panosunu burada bulabilirsiniz [ https://www.mql5.com/en/market/product/85666 ]
Herhangi bir Acemi veya Uzman Tüccar için en iyi çözüm! Bir daha asla tek bir hareketi kaçırmayın!
Sadeliği ve tırtılları seven tüccarlar için sizin için özel bir ürünümüz var. Doğası basit olan gösterge tablosu, özel Hareketli Ortalama tabanlı algoritmamızla 28 döviz çiftine bakarak tüm iş
99'da sadece 3 kopya kaldı! Sonraki fiyat 249!
Herhangi bir Acemi veya Uzman Tüccar için en iyi çözüm! Bir daha asla tek bir hareketi kaçırmayın!
Sadeliği ve tırtılları seven tüccarlar için sizin için özel bir ürünümüz var. Doğada basit olan gösterge tablosu, özel HikenAshi tabanlı algoritmamızla 12 döviz çiftine bakarak tüm işi yapar. Sadece bir grafikle piyasayı bir profesyonel gibi okuyabilirsiniz. Herhangi bir FOREX çiftinin yönünü ve tam olarak ne zaman hareket etmeye başladığ

Apollo Global Trends , herhangi bir döviz çiftindeki bir piyasa trendinin hareketini ve ayrıca metaller, endeksler, hisse senetleri, kripto para birimleri ve diğer ticaret araçları dahil olmak üzere kesinlikle herhangi bir ticaret aracını tahmin etmek için oluşturulmuş bir trend göstergesidir. Bu gösterge herhangi bir zaman dilimi için kullanılabilir. Gösterge hem uzun vadeli hem de kısa vadeli ticaret için uygundur. Gösterge, ana sistem veya göstergeleriniz için bir filtre görevi görebilir. Bu
Bu gösterge, göstergenin bağlı olduğu grafiği kaydırdığınızda birden çok grafiği aynı anda kaydırır. Çoklu zaman dilimi stratejilerini, çoklu çift stratejilerini geriye dönük test etmek, aynı anda birden fazla grafiği izlemek ve birkaç piyasanın aynı anda tarihsel olarak nasıl performans gösterdiğini görmek için geriye bakmak için kullanışlıdır. Gösterge hafiftir ve aynı anda 99 grafiğe kadar hareket etmek için kullanılabilir.
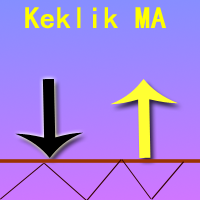
Index name: keklik ma
Use: Ma, MACD, RSI and other technical indicators.
Recommended cycle: 1 hour chart.
Long term trend: EMA 1, EMA 2, EMA 3, EMA 4 moving average arrangement. Default value of EMA: 7,14,21,63. If you want a 1-minute and 5-minute chart, it is recommended to use parameters
EMA1=30;
EMA2=60;
EMA3=144;
EMA4=250;
Short term trend: EMA 1, EMA 2, EMA 3 moving average arrangement.
Operator type: Super radical, radical and moderate. The default
Piyasa izlemede bulunan tüm döviz çiftleri için eksik verileri indirir. EA'ları ve stratejileri geriye dönük test etmek ve tüm geçmişi tek tek indirmek yerine bir kerede indirmek için çok kullanışlıdır. Gösterge, seçilen döviz çiftleri için tüm geçmiş veriler indirilene kadar çalışacaktır. Göstergenin birden fazla seçeneği vardır: 1. Tek çift için verileri indirin 2. Yalnızca mevcut çift için indirin 3. Seçilen çiftler için indirme 4. Market saatindeki tüm çiftler için indirin
FREE
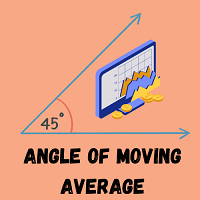
Angle of Moving Averages This indicator is very simple yet powerful concept which constantly calculate the slope of the current bar moving average with respect to the N bar before moving average value. This no only give a good entry and exit signal but also it shows traders the strength of the signal. It shows positive green histogram when market is moving toward upward direction and red histograms for downtrend. When large histograms found means market has very strong trend. Inputs Available
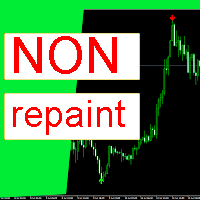
Ticaret yapmanıza yardımcı olacak bir gösterge. Bu gösterge, trend dönüşlerinin yanı sıra geri çekilmeleri de gösterecektir. Ok göründüğünde, trendin yönünü değiştireceği veya ana hareketten bir geri dönüş olacağı anlamına gelir. Her durumda, eğer tüccar bunu önceden biliyorsa, etkili bir şekilde anlaşmalar açmak mümkündür. Bu gösterge değerlerini yeniden çizmez. Ok mumun başında belirir ve orada kalır.
Bu gösterge ile nasıl işlem yapılır: Kırmızı bir ok göründüğünde, bir satış anlaşması
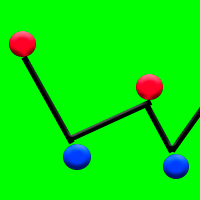
Dot scalp - shows price reversal points with 93% accuracy. Does not redraw points. Works well during sideways price movement when the market is flat. The indicator draws the points of price reversal or pullbacks on the chart.
How to use this indicator in trading? Add the Dot scalp indicator to the chart. Also download on the Internet any channel indicator that shows the channel on the chart. Wait for the sideways movement of the price, this is when the channel indicator draws a channel in t
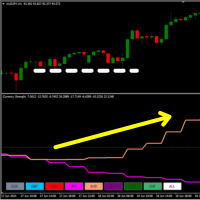
28 market in a Single Indicator! You have 8 Lines and each represents a currency { EUR - USD - GBP - JPY - AUD - NZD - CAD - CHF } .
What It Does? It calculates a custom oscillator on all 28 Forex Pairs and draws you the Strength of each currency. This way you can analyze the Trend and the Volatility on a Multicurrency Rate. Also by Clicking on two different currencies instantly changes the market.
How To Use It? You can use this indicator to find true market contractions when two currenc

This indicators automatically draws the support and resistances levels (key levels) for you once you've dropped it on a chart. It reduces the hustle of drawing and redrawing these levels every time you analyse prices on a chart. With it, all you have to do is drop it on a chart, adjust the settings to your liking and let the indicator do the rest.
But wait, it gets better; the indicator is absolutely free! For more information: https://youtu.be/rTxbPOBu3nY For more free stuff visit: https
FREE

RJT SALAMANDER, the indicator as in a video game
VERSION 2
Pilot your PRICE spaceship inside the cavern and avoid the collision against the stalactites (green) and stalagmites (red), dodging these obstacles to win.
When these objects are forming (or disappearing) then you must make the decision how to move your ship (just like in a video game)
Depending on the market and the size of the candles/bars you can adjust the calculation of stalactites and stalagmites (based on the last bars) in
FREE

Gold Trend Pro Buy & Sell Signal Indicator Pairs : XAUUSD - XAGUSD - Crude OiL, EURUSD,GBPUSD,USDJPY,AUDUSD,GBPJPY,BTCUSD TimeFrame - 1 Min , 5Min, 15Min Once All Are Green Bar , And Also Englufing The Candle You Can Enter To Buy Once All Are Red Bar, And Also Engulfing The Candle You Can Entry To Sell And Next Once Change The Bar Colour , You Can Exit The Buy & Sell Order

Trend driver bars is the manual trading system, which defines current trend continue or it's pull-back/reverse. "Driver" bars - are price action patterns that has powerfull affect on market, defining it's near future direction. Generally, driver bars represents trend "skeleton" and often anticipates new market impulse. System plots arrows when market shows 3 pattenrs in a row(most powerfull combo-pattern), and makes fast scalping of incomming movement. Loss positions closes by common profit. Lot
Calculate 28 pairs buy and sell volume real-time.
This Indicator is good for all trader. It will increase the accuracy and decision making of placing orders. It shows the strength and weakness of every currency. It's a great help to you. CurrencyStrength28pairs - The indicator calculates the price and the buy and sell volume of every currency pair. Show you the results on the board in real time. and averaged all currency pairs to show the strength of the current currency. Features
Result on t

Binary step clouds - is the complete trading system with enter and exit points. System is based on double smoothed exponential step moving and volume weighted simple step moving.Generally each movings define trend direction and places when trend is in active phase. Signals plots when both movings approache to active trend phase and market speed is high. Main Indicator's Features Signals are not repaint,non-late or disappear(exept cases when system recalculates all history datas,refreshing main
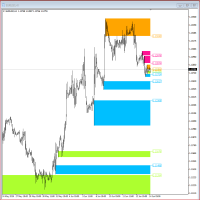
"Supply / Demand Zones"
The concepts of supply and demand zones are undoubtedly two of the most highly discussed attributes of technical analysis. Part of analysing chart of pattern , these terms are used by traders to refer to price levels i n charts that tend to act as barriers, preventing the price of an asset from getting pushed in a certain direction. At first, the explanation and idea behind identifying these levels seems easy, but as you'll find out, supply and demand zones can co
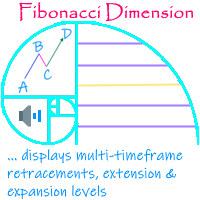
'Fibonacci Dimension' indicator allows display of preset or user-defined multi-timeframe Fibonacci levels. It automatically takes the previous high and low for two user-defined timeframes and calculates their Fibonacci retracement levels. It also considers the retraced level to draw the expansions on every change of price. A complete visual dimension in multiple timeframes allows deriving profitable strategies for execution. The functionalities included are: Provides an option to consider a pres
FREE

Wave Impulse OmegaScalper - is the manual system for scalping. In many cases Indicator "eats" almost all possible trend wave. System defines up price wave and down price wave. Inside the exact wave - system defines true trend movement and choppy market. Indicator plots signals while market is trending, powerfull and has quiet good volatility. This is complete system with enter and exit points. Main Indicator's Features Signals are not repaint,non-late or disappear(exept cases when system recalcu

Reverse side scalper is the manual trading system, that works on choppy(anti-trend) market. As a rule markets are on 80% choppy and only 20% is trend phase. System is based on custom step Moving and RSI and reverse pattern. System defines up movement, down movement, trend / choppy phases. Indicator plots Buy signal arrow when current direction is down and phase is trend, Sell signal arrow is plotted when currently is up movement and phase is trend. As a rule it allows to "catch" local maximum/mi

Imbalance / FVG MTF Mark Imbalance on chart of Selected Multi Time frames. Trend is Manually set to filter signals in the chosen direction by a button on the chart. .
Futures Auto Mark Imbalance / FVG on chart on selected time frames
Select time frames by buttons on chart
Popup Alert, Push Notification or email when New Imbalance Form
Popup Alert, Push Notification or email when Imbalance is Taken out
Select Alert Mode to be a single or multiple Imbalance ( OR / AND option ) when Imbalan

FREE TopClock Indicator: This indicator is an Analog Clock That Shows: Local Time Of Pc or Time Of Broker Server or sessions(Sydney -Tokyo London -NewYork)Time or custom Time( with GMT -Base) this can shows Candle Time Remainer with Spread live. You can run this indicator several times for different times and move it to different places on the chart. If you would like, this indicator can be customized for brokers and their IB based on customer needs. For more information contact us if you
FREE

The indicator for determining key patterns for the BBMA strategy will perfectly complement the Fibo Musang strategy, and can also be used as an independent tool. IMPORTANT! Contact me immediately after purchase to receive the second file! If you have any questions, I will help you deal with the indicator. Designed to save market analysis time; Sends push notifications to the phone when key moments of the strategy have arisen (Extrem A, Csak, cross the BB line with a candle) Advantages Easy to u
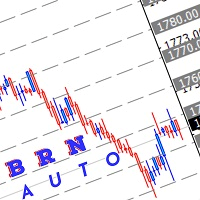
Use this indicator to draw multiple horizontal line to nearest round number Range for round number can be adjust manually depend how user want to use it Selection of colour also can be adjust manually Hope this indicator can help somebody in their trading.
How to use this: Mostly I use this indicator for break, retest and entry. example:- current price XAUUSD :1740.00 which mean the closest level are 1750.00 and 1730.00 Wait for price to break this level. then wait for retracement if price mak
FREE

This indicator takes input from the ADX from multiple time frames (M/W/D/H4/H1), and presents the output on the main chart. Great for scalping. Features alert for current chart's ADX. TrendLine period setting.
How to use: Simply attach to any chart. User can set the period for ADX(Monthly, Weekly, Daily, H4, H1,Current chart) Zoom chart out completely. Hover over the lines to see the time frame applicable. Buy when Multi ADX below price; also blue dots and white line below price. Sell when Mul
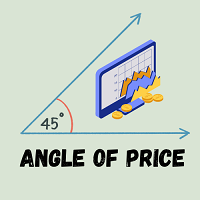
Angle of Price It is a trend following indicator. The idea behind this indicator is very simple. it calculates the angle of certain price type with its N candle back price type. When the price is moving toward upward direction positive angle histograms will be created and vice versa for downward direction. There are couple of price type supported in this indicator. Which is as follows Close Open High Low Median Typical Weighted When combined with other indicators it could be used as a very power
FREE
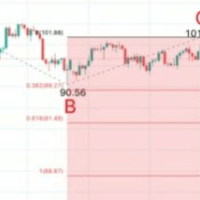
A Chart Analytics Program and helps in asset analysis using the Fibonacci Complex.
The primary Fibonacci numbers used in trading are 61.8% and 38.2%. 8% is derived from dividing any number in the Fibonacci sequence by its previous one. F n / F n-1 2% is derived by squaring 61.8 and alternatively by dividing any number in the sequence by the number two places to its right. F n /F n+2 The second tier of Fibonacci numbers used in trading is 23.6%, 76.4%, and 78.6%. 6% is derived from dividing a
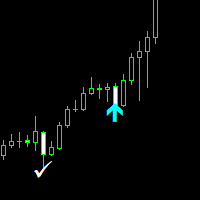
Nasdaq Savages Non-repaint indicator works on all timeframes 1 minute to 15 minutes timeframe for scalpers. 30 Minutes to Monthly timeframe for swing traders The Nasdaq Savages indicator comes with a top right info tab which tells you about the current buy or sell signal, Profit in pips, Stop loss and Target Red arrow is your sell entry signal the white right tick is your exit signal and take profit hit signal Light blue arrow is your buy entry signal the white right tick is your exit signal an

Indicator automatically draw bullish and bearish engulfing without any rules. Bearish and Bullish engulf is well known area for supply and demand area marking. This indicator can be used in any strategy that required supply demand zone. Show Last Engulf : Enable this option to show unfresh engulfing Candle to calculate : set 0 will load all history bar and can use up more memory Bearish Engulfing Colour : Pick any colour that suit Bearish Engulfing Colour : Pick any colour that suit
-Use thi
FREE

Trend Arrow Super
The indicator not repaint or change its data.
A professional, yet very easy to use Forex system. The indicator gives accurate BUY\SELL signals. Trend Arrow Super is very easy to use, you just need to attach it to the chart and follow simple trading recommendations.
Buy signal: Arrow + Histogram in green color, enter immediately on the market to buy. Sell signal: Arrow + Histogram of red color, enter immediately on the market to sell.
Please email me after your purchase!
Market Reversal Catcher Dashboard indicator looks for market reversal points or major pullback. To do this, it analyzes previous price movements and using a flexible algorithm for estimating the probability of a reversal, also gives recommendations on entry points and sets recommended profit targets for positions opened on a signal. The dashboard is designed to sit on a chart on it's own and work in the background to send you alerts on your chosen pairs and timeframes. Dashboard does not requi
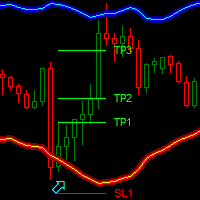
Dark Bands is an Indicator for intraday trading. This Indicator is based on Counter Trend strategy but use also Volatility. We can enter in good price with this Indicator, in order to follow the inversions on the current instrument.
Key benefits
Easily visible take profit/stop loss lines Reliable bands lines with futuristic colors, and Intuitive directional arrows Useful statistics , which indicate the win rate of the signals Plus Package available, leave a feedback to recei
FREE
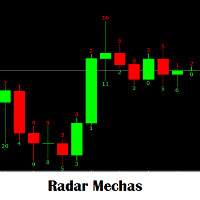
Manüel girişler yapmak için uyarı oluşturan mumların boyutuna göre fitilin boyutuna bakmaya yarayan gösterge. Bir stratejinin, önceki mumun veya aynı mevcut mumun fitilinin büyüklüğünde boşluklar oluşturmasından maksimum düzeyde yararlanın. almak ve satmak için girmek. Yeni bir giriş için alınan herhangi bir analiz için gerekli olan bir göstergedir. Favori aracınız olacak.
FREE

UR Ön UçArka Uç
UR FrontEndBackEnd, en doğru destek ve direnç seviyelerini bulmak için en sevdiğim formüldür. Ayrıca ne kadar güçlü olduklarını işaretlemek için bunları farklı kategorilere (kesikli çizgiler, düz çizgiler ve alanlar) ayırdım. Tümü arabelleklerde saklanır, böylece diğer araçlara kolayca erişilebilir ve uygulanabilir.
Ek: Aracın uygulandığı varlığa göre ayarlanması gerekebilir - varlığın aracı etkileyen fiyattaki basamak sayısı farklılık gösterir. Bunun için gerekli parametr

Sonar Mekanik göstergesi. SonarHistogram güç dengesi göstergesini ücretsiz almak için satın aldıktan sonra benimle iletişime geçin! Sonar Mechanic göstergesi gerçekten çalışan bir göstergedir, çünkü piyasaya giriş için trend ve karşı trend sinyallerini doğru bir şekilde tanımlayan üç yazar algoritması kullanarak çalışır. Gösterge tüm varlıklar ve zaman dilimleri üzerinde çalışır. Gösterge Kılavuzu: https://www.mql5.com/en/blogs/post/750128 Altın ve döviz çiftlerinde, M1, M5 ve M15 zam
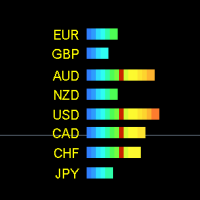
"Forex strength meter full" is a new improved version of the popular indicator. In this version, we have changed the input filters and made the indicator signals faster and more accurate. Now this indicator can be used in trading even more effectively than its basic free version. The new version of the indicator is built on self-learning algorithms and is able to self-analyze its signals in order to exclude false information data flows.
Why should you use this indicator? It shows the directio

About Scanner:
It will show you the Higher/Lower Highs and Lows of zigzag price. Use it to keep track of best ongoing trends and price ranges. Detailed blog post with free 2 weeks demo (till Sep-2,2022): https://www.mql5.com/en/blogs/post/750232
Symbols:
HH: Higher Highs HL: Higher Lows When price makes higher and higher Highs or higher Lows:
It will count Zigzag in reverse and find total number of last "Higher Highs" and "Higher Lows" or "Lower Lows" and "Lower Highs". LL: Lower Lows
MetaTrader Mağaza - yatırımcılar için ticaret robotları ve teknik göstergeler doğrudan işlem terminalinde mevcuttur.
MQL5.community ödeme sistemi, MetaTrader hizmetlerindeki işlemler için MQL5.com sitesinin tüm kayıtlı kullanıcıları tarafından kullanılabilir. WebMoney, PayPal veya banka kartı kullanarak para yatırabilir ve çekebilirsiniz.
Ticaret fırsatlarını kaçırıyorsunuz:
- Ücretsiz ticaret uygulamaları
- İşlem kopyalama için 8.000'den fazla sinyal
- Finansal piyasaları keşfetmek için ekonomik haberler
Kayıt
Giriş yap
Gizlilik ve Veri Koruma Politikasını ve MQL5.com Kullanım Şartlarını kabul edersiniz
Hesabınız yoksa, lütfen kaydolun
MQL5.com web sitesine giriş yapmak için çerezlerin kullanımına izin vermelisiniz.
Lütfen tarayıcınızda gerekli ayarı etkinleştirin, aksi takdirde giriş yapamazsınız.