YouTube'dan Mağaza ile ilgili eğitici videoları izleyin
Bir alım-satım robotu veya gösterge nasıl satın alınır?
Uzman Danışmanınızı
sanal sunucuda çalıştırın
sanal sunucuda çalıştırın
Satın almadan önce göstergeyi/alım-satım robotunu test edin
Mağazada kazanç sağlamak ister misiniz?
Satış için bir ürün nasıl sunulur?
MetaTrader 4 için yeni teknik göstergeler - 44

The indicator changes the current chart timeframe depending on the drawdown in the deposit currency, the number of orders or the percentage of the deposit. You can set the drawdown in the deposit currency, the number of orders in one direction or the percentage of the deposit, at which the current timeframe will change to the selected one. This significantly reduces the drawdown during the work of Expert Advisors using order networks.
Indicator parameters: Drawdown in currency, orders or percen
An Ultimate Tool for quick and efficient market analysis. Unique combination of solid indicators defining market direction for trend tracking and filtration designed for you to stay on the right side of the market.
Market Rider Tools gives you access to one of the most used from professional trades indicators on worldwide, which were not build in for MT4 and MT5 terminals . These are unique non-repainting indicators designed to be used on all time frames for all instruments classes: Forex

An Ultimate Tool for quick and efficient market analysis. Unique combination of solid indicators defining market direction for trend tracking and filtration designed for you to stay on the right side of the market.
Market Rider Oscillators gives you access to one of the most used from professional trades indicators on worldwide, which were not build in for MT4 and MT5 terminals . These are unique non-repainting oscillators designed to be used on all time frames for all instruments classe

This Nice Trade Point indicator is designed for signal trading. This indicator generates trend signals.
It uses many algorithms and indicators to generate this signal. It tries to generate a signal from the points with the highest trend potential.
This indicator is a complete trading product. This indicator does not need any additional indicators.
The indicator certainly does not repaint. The point at which the signal is given does not change.
Features and Suggestions Time Frame

Identify Engulfing candle pattern with Arrows & Alert ( built-in RSI filter). This indicator helps you to identify Engulfing candle pattern or Outside bar (OB) on the chart with arrows, along with an alert when a new Engulfing candle appears. Engulfing candle pattern is one of the most important reversal Price Action signals. You can choose between standard Engulfing (Engulfing based on candle body) or non standard Engulfing (Engulfing based on candle high - low )
Alerts can be turned on an
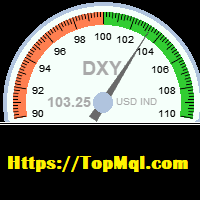
This indicator is used to calculate the dollar index according to the formula of currency pairs(EURUSD ,GBPUSD,USDJPY,USDSEK,USDCHF,USDCAD)Even if the broker does not have the dollar symbol. this Indicator displays the dollar index chart in a separate window at the bottom of the chart. It also displays the current dollar index graphically. In this indicator, it is possible to set the minimum and maximum value of the indicator as well as its size scale on the chart as an input parameter, and it
FREE
This is a basic indicator which is very useful for professional traders. The idea is to track every X pip movement in any symbol. It is a multicurrency indicator. So it will track the pip movements in all specified symbols. When there is absolute pip value price will appear (e.g 1.178500, 1.178600, 1.178700 ) it will signal the user in alert, mobile app and notification This pip step is configurable. This will help identify sudden movement in market as there will be lots of signals at that time
FREE
"Visual Range - Spread Indicator". This Indicator is an Essential Tool for Manual trading. it helps to avoid "off price" and "bad" entries caused by abnormally High spreads. ...................................................................................................................... At the Market Opening and News Reports - the Size of the Spread can go temporarily widely High. The Indicator shows the current Size of the Spread visually on the chart and its distance from the current pr
FREE

This indicator labels swing highs and swing lows as well as the candle pattern that occurred at that precise point. The indicator can detect the following 6 candle patterns: hammer , inverse hammer , bullish engulfing , hanging man , shooting star and bearish engulfing .
The notations HH, HL, LH, and LL you can see on the labels are defined as follows:
HH : Higher high
HL : Higher low
LH : Lower high
LL : Lower low
Setting
Length: Sensitivity of the swing high/low detection,
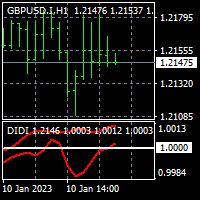
To get access to MT5 version please click here . - This is the exact conversion from TradingView: "Didi Index" by " everget ". - This is a popular version of DIDI index on tradingview. - This is a light-load processing and non-repaint indicator. - Buffer is available for the lines on chart and arrows on chart. - You can message in private chat for further changes you need. Thanks for downloading
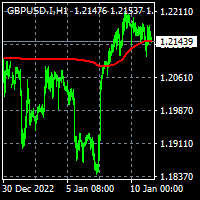
To get access to MT5 version please click here . - This is the exact conversion from TradingView: "Trend Regularity Adaptive Moving Average","TRAMA" By " LuxAlgo ". - This is a light-load processing and non-repaint indicator. - Buffer is available for the main line on chart. - You can message in private chat for further changes you need. Thanks for downloading

Lets dabble a bit into Elliot Waves.
This is a simple indicator which tries to identify Wave 1 and 2 of Elliot Impulese Wave and then projects for Wave 3.
Ratios are taken from below link: https://elliottwave-forecast.com/elliott-wave-theory/ - Section 3.1 Impulse
Wave 2 is 50%, 61.8%, 76.4%, or 85.4% of wave 1 - used for identifying the pattern. Wave 3 is 161.8%, 200%, 261.8%, or 323.6% of wave 1-2 - used for setting the targets
Important input parameters MaximumNumBars : To calculate back
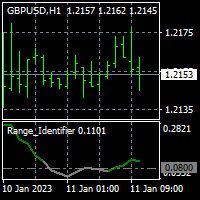
To get access to MT5 version please click here . - This is the exact conversion from TradingView: "Range Identifier" By "Mango2Juice". - All twelve averaging options are available: EMA, DEMA, TEMA, WMA, VWMA, SMA, SMMA, RMA, HMA, LSMA, Kijun, McGinley - This is a light-load processing and non-repaint indicator. - Buffer is available for the main line on chart and not for thresholds. - You can message in private chat for further changes you need.

Identify Pinbar Candle Pattern with Arrows & Alert (built-in RSI filter).
This indicator helps you to identify Pin bar Candlestick Pattern (or shooting star & hammer pattern) on the chart with arrows, along with an alert when a new Pin bar appears. Pin bar pattern is one of the most important reversal Price Action signals.
You can set Minimum Percent of Wick (or Tail) Length over full bar length (Recommended: 60%, 70%, 75%).
Alerts can be turned on and off: Popup Email Push Notification Soun

Fibonacci por color en niveles para aplicar estrategia profesional inicialmente se coloca en el punto mas alto del dia y mas bajo con esto es para ubicar operaciones a una distancia exacta con lo cual se busca generar ganancias residuales internas en el mismo dia con esto las lineas fusias es para colocar las entrdas sell y las lineas verdes amarillas van los buy

This Trusty Strong Arrow indicator is designed for signal trading. This indicator generates trend signals.
It uses many algorithms and indicators to generate this signal. It tries to generate a signal from the points with the highest trend potential.
This indicator is a complete trading product. This indicator does not need any additional indicators.
The indicator certainly does not repaint. The point at which the signal is given does not change.
Features and Suggestions Time Fr
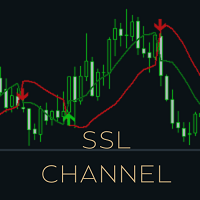
Known as the SSL , the Semaphore Signal Level channel chart alert is an indicator that combines moving averages to provide you with a clear visual signal of price movement dynamics . In short, it's designed to show you when a price trend is forming. This indicator is nothing but two 10-period simple moving averages with one applied to the high of the price and the other applied to the low of the price, therefore forming an envelope that follows the market price. The idea is to trade based on t
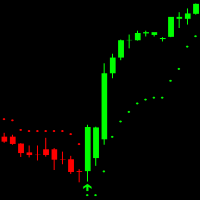
Easy Trend Indicator can be used for all forex pairs, indices and cryptocurrencies. It´s a non rapainting Trend trading indicator and works on all timeframes. GREEN candles show an uptrend and RED candles show a Downtrend. Arrows show when to enter the Market. Indicator has 7 Inputs: Max History Bars = On how many Bars in the Chart the indicator is drawn ATR Period = How many Bars are used for Average True Range calculation ATR Multiplier = Is used for Indicator sensitivity (Higher multiplier =

** All Symbols x All Timeframes scan just by pressing scanner button ** *** Contact me to send you instruction and add you in "Trend Reversal group" for sharing or seeing experiences with other users. Introduction: Trendlines are the most famous technical analysis in trading . Trend lines continually form on the charts of markets across all the different timeframes providing huge opportunities for traders to jump in and profit on the action. In the other hand, The trend line reversal s
Universal Swing Arrows , hızlı ticaret sinyalleri sağlamak için tasarlanmış ok tabanlı bir göstergedir. Herhangi bir ticaret çifti ve herhangi bir ticaret zaman dilimi için kullanılabilir. MEVCUT (0) MUM ÜZERİNDE OKLAR GÖRÜNÜYOR. SİNYALLER YENİDEN BOYAMAYIN! Gösterge, bağımsız bir ticaret sistemi olarak veya kişisel ticaret stratejinizin bir parçası olarak kullanılabilir. Göstergenin oku sadece bir sinyal değil, aynı zamanda olası stop-loss seviyenizi de gösterir. Gösterge sizin için en iyi zara

Metatrader 4 için tasarladığım bu özel gösterge, herhangi bir metatrader 4 sunucusundan Doğu Standart Saatini (New York Yerel Saati) kolayca tanımlayabilmek için tasarladım. Ancak, açılır menüden saat dilimini değiştirerek yerel saatinizi belirlemek için bunu kullanabilirsiniz. Seçtiğiniz zaman dilimindeki herhangi bir belirli zamana herhangi bir renkte dikey bir çizgi eklemenizi sağlar. Seçtiğiniz saat dilimine veya gerçek sunucu saatinize göre Yatay otomatik hesaplama Açık, Yüksek, Düşük ve Ka
FREE
MTF Optimal Trailing TP göstergesi tam olarak optimal takip karı gibi çalışır, ancak sinyalleri oklar yerine çubuklar olarak yazdırır ve aynı anda iki farklı zaman dilimi için yazdırır.
Hem giriş aracı olarak hizmet edebilir hem de kar elde edebilir. Hem giriş hem de kar alma aracı olarak kullanıyoruz.
Bunu kullanmanın en iyi yolu aşağıdaki gibidir:
Ultimate Sniper Dashboard'u kullanarak daha yüksek bir zaman dilimi hareketi bulun
Daha düşük bir zaman dilimine gidin ve aracı sadece daha yüksek
FREE
Optimal Trailing TP göstergesi hem bir giriş aracı hem de bir kar izleme aracı olarak çalışabilir. Benzersiz tasarımı, alım ve satım sinyalleri vermesini sağlar. Zaten bir pozisyondaysanız, sinyal oklarını görmezden gelebilirsiniz. Bir pozisyonda değilseniz, oklar sizi göstergenin ayarlandığı zaman diliminde veya döviz çiftinde bu yönde bir hareket konusunda uyarabilir. Böylece, sinyal oklarını karşı oka girmek ve çıkmak için kullanabilir veya mevcut işlemlerden çıkmak için karşı sinyalleri kull
FREE
Optimal Stoploss BulucuSabit stoploss gibi normal popüler stoploss tekniklerini kullanmak veya bunları önceki en yüksek ve en düşük seviyelerin altına yerleştirmek birkaç nedenden dolayı dezavantajlıdır:1. Brokerlar bu alanları zaten biliyorlar, bu yüzden almaları kolay 2. Bir piyasada her zaman sabit bir stoploss kullanamazsınız, çünkü farklı zamanlarda gerçekten geniş veya gerçekten zayıf olabilir ve ya piyasadan daha az alırsınız ya da hızlı bir şekilde durdurulmak için kendinizi aşırı maruz
FREE
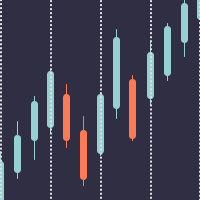
Better Period Separators For MetaTrader 4 The built-in period separators feature doesn’t allow users to specify the time period, so you can use this indicator to create more customizable period separators. On intraday charts, you could place period separators at a specific time, you could also place extra period separators at a specific time on Monday to mark the start of a week. On higher timeframe charts, this indicator works the same as the built-in period separators, On the daily chart, peri
FREE

Tame the trend just got easier! The PDS indicator will signal the use of price sentiment. Just one setting!
Study the offer of the indicator and get the opportunity for profitable trading based on a proven and tested strategy. The mathematical algorithm proves its performance even to skeptics under any market conditions. It goes well with any trading strategy. Never recalculates signals. Signals appear at the opening of the bar. Works with any financial instruments, including forex, cryptocurr

Introduction The ST Cross indicator is based on the traditional Moving Average (MA) Cross which uses a fast and slow moving average. Entry signals to buy and sell are given when both moving averages cross. However with the basic strategy there are a lot of false signals. In order to filter the trades we use the 200 (MA) to identify the overall direction of the trend. Input Settings Master Trend Period - 200 Period moving average used to get the trend direction. Fast
FREE

Median Renko Terminator works best with renko charts if you do not have a renko chart generator I will email it to you for free and give you the correct settings for scalping or to swing trade NON-REPAINT COMES WITH ALERTS WHEN THERE IS A SIGNAL Conditions to sell: big purple arrow shows you the direction first then you take the small purple arrow to enter the same direction of the purple arrow. Conditions to buy: big white arrow shows you the up direction first then you take small white arrow
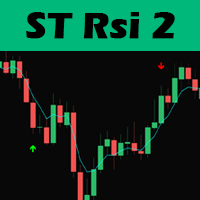
Hello traders, this trading strategy is based on the the Larry Connors RSI-2 strategy, We begin with a 200 periods EMA to find the direction of the market. This is important because we only trade in the main trend direction.
We then look for pull backs using the RSI with a period of 2 to get entry signals. Trades are then exited using the 5 EMA.
Lot size should be calculated using 1% of 1 the ATR value and positions can be added as long as the entry criterion is met.
TRADING IS RISKY AND I D
FREE
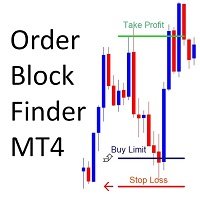
!! FLASH SALE !! Over 80% off !! For ONE week only. Now only $47 - normally $297! >>> Ends on 30 June 2023 - Don't miss it!
Sends Alerts – On MT4 To Your Phone To Your Email
Does not repaint .
Works on any Forex pair, any timeframe.
10 Activations allowed so you are free from limitations >> MT5 Version Here
For spreads from a tiny 0.1 pips RAW/ECN Accounts, click here . Check out my Waka Esque EA signal here: >> High Risk Settings or Medium Risk Settings .
What Is An Order Blo
Merhaba; İndikatör her pariteye ve her periyota uygun olacak şekilde kodlanmıştır.İndikatörün kullanım amacı doğru sinyal seviyelerini yakalamaktır.Ürün tüm bildirim ve alarm seçenekleri ile donatılmıştır.Bu sayede ekran başınızda olmasanız dahi sinyalleri alabileceksiniz.Ürün strateji olarak trend yönündeki sinyalleri bulmaya çalışır.Bu sayede daha güvenilir giriş sinyallerine sahip olursunuz.Varsayılan ayarlar için önerilen periyotlar M15,M30,H1 olmalıdır.

rsi sniper It has the strategy of an rsi line where the same indicator marks you buy and sell , When the line turns red, it marks a sale, it comes with alerts! + a red arrow that also confirms the sale, the same for the purchase, when the line becomes true mark sale, plus the alert accompanied by the phlegm that marks on the candle! works for all seasons ideal for scalping and day trading, suitable for forex and synthetic indices, all pairs are tradeable ! enjoy the sniper!

Bank Executive Indicator Uses A Simple method of tracking price as it moves across the chart and signals when a potential long or short position is active and indicates this to the trader giving you the opportunity to take a position on the market. Or you can simply use this indicator to give yourself signals and determine if you want to take the trade or learn the strategy on your own.

Bank Expert Indicator Uses A Simple method of tracking price as it moves across the chart and signals when a potential long or short position is active and indicates this to the trader giving you the opportunity to take a position on the market. Or you can simply use this indicator to give yourself signals and determine if you want to take the trade or learn the strategy on your own. The Signals From this indicator are targeted at long-term positions and focus on top quality call outs.

The Hull Moving Average (HMA), developed by Alan Hull from 2005, one of the most fast-moving Average, reduce lag and easy to use to identify Trend for both Short & Long term. This Indicator is built based on exact formula of Hull Moving Average with 3 phases of calculation: Calculate Weighted Moving Average (WMA_01) with period n/2 & (WMA_02) with period n Calculate RAW-HMA: RAW-HMA = 2 * WMA_01(n/2) - WMA_02(n)
Weighted Moving Average with period sqrt(n) of RAW HMA HMA = WMA (RAW-HMA, sqrt(n)
FREE

Defining Range ( DR ) and Implied Defining Range ( IDR ) indicator Pro with added features from free version
Show DR and IDR ranges Sessions on the chart for RDR Regular defining range (New York Session)
ADR After defining range (Asian session) ODR Outside defining range (London Session)
Buttons on chart to enable / disable :
Show Imbalance ( IMB ) Show Volume Imbalance ( VIB ) Show Gap's between open and close
Show Standard Deviation ( SD )
Show last 3 Sessions or Back

Super Channels indicator is a channel indicator created by calculating support and resistance levels. It calculates by taking the average of support and resistance levels. After determining the number of candles, it takes the levels of the number of candles and creates an autonomous channel according to these levels. If you want to calculate how many candles, you must enter the number in the parameter section. Also, there are two types of modes in the indicator. The first is to calculate based o
FREE
Exponential moving average (EMA) and super trend are popular and good indicators that is often and used to determine the trend direction. One of the best trading strategies with trailing stop is trading strategy with using a combination of Exponential Moving Average (EMA) and Super Trend indicators. EMA SuperTrend Strategy Indicator is the indicator consist of EMA, Super Trend and Alert function also other calculations are needed. It's also has extra indicator there are Automated Fibonacci Retr

Innovative Max Min swing This is a really different indicator for drawing Max and Min on the charts. This indicator draws Min and Max levels in a innovative way, based on a volatility proprietary calculation. In this way you will be able to draw trendlines in an objective way and also to see the break of Max and Min levels. You have three paramaters you can play with, in order to suite the volatility to your trading style. The indicator works on every time frame. Added: - Sound Notification
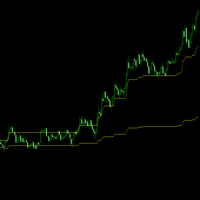
Is the market ranging (balance) or trending (Imbalance) ? This indicator exports a huge concept used in volume analysis (value area) into the price action. It makes it on Intraday level. How to read it? Simple! But you need to make practice. Making profit in market is more than a 2-rule system.
When the price inside the lines, the market is in "range mode".
If the price is above the upper line, the market is trending up.
If the price is below the lower line the market is trending down. Yo

Clear trend filter This is a filter-trend indicator. From the settings you can select to use more filter or less. The very interesting part of the indicator comes out using with all the filter. In this way you can follow the trend easily even when the market is without a strong trend, but is instead more flat. I personally use it on 1 minutue timeframe with MORE FILTER (you can select it from the input setting) in order to have an overlook of trend in the market. Added: - Sound Notificatio
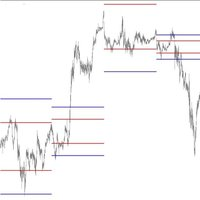
Equilibrium Levels support resistence Intraday indicator --> it means it works on lower TimeFrames , from 1minute to 4hours. This indicator is able to calculate and draw 2 levels (1 support and 1 resistence) representing the Barycenter's levels for a specific day session. From the setting you can choose only one parameter, that's the lenght of Barycenter's orbit. I personally attach the same indicator 2 times on the same chart, inputting as orbit: 0.15 and 0.30. Then what you will no
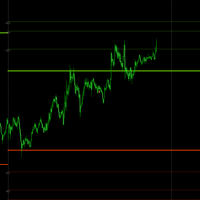
This indicator draws the projections of Fibonacci above the yesterday high and below the yesterday low. Why?
1) First of all, in this you can take the pulse of the market (trend or range). For instance If the price runs above yesterday's high the trend is UP.
2) In this way you will have automatic targets for the trend
3) you can wait the market on excess levels for contrarian and low risk trades.
If you buy the product feel free to contact me for additional tips or info.
I wish you all t
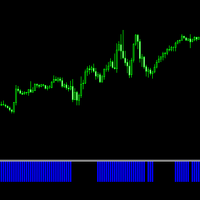
This is a clear and simple filter I've created based on a Ichimoku strategy and setup. I personally like to use the indicator in a multi timeframe approach. It can be used in a double way:
1) Every time the indicator change the colour, you can use the this first change as your trigger point.
2) You can follow the indicator for the trend direction and trade with your other signals.
Added: - Sound Notification - PopUp Notification - Mobile Push Notification (To make it work follow the in
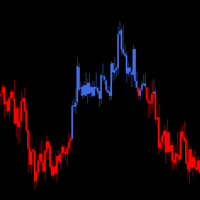
Never aginst the trend This is a really top indicator indicating the main trend in a clear and easy way. I reccomend you to use it on multiple timeframe in order to create a powerful view and strategy. It works on every market in the same way. If you trade against the trend you will work more for less, so stick with the trend. I hope you will find it useful. All the best with your trading! Keep it simple stupid, is the way! Added: - Sound Notification - PopUp Notification - Mobile Push Noti
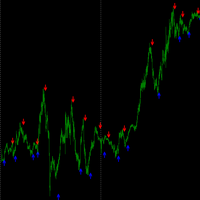
This indicator gives you nice trigger entry....whatever it is your trading style. You can use on different timeframes and also you can select from the setting the sensibility of the indicator itself, changing the input parameter "cycle period". For faster trigger signals you need to use shorter "cycle periods". You can use it in reversal strategy as well as in trending strategy. Added: - Sound Notification - PopUp Notification - Mobile Push Notification (To make it work follow the inst
Semi automatic system John Bollinger bands Entry Bollinger Excess with Filter.With this indicator you can build your own semi-automatic strategy based on bollinger bands excess. You can play with the settings to find the best solution for your style and trading attitude. The indicator shows a signal whenever it finds a trigger-entry(coded inside) based on bollinger bands excess and an additional trend-filter(moving average). This tool will support your manual trading in order to easily spot
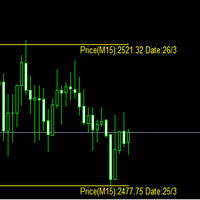
This indicator can spot strong volume levels on different timeframes. Everything is customised from the setting. You can hide by the colour the leveles you don't need. In this way you will map the market with reaction zone and you can use them as target levels or entry levels depending on your strategy. Hope you will find it useful and all the best with your trading. Added: - Sound Notification - PopUp Notification - Mobile Push Notification (To make it work follow the instructions: htt

'Zig Zag Percentage strenght' This indicator is awesome. Why? It's able to show the percentage of the last leg, compared with the previous leg. In this way you have a better understanding of the forces in play in that moment. In fact, for example, if you see that the up extensions are, in percentage, greater of the down legs, that means that there is more bullish pressure or maybe the market is starting to reverse from downtrend to uptrend. Hope you will ind it useful !
Based on Trend Following Strategy, QCAFE SUITE was built to get more accurate signal for Traders to decide whether to enter trades, included in the SUITE is QCAFE+ filter to eliminate false signals. The Signals are generated based on formula of Hull Moving Average ( HMA ) to minimize the lag of a traditional moving average - developed by Alan Hull in 2005 Setting: Limited Bars of back test Fast Period Low Period Fast/Low period to generate Buy/Sell signal
Based MA Period B ased Moving Average

We’ll start off by just testing the default DMI crossover strategy. We’ll buy when the 14-period DMI-plus crosses above the 14-period DMI-minus, and sell once the former crosses below the latter. Here are the results: As you see, the strategy seems to work well in bull markets. Still, this isn’t something we’d like to trade in its raw form! So how could we go about improving the strategy? We’ll one common approach is to demand that ADX is above 25. However, in our tests, we’ve found out that a l
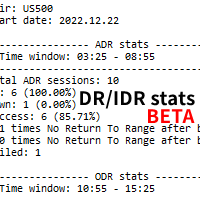
Based on the free DR/IDR indicator but with basic stats. Has the feature to export the daily data to a HTML file. So you can check the daily DRs yourself. Be mindful that the stats can vary from different broker feeds. So make sure your MT4 has enough data.
Scroll back in your MT4 and check for any gaps in the feed. Sometimes you will have to scroll back to update the stats. Feel free to contact me for questions related to the purchase, installation and use of the Indicator.

The Accelerator MT4 forex indicator was designed by Bill Williams’ and warns you of early trend changes for any currency pair. The indicator is also known as the Accelerator/Deceleration forex indicator. It basically looks for changes in momentum, either accelerating or decelerating. As you can see from the EUR/USD H1 chart shown below, the indicator draws green and red bars above and below the 0.00 level. Green and red bars above the 0.00 level suggest bullish momentum in price (price goes up).
Parabolic SAR Parabolic SAR Technical Indicator was developed for analyzing the trending markets. The indicator is constructed on the price chart. This indicator is similar to the Moving Average Technical Indicator with the only difference that Parabolic SAR moves with higher acceleration and may change its position in terms of the price. The indicator is below the prices on the bull market (Up Trend), when it’s bearish (Down Trend), it is above the prices. If the price crosses Parabolic SAR

Everyday trading represents a battle of buyers ("Bulls") pushing prices up and sellers ("Bears") pushing prices down. Depending on what party scores off, the day will end with a price that is higher or lower than that of the previous day. Intermediate results, first of all the highest and lowest price, allow to judge about how the battle was developing during the day. It is very important to be able to estimate the Bears Power balance since changes in this balance initially signalize about possi

Everyday trading represents a battle of buyers ("Bulls") pushing prices up and sellers ("Bears") pushing prices down. Depending on what party scores off, the day will end with a price that is higher or lower than that of the previous day. Intermediate results, first of all the highest and lowest price, allow to judge about how the battle was developing during the day. It is very important to be able to estimate the Bears Power balance since changes in this balance initially signalize about possi

Everyday trading represents a battle of buyers ("Bulls") pushing prices up and sellers ("Bears") pushing prices down. Depending on what party scores off, the day will end with a price that is higher or lower than that of the previous day. Intermediate results, first of all the highest and lowest price, allow to judge about how the battle was developing during the day. It is very important to be able to estimate the Bears Power balance since changes in this balance initially signalize about possi

Gösterge, grafikte sunucunun geçerli saatini ve geçerli çubuğun kapanmasına kadar geçen süreyi gösterir. Bilgi, tüccarların ticaret seansının başlaması için mumun kapanmasını bekledikleri haberlerin yayınlandığı anlarda çok yararlıdır. Yazı tipinin boyutunu ve rengini grafik şablonunuza göre ayarlayabilirsiniz.
Ayarlar: Text color - Ekran metninin rengi Text size - Ekran metninin boyutu Yeni robotların güncellemelerini ve çıkışlarını kaçırmamak için beni arkadaşlarınıza ekleyin -> Dmitrii Ko
FREE

Real Trade, 1 saatin altındaki zaman dilimlerinde işlem yapar. Yükseliş trendleri ve düşüş trendi yönlerinde ticaret yapın. Daha yüksek zaman trendi yönleriyle ticaret yapın ve ilk şamdanın ticaretini yapın. Çıkmak için tersini kullanın veya çıkmak için oranı kullanın 1:1 veya daha yüksek, takip eden duraklarla birlikte. En iyi sonuçlar için aktif saatlerde ve daha yüksek trend yönüyle Gerçek Trendlerle ticaret yapın. Sonuçları ve potansiyeli incelemek için test cihazındaki yük göstergesi. Tren
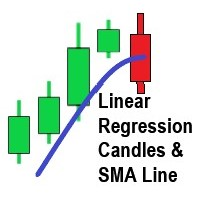
This indicator for MT4 is based on the currently popular indicator on Trading View of the similar name. The beauty of the indicator like Heiken Ashi is it removes a lot of market noise. 4 (OHLC) arrays are filled with Linear Regression(LR) values of each price for the LR period. The period of the Linear Regression is an input which must be higher than 2 (it's defaulted to 2 if you try an enter 1). The period of the Linear Regression is adjustable dependant on the market conditions. The SMA also

Free Market structure zig zag to assist in price action trading the screenshots describe how to use and how to spot patterns new version comes with alerts, email alert and push notification alert can be used on all pairs can be used on all timeframes you can add additional confirmation indicators the indicator shows you your higher high and low highs as well as your lower lows and lower highs the indication makes price action analysis easier to spot.
FREE

VaviStar is an indicator based on trend retracements determined by ZigZag segments. It is theorized, and statistics confirm, that stocks react to certain retracement levels. Many use Fibonacci retracement levels (23.6%, 38.2%, 61.8%). It is assumed that once the price goes beyond the 61.8% retracement, we can already speak of a trend reversal. This indicator allows you to comfortably chart a segment of the ZigZag with the relative operating levels chosen. With a reversal mindset , you can use it

"Pattern 123" is an indicator-a trading system built on a popular pattern, pattern 123.
This is the moment when we expect a reversal on the older trend and enter the continuation of the small trend, its 3rd impulse.
The indicator displays signals and markings on an open chart. You can enable/disable graphical constructions in the settings.
The indicator has a built-in notification system (email, mobile terminal, standard terminal alert).
"Pattern 123" has a table that displays signals from sele

Double top and bottom indicator is a pattern scanning indicator which scans the tops and bottoms using zig zag pattern. When it find price bouncing back from the same point twice after a long trend then it generate arrow signals whenever the last resistance points is broken for double bottom and last support price broken for double top. Unlike other top bottom scanner it does not give only 1 signal. it alerts user when ever the last support /resistance is broker from double top/bottom pattern un
FREE

Fibo Quartz. It has a special fibonnaci where the indicator is placed and it adapts only to any temporality, works great for forex, all pairs. for crypto also if any broker offers. special for scalping and intraday With the indicator alone and the candles you can get high percentages of profit. That's why the Quartz fibo is made. World Investor. MT4!!!!!!!!!

Buy Sell Professional. It consists of an automated buying and selling strategy according to the arrow that appears on the graph and the alarm that goes off every time you mark a sale or purchase. Special for scalping and intraday. It works for all forex pairs, and if the broker has crypto too! The indicator also has a moving average, trix and mom to capture each movement of the market!
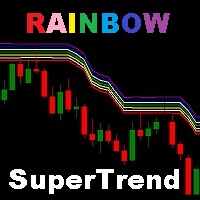
Super Trend is one of the most popular custom indicators that it doesn't provided in metatrader 4 (MT4) platform. Rainbow SuperTrend has some advantages, there are can display the trend direction and stop loss line based on Average True Range (ATR). This indicator is good to used for trailing stop trading style, because when the price direction is trending the stop loss point can adjust based on supertrend line. It is the high recommended to using this indicator combined with oscillator indicat
FREE
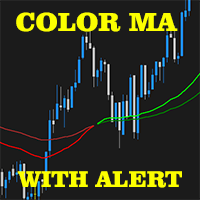
2 EMA Color Alerts Indicator is a powerful tool for any trader looking to stay on top of market movements. By using exponential moving averages (EMAs), this indicator can provide early warning signals for potential market reversals and trend changes. One of the key features of the 2 EMA Color Alerts Indicator is its customizable alerts. With this feature, traders can set their own parameters for receiving alerts, such as the EMA periods and the type of alert (e.g. sound, pop-up, email). This al
FREE

Dear Trader It is my pleasure to introduce to you my tool called the " Forex Sniper Indicator" . The major aim of this tool is to help serious traders and investors in all type of Financial Markets to catch price next movement right at the moment the price direction is about to change. This tool can be used to snipe the price direction in both down trend, uptrend and ranging markets. This tool can be used as the stand alone tool though it may be combined with other tools as well. My goal is to h

To get access to MT5 version please click here . - This is a conversion from TradingView: "Hull Suite" By "Insilico". - This is a light-load processing and non-repaint indicator. - You can message in private chat for further changes you need. note: Color filled areas and colored candles are not supported in MT4 version. Here is the source code of a simple Expert Advisor operating based on signals from Hull Suite . #property strict input string EA_Setting= "" ; input int magic_number= 1234 ; inp
MetaTrader mağazasının neden alım-satım stratejileri ve teknik göstergeler satmak için en iyi platform olduğunu biliyor musunuz? Reklam veya yazılım korumasına gerek yok, ödeme sorunları yok. Her şey MetaTrader mağazasında sağlanmaktadır.
Alım-satım fırsatlarını kaçırıyorsunuz:
- Ücretsiz alım-satım uygulamaları
- İşlem kopyalama için 8.000'den fazla sinyal
- Finansal piyasaları keşfetmek için ekonomik haberler
Kayıt
Giriş yap
Gizlilik ve Veri Koruma Politikasını ve MQL5.com Kullanım Şartlarını kabul edersiniz
Hesabınız yoksa, lütfen kaydolun
MQL5.com web sitesine giriş yapmak için çerezlerin kullanımına izin vermelisiniz.
Lütfen tarayıcınızda gerekli ayarı etkinleştirin, aksi takdirde giriş yapamazsınız.