YouTube'dan Mağaza ile ilgili eğitici videoları izleyin
Bir ticaret robotu veya gösterge nasıl satın alınır?
Uzman Danışmanınızı
sanal sunucuda çalıştırın
sanal sunucuda çalıştırın
Satın almadan önce göstergeyi/ticaret robotunu test edin
Mağazada kazanç sağlamak ister misiniz?
Satış için bir ürün nasıl sunulur?
MetaTrader 4 için yeni teknik göstergeler - 17

Introducing the Super Pivot and Fibo Indicator: Your Ultimate Trading Companion Are you ready to take your trading to the next level? The Super Pivot and Fibo Indicator is here to revolutionize your trading strategy. This powerful tool combines key elements such as pivot points, Fibonacci retracement and extension levels, high-low values, and Camarilla points to provide you with a comprehensive and accurate analysis of the market. Key Features: Pivot Points: Our indicator calculates daily, weekl
FREE
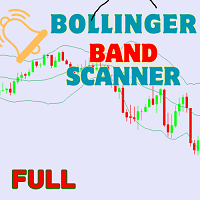
Welcome to the world of advanced trading with the Bollinger Bands Scanner! Maximize your trading potential with our powerful MT4 indicator designed for seamless analysis and real-time insights. Key Features: Effortless Bollinger Bands Scanning: Unlock the full potential of the Bollinger Bands Scanner by effortlessly scanning multiple assets. Receive instant alerts when specific Bollinger Bands conditions are met, ensuring you stay ahead of market movements. Comprehensive Dashboard Insights: Gai

The Flip Flop indicator tracks market trends, ignoring sharp fluctuations and market noise. The indicator can work both for entry points and as a filter.
The Flip Flop indicator displays information in a visual way. Helps in finding entry points during analysis. Suitable for trading on small time frames because it ignores sudden price spikes or corrections in price movements by reducing market noise around the average price.

Std Channels The Std Channels Indicator is a technical indicator that uses standard deviation to create five channels around a price chart. The channels are used to identify support and resistance levels, as well as trends and reversals. The indicator is calculated by first calculating the standard deviation of the price data over a specified period of time. The channels are then created by adding and subtracting the standard deviation from the price data. The five channels are as follows: Upper
Support Resistance Tracking Indicator The Support Resistance Tracking Indicator is a technical analysis tool that helps traders identify and track support and resistance levels. It is a valuable tool for traders of all levels, from beginners to experienced professionals. How it works The Support Resistance Tracking Indicator uses a variety of methods to identify support and resistance levels. These methods include: Historical price action: The indicator looks for price levels where the market

Auto Channel Trend The Auto Channel Trend Indicator is a technical analysis tool that automatically draws trend channels on any chart. It uses a simple algorithm to identify the trend direction and then draws two parallel lines that represent the support and resistance levels of the channel. Features: Automatic trend channel drawing Support and resistance levels Trend direction identification Customizable parameters How to use: Add the indicator to your chart. Adjust the parameters to your likin

To get access to MT5 version please click here . Also you can check this link . This is the exact conversion from TradingView: "UT Bot" by "Yo_adriiiiaan". This is a light-load processing indicator. This is a non-repaint indicator. Buffers are available for processing in EAs. All input fields are available. You can message in private chat for further changes you need. Thanks for downloading

The GGP ADX and DI MT4 Indicator is used to quantify trend strength. ADX calculations are based on a moving average of price range expansion over a given period of time. This indicator is MT4 conversion of the ADX and DI Indicator by “BeikabuOyaji “ in Trading View website and some alert methods are added to provide real-time alerts when a trading signal is generated, in order to allow traders to act quickly and efficiently. For MT5 version please click here . ADX is plotted as a single line w

Cycle Engineering Indicator - Automatic Level Drawing Description: Step into the realm of advanced technical analysis with our "Cycle Engineering Indicator." This cutting-edge tool seamlessly combines the power of cycle engineering theory and numerical principles to automatically generate key trading levels, offering a deeper understanding of market cycles and dynamics. How It Works: The "Cycle Engineering Indicator" is based on a sophisticated theory of market cycles, which takes into account n
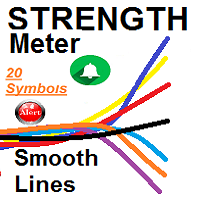
SMOOTH STRENGTH METER INDICATOR (SMOOTH LINE) it draws Currencies TREND Volatility Power / Strength lines : - Detects the 2 highly TRENDED Volatile pairs ( will be the Bold Lines ) - A very Helpful Indicator - It draws smooth lines for up to 20 currencies pairs representing Volatility strength and power - First it indicates the most powerful trended direction pairs : Strongest / Weaker - MAIN FUNCTION :it gives indication of the UP trend most Volatile Line and the

The GGP Wave Trend Oscillator MT4 Indicator is a volatility and momentum tool designed to help traders optimize their trading performance and providing traders find the most accurate market reversals. This indicator is MT4 conversion of the Indicator: WaveTrend Oscillator [WT] by “ LazyBear “ in Trading View website and some alert methods are added to provide real-time alerts when a trading signal is generated, in order to allow traders to act quickly and efficiently. When the oscillator is ab

The Forex Smart System is a user-friendly and intuitive trading solution designed to empower traders in the complex world of forex trading. With a focus on simplicity and practicality, this system offers a streamlined approach that makes it accessible to traders of all experience levels. User-Friendly Interface: The Forex Smart system is designed with simplicity in mind, making it accessible to traders of all experience levels. Its intuitive interface ensures that users can focus on trading rath
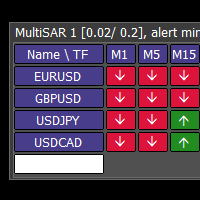
This tool monitors Parabolic SAR indicators on all time frames in the selected markets. Displays a table with signals to open a BUY trade (green) or SELL trade (red). You can easily add or delete market names / symbols. If the conditions for opening a trade on multiple time frames are met, you can be notified by e-mail or phone message (according to the settings in MT4 menu Tools - Options…) You can also set the conditions for sending notifications. The list of symbols/ markets you have entered
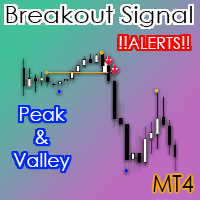
The valley and peak indicator strategy used in forex is a technical analysis approach that aims to identify potential trend reversals in the market. The strategy is based on identifying peaks and valleys in the price chart, which are points where the price reaches a high or low and then reverses direction. The valley and peak indicator is a tool that helps traders identify these patterns and generate buy and sell signals based on them. Here are the key steps involved in using the valley and pea
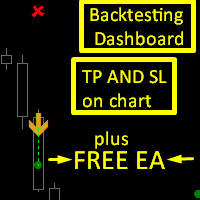
Ambitious Donchian EA can be downloaded from comment section but it need the ambitious donchian indicator to work.
Ambitious Donchian is a Donchian Channel and XO histogram based indicator that gives buy and sell signals in form of up and down arrows with tp and sl as objects on chart.
features :
1. Tp and Sl for each signal , the tp and sl can be selected as based on points or ATR value from indicator settings.
2.backtesting dashboard : the dashboard shows the following according to your i

Homemade Indicator using specific price action system to find suitables buys and sell ideas. *It is very easy to use *Ideal on 5mn timeframe (where i personnally use it)
*It does NOT repaint *It works on every timeframes
*There are a lot of setups of buys and sell everyday *The loss are VERY smalls compared to profits
*It works very well on volatile markets
More ideas to come soon : -Possibilities of changing setups
-Take profits spot -Alerts -etc...

This is the finest structure marking you will ever find in any market. indicator is coded considering the actual structure any trader would use. indicator is coded based on actual candle breaks and not coded based on any pivot or predefined values or specific number of candles high and low. please check out the screenshot. if you want me to fine tune it according to your needs then i am open for it.
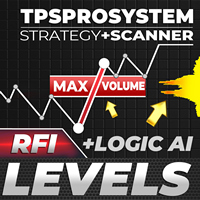
Reversal First Impulse levels (RFI) INSTRUCTIONS RUS - ENG R ecommended to use with an indicator - TPSpro TREND PRO - Version MT5 A key element in trading is zones or levels from which decisions to buy or sell a trading instrument are made. Despite attempts by major players to conceal their presence in the market, they inevitably leave traces. Our task was to learn how to identify these traces and interpret them correctly. Main functions: Displaying activ
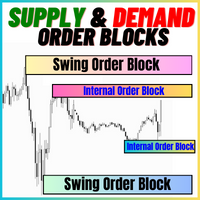
Talepler ve Arz Emir Blokları:
"Talepler ve Arz Emir Blokları" göstergesi, Forex piyasasındaki teknik analiz için temel olan Akıllı Para kavramlarına dayanan sofistike bir araçtır. Temel bir emir blokları göstergesi, enstrümanın tedarik ve talep bölgelerini belirlemeye odaklanır, ki bu da kurumsal tüccarların önemli izler bıraktığı kritik bölgelerdir. Satış emirlerini gösteren tedarik bölgesi ve alım emirlerini gösteren talep bölgesi, tüccarların fiyat hareketlerinde potansiyel ters dönüşleri
FREE

Obie Sniper'a Giriş Obie Sniper göstergesi en iyi Giriş ve Çıkış noktalarını sağlar.
Obie Sniper MT4 göstergesinin basitliği, forex sinyallerinin başarıyla uygulanmasını ve ticaretini kolaylaştırır. Bu gösterge, M5 ve M15 çizelgelerini kullanan kazıyıcılar için iyi çalışır. Aynı zamanda swing yatırımcıları trendi belirlemek ve başarılı bir şekilde işlem yapmak için H1 ve H4 grafiklerini kullanabilirler. Bu gösterge yeni forex yatırımcıları için en uygunudur. Çünkü trendleri belirlemeye ve gör
FREE

Top Breakout Indicator MT4 adlı Hepsi Bir Arada Göstergeyi tanıtmaktan memnuniyet duyarız.
Bu gösterge, ticaret ve programlama konusunda yılların deneyimine sahip bir ekip tarafından geliştirilmiştir.
MQL5 Kanalı: https://www.mql5.com/en/channels/diamondscalping Telegram Kanalı: https://t.me/autoprofitevery MT5: https://www.mql5.com/en/market/product/107047?source=Site+Market+Product+Page
Bu tek gösterge ile hem ticaret yapabilir hem de hesabınızı kolayca yönetebilirsiniz. Gösterge, 2 a

2 SNAKES birinci sınıf bir scalping sistemidir.
Girişler oldukça hassas olduğundan, bu sisteme çok hızlı bir şekilde bağımlı hale gelmeniz muhtemeldir.
2 yılanınız var. Üstlerinde veya altlarında onlara dokunmayan bir mum gördüğünüzde - bu sizin scalping sinyalinizdir.
Daha büyük bir zaman çerçevesi kullanırsanız, scalping takip eden trend haline gelebilir. Yılanlar, piyasanın mevcut durumuna göre tam olarak hesaplanır. Hareketli ortalamalar DEĞİLDİR. Pozisyonunuzu ne kadar süre t
Levels ResSup MT4 ticaret seviyesi göstergesi, fiyat grafiğinde bağımsız olarak destek ve direnç çizgileri ve tahmini ek kanal çizgileri oluşturur.
GÖSTERGE BİLGİSİ Gösterge, destek seviyelerine (mavi ile gösterilir) ve direnç seviyelerine (kırmızı ile gösterilir) sahiptir. Ayrıca, göstergenin hala biçimlendirici destek seviyeleri vardır (bu seviyeler daha önce bahsedilen renklerle vuruşlarla gider).
Ayrıca iç destek seviyeleri (yeşil renkle işaretlenmiş) ve direnç seviyeleri (pembe ren
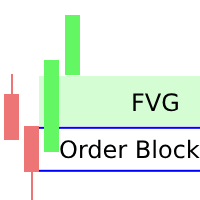
I've combined two trading strategies, the Order Block Strategy and the FVG Trading Strategy, by utilizing a combination of the FVG indicators and Order Blocks. The results have been surprisingly effective.
This is a two-in-one solution that makes it easy for traders to identify critical trading zones. I've optimized the settings so that all you need to do is install and trade; it's not overly complex to explain further. No need for any usage instructions regarding the trading method. You shou
FREE
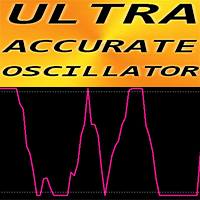
ULTRA ACCURATE Oscillator for MT4 UA Oscillator - is an advanced custom indicator with around 80% accuracy when it is used in combination with trend indicator such as EMA for example. Advanced new calculation method is used. UA Oscillator is much faster and more accurate than standard MT4 oscillators. New generation of Oscillators - see pictures to check examples of how to use it in combination with EMA10. Oversold values: below 0.03 // Overbought values: over 0.97 There are plenty of opportu

The True Magic Oscillator indicator is designed for signal trading. This indicator generates trend signals.
It uses many algorithms and indicators to generate this signal. It tries to generate signals from the points with the highest trend potential.
This indicator is a complete trading product. This indicator does not need any additional indicators.
The indicator is never repainted. The point at which the signal is given does not change.
Features and Recommendations Wor

PLEASE NOTE You can customize the settings of Fast EMA, Slow EMA, MACD SMA & Main SMA. The accuracy will change as per your settings.
100% Non repaint indicator
Pre-alert (get ready) signals
Non-delay indications
24/7 signals
100% No lag
No recalculating The arrows wont repaint even if the signal fails, or you refresh or restart the mt4 Indicator is based on simple crossover strategy of main line and signal line of MACD indicator in consideration with zero line and Main SMA. The best
FREE
Implementation of the classic Heiken Ashi indicator using the T3 smoothing method. The indicator allows you to select the smoothing depth and the smoothing shift relative to the current price. The indicator also allows you to select the price at which the data will be smoothed, as well as the control price with which comparison is made. The proposed approach allows you to visualize the trend and simplify trading decisions.
FREE
The presented indicator is a reworked version of the Moving Speed Normalized indicator, authored by Roman Kiverin . The indicator provides two types of signals: 1. The histogram crosses the zero value; 2. Change of direction by the signal line. To use it effectively, it is necessary to take into account the long-term trend and open a position only in its direction. It is recommended to use signal confirmation. A signal is considered confirmed if the current price has overcome the maximum (for
FREE
The presented indicator allows you to visualize the direction of the trend while cutting off minor price fluctuations. The indicator's customizable parameter (Filter) determines the number of points for the current financial instrument that the indicator cuts off in the process of determining the trend. Despite its simplicity, the indicator can be useful for both beginners and experienced traders. The indicator marks trend reversal points and can send notifications of such signals to the termina
FREE
Technical analysis indicator described in the article by Vladimir Kravchuk: " Digital indicators in the technical analysis of financial markets ".
In the proposed version, the indicator provides two types of signals: 1. Zero crossing; 2. Change of direction. To use it effectively, it is necessary to take into account the long-term trend and open a position only in its direction. It is recommended to use signal confirmation. A signal is considered confirmed if the current price has overcome the
FREE
Technical analysis indicator described in the article by Vladimir Kravchuk: " Digital indicators in the technical analysis of financial markets ".
In the proposed version, the indicator provides two types of signals: 1. Zero crossing; 2. Change of direction. To use it effectively, it is necessary to take into account the long-term trend and open a position only in its direction. It is recommended to use signal confirmation. A signal is considered confirmed if the current price has overcome the
FREE
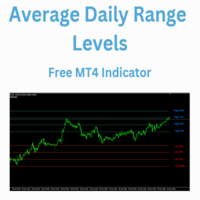
The Average Daily Range Levels indicator shows the ADR levels on the chart as if they were supports and resistances and is updated daily.
By default the indicator uses the 5-day average of the daily range. There are several strategies that suggest that these levels can be used to determine where the price can bounce and it is often said that the price can typically move 75% of the ADR.
In future versions I may add alerts at each level
Can you suggest any changes?
Greetings!

The indicator detects market efficiencies and inefficiencies by studying price movements and marks candles where the best efficiencies occurred. The most 'efficient' candles are indicated with a vertical bar histogram. Taller bars represent these candles. The highs and lows of these candles are supply and demand areas, important levels that will be retested in the future. It can be used on all time frames with the same settings.
FREE
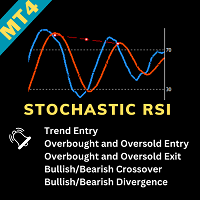
Stochastic RSI Indicator - Master the Art of Timing Elevate your trading game with the "Stochastic RSI Indicator." This powerful tool marries the Stochastic oscillator with the Relative Strength Index (RSI), offering precise insights into market dynamics. It's your key to mastering the art of timing in trading. About the Indicator : The Stochastic RSI Indicator combines two robust indicators - Stochastic and RSI - to provide traders with an exceptional tool for identifying entry and exit points
FREE
El estudio realizado en la plataforma MetaTrader 4 (MT4) se centra en el análisis de los niveles de desviaciones estándar (SD) correspondientes al modelo de retornos normales de precios en activos financieros. A través de un meticuloso procesamiento de datos históricos del mercado, se calculan las desviaciones estándar, lo que permite identificar rangos estadísticos donde los precios podrían oscilar en el futuro cercano. Es crucial entender que esta herramienta de análisis y medida cuantitativa
Всем привет. И снова, я, Вадим Сергеевич Лепехо, трейдер(частный) опыт 20 лет около. Forex в основном. Предлагаю Вам оценить, протестировать, опробовать индикатор. И дать свою оценку, заключение, РЕЗЮМЕ....)))). Итак, как он работает. Очень прост в понимании. Алгоритм такой. Индикатор на графике(chart) рисует кружки снизу сверху, разных цветов. Ждем когда появится на фоне одних красных кружков 1, 2, ну на крайняк 3 кружка зеленого цвета и + обязательно должен появится следом опять кружок красног
FREE
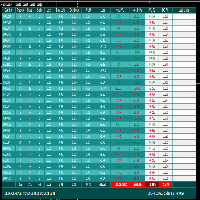
FCK Trade Report This indicator was developed by Fx Candle King. BEFORE CHOOSE CUSTOM PERIOD, GO TO TERMINAL WINDOW (ctrl+T), right click on ACCOUNT HISTORY and CHOOSE ALL HISTORY. This report searches the filtered data in your ACCOUNT CURRENT & HISTORY TRADE, Select your timespan for the report open and closed trades etc... Chose the report type - List only OPEN orders / List only CLOSED orders / List both OPEN and CLOSED orders
FREE

The " Rsi Monitor Screen " is a powerful and versatile MetaTrader 4 (MT4) indicator designed to provide a comprehensive overview of the Relative Strength Index (RSI) across multiple timeframes on a single screen. This tool is essential for traders seeking a holistic view of RSI data, enabling informed decision-making and precise analysis. Key Features: Multi-Timeframe RSI Display: This indicator displays RSI values for various timeframes, from M1 (1 minute) to MN1 (monthly), all on a single, use

The GGP Williams Vix Fix MT4 Indicator is based on the volatility of the market and grants a huge support for finding out when a correction is coming to end. This indicator is MT5 conversion of the CM_Williams_Vix_Fix Finds Market Bottoms Indicator by “ChrisMoody “ in Trading View website and some alert methods are added to provide real-time alerts when a trading signal is generated, in order to allow traders to act quickly and efficiently. For MT5 version please click here . Larry Williams

GG TrendBar Indicator - Your Multitimeframe ADX Trading Solution Experience the power of multi-timeframe trading with the "GG TrendBar Indicator." This versatile tool, built upon the ADX indicator, offers precise insights by considering multiple timeframes, ensuring you make well-informed trading decisions. Basic Details : Indicator Type : GG TrendBar Indicator (Multi-Timeframe ADX) Key Metrics : Real-time ADX analysis across multiple timeframes. Customization : Enable or disable specific timefr
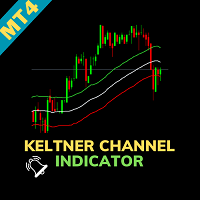
Keltner Channel Indicator - Uncover Market Trends with Precision Welcome to the world of precision trading with the "Keltner Channel Indicator" for MetaTrader 4. This powerful tool, inspired by Chester Keltner's work, helps you analyze price movements and identify potential trends with remarkable accuracy. Basic Details : Indicator Type : Keltner Channel Indicator Key Metrics : Real-time price volatility analysis. Customization : Fully customizable settings to align with your unique trading stra

Introducing the Accumulated RSI, your ultimate tool for precise trend identification and momentum analysis in the world of Forex and financial markets. This cutting-edge MetaTrader 4 (MT4) indicator, designed for traders seeking unparalleled insight and accuracy, empowers you to make well-informed trading decisions like never before. Features Accurate Trend Detection: The Accumulated RSI utilizes the Relative Strength Index (RSI) in an innovative way to pinpoint the prevailing market trends wit
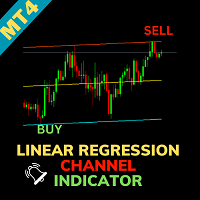
Linear Regression Channel Indicator - Visualize Trends with Precision Enter the world of precision trading with the "Linear Regression Channel Indicator" for MetaTrader 4. This versatile tool, based on linear regression analysis, provides you with a clear visual representation of market trends, enabling you to make well-informed trading decisions. Basic Details : Indicator Type : Linear Regression Channel Indicator Key Metrics : Real-time price trend analysis through linear regression. Customiza
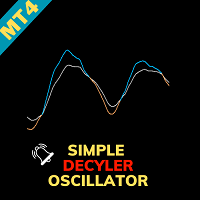
Welcome to the Simple Decycler Oscillator, a powerful indicator designed to enhance your trading experience. This user guide provides comprehensive insights into using the indicator effectively, ensuring you make informed trading decisions. Overview The Simple Decycler Oscillator is a versatile tool that combines two Decyclers, utilizing periods of 100 (fast - green) and 125 (slow - blue). This dual approach, akin to moving averages, facilitates trend identification through a straightforward cr
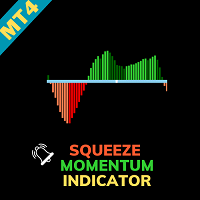
Squeeze Momentum Indicator - Unleash the Power of Market Momentum Welcome to the world of precision trading with the "Squeeze Momentum Indicator" for MetaTrader 4. This advanced tool is designed to help you harness the power of market momentum, providing you with actionable insights to make well-informed trading decisions. Basic Details : Indicator Type : Squeeze Momentum Indicator Key Metrics : Real-time analysis of market momentum. Customization : Fully customizable settings to align with your

Всем Добрый День. Вас беспокоит всех снова, я Вадим Сергеевич Лепехо. Предлагаю свой продукт на обозрение, просмотр, оценку его. Продукт(индикатор) прост в понимании сигнала(алерта), алготрейдинга. Индикатор рисует над свечами кружки, точки красного и зеленого цвета. Нужно дождаться появления череды точек одного цвета(цвет череды красный), а потом должен появиться зеленого цвета кружок, точка и обязательно сформироваться потом точка другого цвета, т.е. красного. Выставляем сетку ордеров вверх и
Всем добрый. Это снова, я, Вадим Сергеевич Лепехо. Предлагаю приобрести и протестировать кота в мешке, мяууууууу )))). Очень просится вы заметили. Данный индикатор рисует знаки на графике. Цена пробивает их и в принципе ожидаем возврата цены обратно. Индикатор работает, отталкивается от дивергенции на рынке форекс. Хотя, если вы опытные трейдер, юзеры. Рынка(форекс), как такого и нет. Это не суть Главное получать профит постоянно. Спасибо за внимание До свидания.

Description: Unlock the power of numerology in your trading with our unique Numerology Indicator. This indicator is meticulously designed to provide traders with insights based on numerology principles and 0.7 values, offering a fresh perspective on market analysis. How It Works: Our Numerology Indicator leverages the ancient wisdom of numerology, which assigns numerical significance to various aspects of life. In the context of trading, we've harnessed the mystical power of 0.7 values, aligning

The GGP Squeeze Momentum MT4 Indicator is a volatility and momentum tool designed to help traders optimize their trading performance and providing traders with actionable insights to make well-informed trading decisions. This indicator is MT4 conversion of the Squeeze Momentum Indicator by “LazyBear “ in Trading View website and some alert methods are added to provide real-time alerts when a trading signal is generated, in order to allow traders to act quickly and efficiently. For MT5 version p

This script automatically calculates and updates ICT's daily IPDA look back time intervals and their respective discount / equilibrium / premium, so you don't have to :) IPDA stands for Interbank Price Delivery Algorithm. Said algorithm appears to be referencing the past 20, 40, and 60 days intervals as points of reference to define ranges and related PD arrays. Intraday traders can find most value in the 20 Day Look Back box, by observing imbalances and points of interest. Longer term traders c

Support and Resistance Barry Indicator - Your Path to Precision Trading Explore the world of precision trading with the "Support and Resistance Barry Indicator" for MetaTrader 4. This robust tool is designed to help you identify key support and resistance levels with exceptional accuracy, enhancing your ability to make well-informed trading decisions. Basic Details : Indicator Type : Support and Resistance Barry Indicator Key Metrics : Real-time identification of crucial support and resistance l
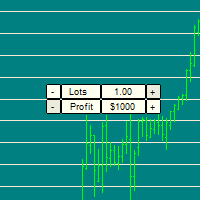
Easily manage your risk and position sizing! It can be tricky to size your trade in the moment, due to different currency / commodity values. For example, placing a 1 Lot position on XAUUSD can easily blow an account that could handle 1 lot on GBPUSD. See screenshots to see how Gold can move $500 on 1 lot much faster than GBPUSD.
THe indicator draws horizontal lines that allow you to easily compare the potential risk/reward across timeframes and symbols. ---- Inputs are: Risk Size: The Loss/Pr

Gold Venamax - bu en iyi hisse senedi teknik göstergesidir. Gösterge algoritması bir varlığın fiyat hareketini analiz eder ve oynaklığı ve potansiyel giriş bölgelerini yansıtır.
Gösterge özellikleri:
Bu, rahat ve karlı ticaret için Magic ve iki Blok trend oku içeren süper bir göstergedir. Grafikte blokları değiştirmek için Kırmızı Düğme görüntülenir. Magic, gösterge ayarlarında ayarlanır, böylece göstergeyi farklı Blokları görüntüleyen iki grafiğe yükleyebilirsiniz. Gold Venamax farklı ok

Altın Trend - bu iyi bir hisse senedi teknik göstergesidir. Gösterge algoritması, bir varlığın fiyat hareketini analiz eder ve oynaklığı ve potansiyel giriş bölgelerini yansıtır.
En iyi gösterge sinyalleri:
- SATIŞ için = kırmızı histogram + kırmızı KISA işaretçi + aynı yönde sarı sinyal oku. - AL için = mavi histogram + mavi UZUN işaretçi + aynı yönde aqua sinyal oku.
Göstergenin faydaları:
1. Gösterge yüksek doğrulukta sinyaller üretir. 2. Onaylanmış bir ok sinyali yalnızca tren

Obie Osilatör göstergesi sıfır seviyesinin üstünde ve altında dalgalanıyor.
Sıfır seviyesinin üzerinde fiyatların yükseliş eğiliminde olduğu söyleniyor ve tüccarlar alım satım fırsatlarını arıyor.
Sıfır seviyesinin altında fiyatların düşüş eğiliminde olduğu söyleniyor ve tüccarlar satış fırsatları arıyor.
Bu göstergenin trend takip eden bir göstergeyle birlikte kullanılması tavsiye edilir.
Bu gösterge ölçeklendirme, günlük ticaret, swing ticareti ve pozisyon ticareti için çalışır. Obie
FREE

Çoklu para birimi ve çoklu zaman dilimi göstergesi MACD. Kontrol paneli hem Geleneksel (gerçek) MACD'yi hem de MetaTrader'da yerleşik olan MACD'yi görüntüleyebilir.
Panelde göstergenin mevcut durumunu, MACD çizgilerinin hareket yönünü, kesişimlerini ve gösterge grafiğini içeren bir açılır pencereyi görebilirsiniz. Parametrelerde istediğiniz herhangi bir çift sembolü ve zaman dilimini belirleyebilirsiniz. Tarayıcı aynı zamanda birbirini kesen çizgiler ve Sıfır seviyesini geçen çizgiler hakkınd
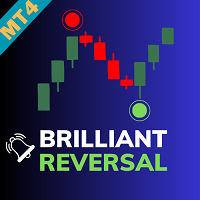
Brilliant Reversal Indicator - Your Ultimate Alert-Driven Trading Solution Unlock the potential for unparalleled trading success with the "Brilliant Reversal Indicator." This powerful tool has been meticulously designed to empower traders by identifying critical reversal opportunities with lightning-fast alerts. Key Features : Precise Reversal Detection : The Brilliant Reversal Indicator specializes in pinpointing potential trend reversals, helping you seize opportunities to enter or exit positi

Nas100 killer V2 (See video of how we test the indicator live) 1000% non-repaint indicator appears on current candlestick. Timeframes: M5, M15, M30, H1, H4. Works on pairs such as (NAS100, US30, SPX500, and Gold) The indicator is strictly for scalping do not hold trades for too long. Orange arrows look for selling opportunities. Light Blue arrows look for buying opportunities.
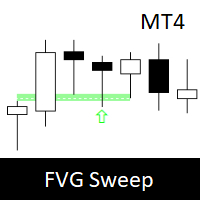
Fair Value Gap Sweep is a unique and powerful indicator that draws fair value gaps on your chart and alerts you when a gap has been swept by the price. A fair value gap is a price gap that occurs when the market opens at a different level than the previous close, creating an imbalance between buyers and sellers. A gap sweep is when the price moves back to fill the gap, indicating a change in market sentiment and a potential trading opportunity.
Fair Value Gap Sweep indicator has the following
FREE

- Real price is 70$ - 50% Discount ( It is 35$ now )
Contact me for instruction, any questions! Introduction A flag can be used as an entry pattern for the continuation of an established trend. The formation usually occurs after a strong trending move. The pattern usually forms at the midpoint of a full swing and shows the start of moving. Bullish flags can form after an uptrend, bearish flags can form after a downtrend.
Flag Pattern Scanner Indicator It is usually difficult for a trade

The Market Structures Pro indicator finds and displays 5 (five) patterns of the Smart Money Concepts (SMC) system on the chart, namely:
Break Of Structures (BoS) Change of character (CHoCH) Equal Highs & Lows Premium, Equilibrium and Discount zones with Fibo grid High-high, Low-low, High-low and Low-high extremes
Patterns are displayed for two modes - Swing and Internal and are easily distinguished by color on the chart. Internal mode features higher contrast colors, finer lines, and sm

SignalPinner is a trend line Indicator which can detect market trends early by including three types of signal arrows. Non repaint and trend following. Signals on the strong trend, signals in the beginning of trend and signals with multiple market analysis algorithm as the main signals. Supported by alert notification message to keep you getting signals while on the go. Symbols: Any Timeframes: Any
Features Histogram buffers as a sign the trend is started. It can help the trader knowing the ma

TLM Map AM (Trend Line Momentum Map) is an indicator developed based on a set of digital technical analysis indicators described in the article by Vladimir Kravchuk: " Digital indicators in the technical analysis of financial markets ". The indicator displays in a separate window a complex of digital technical analysis indicators such as FTLM and STLM. Recommended for use in conjunction with the RTL Map AM (Reference Trend Line Map) indicator. The indicator has no customizable parameters.
FREE
DM Osc - Digital Momentum Oscillator.
The indicator is an oscillator based on adaptive digital filters with signals displayed both on the oscillator itself and on the price chart. The indicator provides two types of signals: When changing the direction of the oscillator line; When the oscillator line crosses the zero value. Signals are given on fully formed bars. Indicator signals require confirmation in the form of the price breaking the high/low of the bar on which the signal was sent. The i
FREE
The presented indicator is a joint application of the FATL digital filter and the Ehlers filter (J. F. Ehlers). This indicator gives reliable signals with a small delay, which makes trading based on it very effective. After receiving the signal, you should wait for its confirmation - overcoming the high/low of the bar on which the signal was given by the price.
It is recommended to pay attention to divergence or convergence signals (discrepancy in the ratio of new highs or lows on the oscillat
FREE
A quick indicator with simple settings that does not take up much space in the working window and is displayed as simply as possible. The indicator analyzes the ratio of maximum and minimum prices for selected periods. Visually, the indicator is similar to its first version (Chainsaw AM), but a completely different principle is used for calculation. The indicator allows you to clearly determine the medium/short-term trend and support/resistance levels at points where the trend direction changes.
FREE
RTL Map (Reference Trend Line Map) - the indicator is based on a complex of digital technical indicators described in the article by Vladimir Kravchuk: " Digital indicators in the technical analysis of financial markets ". The indicator displays buy/sell signals on the price chart for such digital indicators of technical analysis as FTLM and STLM, as well as directly the lines of digital filters RSTL, SATL, RFTL, FATL. Signals are displayed on fully formed bars and are not redrawn. It is recomme
FREE
The presented indicator displays a trend line and support/resistance line on the price chart. A change in the direction of the trend line indicates a change in the medium-term trend. A trend line above the support line is a buy signal. A trend line below the resistance line is a sell signal. Specific rules of using the indicator are set out in the comments to it.
FREE

The ENG TREND is a powerful tool designed for traders in the forex and financial markets who seek a unique approach to identifying support and resistance levels. This indicator leverages the principles of numerology, a discipline that explores the mystical and symbolic meanings of numbers, to create a trend analysis method that goes beyond traditional technical analysis. Key Features: Numerology-Based Analysis: The ENG TREND applies numerology principles to price data, allowing traders to uncove
MetaTrader Mağaza, ticaret robotları ve teknik göstergelerin benzersiz bir deposudur.
Yatırımcılara sunduğumuz benzersiz hizmetler hakkında daha fazla bilgi edinmek için MQL5.community - Kullanıcı notunu okuyun: ticaret sinyallerini kopyalama, freelancerlar tarafından geliştirilen özel uygulamalar, ödeme sistemi aracılığıyla otomatik ödemeler ve MQL5 Bulut Ağı.
Ticaret fırsatlarını kaçırıyorsunuz:
- Ücretsiz ticaret uygulamaları
- İşlem kopyalama için 8.000'den fazla sinyal
- Finansal piyasaları keşfetmek için ekonomik haberler
Kayıt
Giriş yap
Gizlilik ve Veri Koruma Politikasını ve MQL5.com Kullanım Şartlarını kabul edersiniz
Hesabınız yoksa, lütfen kaydolun
MQL5.com web sitesine giriş yapmak için çerezlerin kullanımına izin vermelisiniz.
Lütfen tarayıcınızda gerekli ayarı etkinleştirin, aksi takdirde giriş yapamazsınız.