YouTube'dan Mağaza ile ilgili eğitici videoları izleyin
Bir alım-satım robotu veya gösterge nasıl satın alınır?
Uzman Danışmanınızı
sanal sunucuda çalıştırın
sanal sunucuda çalıştırın
Satın almadan önce göstergeyi/alım-satım robotunu test edin
Mağazada kazanç sağlamak ister misiniz?
Satış için bir ürün nasıl sunulur?
MetaTrader 4 için yeni teknik göstergeler
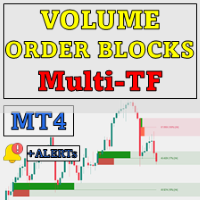
Sadece $49'a 3 kopya mevcut – Fiyat $149'a yükselmeden önce kendi kopyanızı alın! Volumetrik Sipariş Blokları Çoklu Zaman Çerçevesi göstergesi, önemli piyasa katılımcılarının siparişleri biriktirdiği kilit fiyat bölgelerini belirleyerek piyasa davranışına daha derin bir içgörü arayan tüccarlar için tasarlanmış güçlü bir araçtır. Bu bölgeler, Volumetrik Sipariş Blokları olarak bilinir ve destek ve direnç bölgeleri olarak potansiyel hizmet verebilir, bilinçli ticaret kararları için önemli bir ava

What is Elliott Wave analysis all about? You probably heard something about Elliott waves or even seen wave counts. That's because nowadays Elliott wave analysis becomes one of the most popular approaches of the Forex market forecasting. Why? Elliott Wave Principle is the only tool in our experience, which can sort out the price movement on every timeframe from the Monthly or even Yearly chars to just one-minute intraday intervals. The Elliott Wave Theory is a technical analysis concept used to

Hit Rate Top Bottom Signal Hit Rate Top Bottom Signal Hit Rate Top Bottom Signal tamamen yenilikçi bir yaklaşım sunar. Belirli bir TP-SL ve hangi ÇİFTLER/TF'lerde en iyi performansı gösterdiğini önceden değerlendirmek isteyenler için idealdir. Hit Rate Top Bottom Signal stratejisi, her trader ve her tür ticaret için temel bir araçtır çünkü yalnızca yeniden çizim yapmayan kesin sinyaller sağlamakla kalmaz, aynı zamanda her Parite ve TF için başarı oranının ayrıntılı bir kaydını tutar ve önceden t
ARC Indicator — üç algoritmaya dayanan bir göstergedir: analitik bir algoritma, optimal giriş noktalarını belirleyen bir algoritma ve işlemlerden çıkış için bir algoritma. Göstergesi hem alım hem de satım için uygundur, bu da onu Forex piyasasında kullanışlı kılar. İşlemden çıkış, özel bir algoritma sayesinde en iyi anda gerçekleşir. Stop Loss seviyeleri otomatik olarak hesaplanır ve iki mod mevcuttur: "Minimal" Modu — scalping için uygundur. "Normal" Modu — riski artırır, ancak aynı zaman
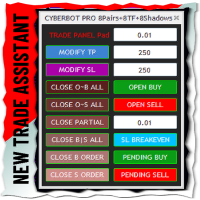
[ Disclaimer ] u can download it for free to help with the analysis using oscillators just for CyberBot customers! cool news: anyone can turn it on without joining the main product [paid or free]. but heads up - a warning might pop up since this is linked to the main product. if u like it and find it helpful, u can upgrade the "ReviewPass" by just writing a few sentences in the review box to be a wise reviewer. hurry up while it's still free, spots are limited! NEW Timing Oscillator for the Cyb
FREE
Sadece 5 Kopya Mevcut, Fiyat $49 – Fiyat $149’a Çıkmadan Hemen Alın! Mum çubuğu formasyonlarını öğrenmek, piyasada bilinçli kararlar almak isteyen her tüccar için önemlidir. İşte All Candlestick Patterns – teknik analizlerinizi geliştirmek ve piyasa eğilimleri ve olası ters dönüşler hakkında güçlü bilgiler sağlamak için tasarlanmış kapsamlı bir araç. Bu her şeyi kapsayan çözüm, tüm ana mum çubuğu formasyonlarını tanır, böylece fiyat hareketlerini tahmin etmek ve stratejilerinizi hassas bir şeki

This indicator is a fusion of the Parabolic SAR and Fibonacci indicators. Fibo is drawn on the last wave, at the peaks the indicator displays prices for convenience. Parabolic SAR helps to define the market trend and generates trends following trade signals. On the other hand, Fibonacci plots the price retracement levels so that traders can determine a better and safer place to enter the market. You can purchase our expert advisors through our affiliate program with a 50% discount. More info
FREE
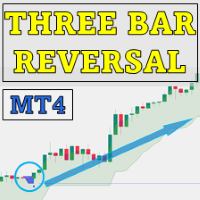
Sadece 5 kopya $49 fiyatla mevcut – Fiyat $149’a çıkmadan önce sizin olsun! Üç Çubuklu Tersine Dönüş Deseni Göstergesi , üç çubuklu tersine dönüş modellerini otomatik olarak tanımlayıp fiyat grafiğinde vurgulayan güçlü bir araç sunar. Bu gösterge, potansiyel trend tersine dönüşlerini tespit etmek için değerli bir kaynaktır ve kullanıcıların entegre edilmiş trend göstergeleriyle sinyal doğruluğunu artırmasına olanak tanır. MT5 versiyonunu görmek için: Three Bar Reversal Pattern MT5 Daha fazla ür

This indicator consists of two indicators RSI and EMA. As signals for more effective entries and exits from positions, it is recommended to use visual monitoring of line crossings, since the arrows appear with a delay and display the strength of the trend after the lines cross and are auxiliary information. You can purchase our expert advisors through our affiliate program with a 50% discount. More information is available on our website ProfRoboTrading.
FREE
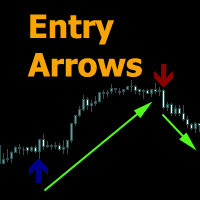
Volatilite Kırılma Göstergesi dönüm noktalarını belirleyen bir trend göstergesidir. Göstergenin çalışma prensibi başlangıçtaki trendin dönüş noktalarını bulmaya dayanmaktadır.
ATR volatilite göstergelerine dayandığı için çizgi geçişlerinde olduğu gibi fiyatın tersine dönmesini ve bir miktar ilerlemesini beklemez. ATR'ye endeksli volatilite tersine çevirme yöntemini kullanarak trend değişimini belirler.
Herhangi bir finansal araç ve zaman diliminde kullanılabilir.
Oklar yalnızca mum kapandıkta

The Wolf Wave Finder Indicator is a popular indicator, that is useful in identifying potential trading opportunities. The indicator works by recognizing the Wolf Wave pattern, which is a well-known pattern used by professional traders to identify potential areas of support and resistance. The indicator is easy to use and provides traders with an easy way to identify potential trades. The Wolf Wave Finder Indicator is a great tool for traders who are looking for a reliable and accurate way
FREE
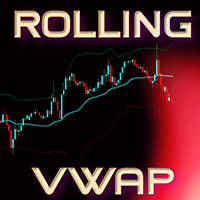
Bu, MetaTrader için Rolling VWAP göstergesidir. Belirli sayıda mum üzerinden tik hacmine dayalı Hacim Ağırlıklı Ortalama Fiyat (VWAP) hesaplar ve daha derin piyasa analizi için opsiyonel standart sapma bantları içerir. Bu gösterge yeniden çizilmez ve sabitlenmez. Gösterge Genel Bakışı Rolling VWAP Hesaplaması : Ana çizgi (aqua rengi) belirli sayıda bar için VWAP hesaplar ( barsToCalculate ). Bu VWAP, her barın tik hacmini hesaba katarak tipik fiyatı buna göre ağırlıklandırır. Sapma Bantları : Gö
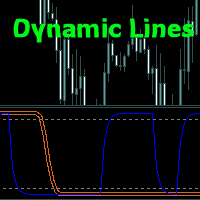
Dalga ilkesine dayalı trend ticareti için doğrusal gösterge. Trend çizgisi kılavuzuna ve üst ve alt aralıklar arasındaki fiyat hareketlerini belirleyen özel bir osilatöre sahiptir.
Göstergenin yönlendirici trend çizgisi piyasanın hangi yöne doğru ilerlediğini gösterir. Turuncu trend çizgisi sıfır seviyesini yukarıdan aşağıya doğru geçtiğinde piyasa düşüş eğilimi gösterir; aşağıdan yukarıya doğru geçtiğinde bu bir boğa piyasasıdır. Osilatör, üst ve alt aralıklar arasında hareket eden dinamik b

Candle Probability Scalper Kullanım Kılavuzu Bu gösterge, scalping'i kolay ve %100 sezgisel hale getirir. Candle Probability Scalper , GERÇEK ZAMANLI olarak mevcut mum üzerinde alıcıların ve satıcıların güç yüzdelerini bir bakışta gösterir. Yüzdeler her tikte güncellenir, bu sayede alıcı ve satıcıların çoğunluğunun ne yaptığını saniye saniye gecikme olmadan bilirsiniz. Bu, her bir tarafın gücünü belirlemenize veya doğrulamanıza ve dolayısıyla fiyatın olası yönünü tahmin etmenize büyük ölçüde ya
Binary SF göstergesi, ikili opsiyonlar için MetaTrader 4 platformu için tasarlanmıştır ve yeniden çizilmeden sinyal sağlar, bu da onu tüccarlar için güvenilir bir araç haline getirir. Herhangi bir zaman dilimine (M1'den günlüğe kadar) uygun olup, trend ticareti için ağırlıklı olarak kullanılır ve kısa ve orta vadeli işlemler için uygun giriş noktalarını belirlemede tüccarlara yardımcı olur. Çalışma Prensibi ve Sinyaller Göstergesi, piyasayı analiz eder ve mevcut mum tamamlandığında grafikte görü
To get access to MT5 version please contact via private message. You can also check the other popular version of this indicator here . This is the exact conversion from TradingView:"Optimized Trend Tracker" by "kivancozbilgic" This is a light-load processing indicator. It is a non-repaint indicator. Highlighting option is not available due to MT4 restricted graphics. Buffers are available for processing in EAs. You can message in private chat for further changes you need. Thanks.
Moving Averages Divergence 3x3 Indicator uses the crossover technique for signaling the market trend and the trade opportunities as well. It applies 3 formats of the same indicator and allows them to plot the crossover signals which are interpreted as the trade signals along with the direction of the market trend. Moving Averages Divergence 3x3 Indicator can be applied to trade all kinds of forex currency pairs within the financial markets. Although, this indicator works well only in be
FREE

Last 50 Pips göstergesi, son fiyat hareketlerine dayalı olarak alım ve satım fırsatlarını hızlı bir şekilde belirlemek için tasarlanmıştır. Son mumlardaki fiyat değişimini ölçer ve fiyatın yön değiştirebileceği anları sarı renkle vurgular.
Alım sinyali: Gösterge KIRMIZI dan SARI ya değiştiğinde ALIM pozisyonu açmalısınız, bu da düşüş trendinden yükseliş trendine geçişi önerir. Ne kadar kolay olduğunu görmek için lütfen resimlere bakın.
Satış sinyali: Gösterge YEŞİL den SARI ya değiştiğinde S
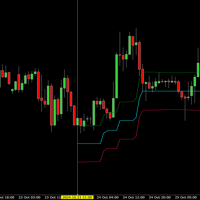
Bu gösterge, Halftrend göstergesinin değerli özelliklerini bazı faydalı eklemelerle birlikte sunar.
- Sabitlenmiş dikey çizgi : Hesaplamayı herhangi bir noktada, sadece sürükle ve bırak yöntemiyle başlatabilirsiniz.
- Sapma fonksiyonu bir kanal oluşturmanızı sağlar.
- Birden fazla uyarı türü (açılır pencere, push, e-posta, ses...)
Tüm dayanaklar ve zaman dilimleri için çalışır.
Herkes için anlaşılması kolay ve kullanışlı
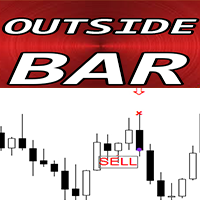
Forex Indicator OUTSIDE Bar Pattern for MT4 Indicator " OUTSIDE Bar " is very powerful indicator for Price Action trading : No repaint, No delays; Indicator detects OUTSIDE Bar patterns on chart: Bullish OUTSIDE Bar - Blue arrow signal on chart (see pictures) Bearish OUTSIDE Bar - Red arrow signal on chart (see pictures) P C, Mobile & Email alerts are included Indicator " OUTSIDE Bar Pattern " is excellent to combine with Support/Resistance Levels // More great Expert Ad
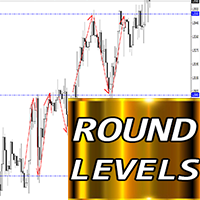
Forex Indicator "Round Levels" for MT4 Indicator "Round Levels" is must have auxiliary indicator for traders who take support/resistance into consideration Round Levels are respected by the price very much - price rebounces from round levels very often Use 1000 points Step for H4, D1 time frames U se 500 points Step for H1 and lower time frames (for intraday trading) Also Round levels are good to allocate Take Profits (in front of round level) and SL (behind the round level) These levels are ve
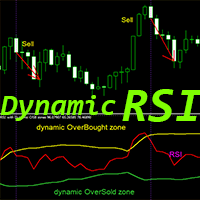
Forex Indicator "RSI with Dynamic OverSold/OverBought zones" for MT4. RSI is one of the most popular oscillators for trading - very good for Scalping. It is great to take Sell entries from dynamic OverBought zone and Buy entries from dynamic OverSold zone RSI oscillator also is very useful for divergence detection This indicator is excellent to combine with Price Action entries from OverSold/Bought areas as well D ynamic OverBought zone - above yellow line
D ynamic OverSold zo
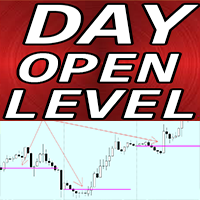
Forex Indicator DAY OPEN LEVEL for MT4 Indicator "Day Open Level" is very useful auxiliary indicator OPEN day level is so important because very often price returns to that area during the day. Indicator shows you daily open line for each day It is useful for intraday traders to set up targets or use as support/resistance area. Day Open Level indicator can be used for Reversal intraday trading // More great Expert Advisors and Indicators are available here: https://www.mql5.com/en/users/def138
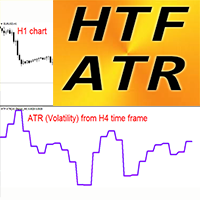
Forex Volatility Indicator HTF ATR for MT4 Average True Range itself is one of the most impotrant indicators for traders - it shows market volatility H TF ATR is a market volatility indicator used in technical analysis . HTF means - H igher Time Frame ATR is great to plan your dynamic Take Profits / SL locations: For example most optimal SL values are located in 1.2-2.5 ATR values This indicator is a useful tool to add to any trading system HTF ATR Indicator allows you t
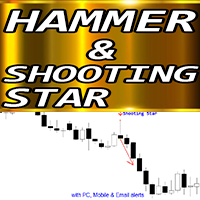
Forex Indicator " Hammer and Shooting Star pattern" for MT4 Indicator " Hammer and Shooting Star pattern " is very powerful indicator for Price Action trading : No repaint, No delays; Indicator detects bullish Hammer and bearish Shooting Star patterns on chart: Bullish Hammer - Blue arrow signal on chart (see pictures) Bearish Shooting Star - Red arrow signal on chart (see pictures) P C, Mobile & Email alerts are included Indicator " Hammer and Shooting Star pattern" is
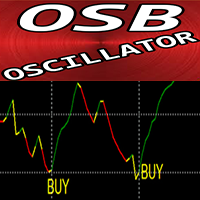
OSB Oscillator - is advanced custom indicator, efficient Price Action auxiliary tool! Advanced new calculation method is used. New generation of Oscillators - see pictures to check how to use it. OSB Oscillator is auxiliary tool to find exact entry points for Price Action, Divergence and Oversold/OverBought signals Oversold values: below 30 Overbought values: over 70 There are plenty of opportunities to upgrade even standard strategies with this indicator. It is much faster and more accurate
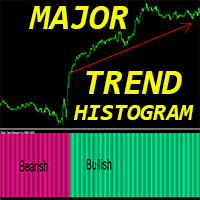
Forex Indicator "Major Trend Histogram" for MT4 Major Trend Histogram indicator designed to catch really huge trends Indicator can be in 2 colors: DeepPink for bearish trend and SpringGreen for bullish one (colors can be changed) It detects trends on the beginning stages - way more efficient than any standard MA cross M ajor Trend Histogram can be combined with any other trading methods: Price Action, VSA, other indicators Indicator has built-in Mobile and PC alerts
// More great Exper
Questo indicatore avanzato è un potente strumento progettato per aiutare i trader a identificare i livelli chiave di supporto e resistenza nel mercato. Questo indicatore è versatile e offre un'interfaccia personalizzabile e intuitiva, consentendo ai trader di scegliere tra sei diversi metodi di calcolo del punto pivot: Classic, Camarilla, Woodie, Floor, Fibonacci, Fibonacci Retracement.
FREE
Questo indicatore per MT4 traccia automaticamente livelli di supporto e resistenza basati sui frattali, evidenziando aree chiave del mercato in cui il prezzo potrebbe invertire o rallentare. I frattali sono strutture grafiche che identificano massimi e minimi significativi, formando così un sistema dinamico di livelli di supporto e resistenza. L'indicatore permette di visualizzare questi livelli direttamente sul grafico, agevolando l'analisi tecnica e l'identificazione di potenziali punti di ing
FREE

Please Good Review on this indicator, and i will maybe produce more indicators, Coming soon, EA base on this indicators
Linear Weighted Moving Average with HLCC applied price, and Bollinger bands with LWMA as applied price. Interesing Buy and Sell arrow based on this indicator , non Lag indicator as arrow will appear 1 candle after crossed...............
FREE
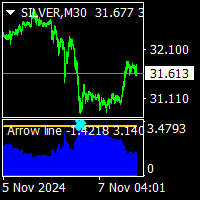
Arrow line indicator is no repaint trend indicator. it works on all time frame and all pairs. it is a pi number ( π) trigger based trend indicator. suitable for experienced traders and beginners. easy to understand. there is a trigger line and 2 histograms. red histogram is ower trigger that is top signal.. blue histogram is over trigger that is bottom signal. minimum bar number is 500. processed value must be setled between 500-3000. max value is depend to chart you are using.
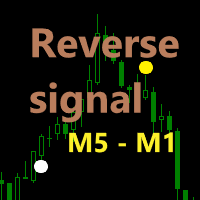
Reverse signal M5 - M1
Welcome back to my page!
- The Reverse signal M5 - M1 indicator was created especially for the time intervals M5 - M1. - On the M5 this indicator has very good results. - It also has good results on the M1 time frame. But on the M5 they are safer. - On longer time intervals, the indicator gives rare and very rare signals.
- The indicator works on all currency pairs. - We have seen very good signals on GBPJPY.
- Indicator does not repaint.
- The white circle re
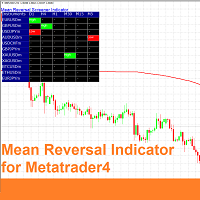
The Mean Reversal Indicator for MetaTrader 4 is a custom technical tool that identifies when the market reaches an n-period high or low, signaling potential mean reversion opportunities. Acting as a versatile screener, this indicator enables traders to detect n-period highs/lows across any selected timeframe and market offered by the broker, making it highly adaptable for multi-market or multi-timeframe analysis. Additionally, the Mean Reversal Indicator offers optional signal filters, including
Questo indicatore per MT4 traccia automaticamente i punti di pivot giornalieri sul grafico, fornendo livelli chiave di supporto e resistenza basati sui prezzi di apertura, chiusura, massimo e minimo del giorno precedente. I punti pivot aiutano i trader a identificare potenziali aree di inversione e zone di prezzo critiche, migliorando la precisione nelle decisioni operative quotidiane."
FREE
La Bollinger BandWidth (BBW) è un indicatore di analisi tecnica derivato dall'indicatore Bande di Bollinger standard. Le Bande di Bollinger sono un indicatore di volatilità che crea una banda di tre linee tracciate in relazione al prezzo di un titolo. La linea centrale è in genere una media mobile semplice a 20 giorni. Le bande superiore e inferiore sono tipicamente 2 deviazioni standard sopra e sotto la SMA (linea centrale). La Bollinger BandWidth serve a misurare quantitativamente l'ampiezza t
FREE

The Firstdawn indicator uses Zigzag as the main signal generator.
This keeps searching for signals, making it a great indicator for scaping and identification of changes in direction, swing trading and trend trading.
The Firstdawn helps you get early signals. The backtest gives the true picture of how the indicator works with real/demo accounts.
Although this is a tiny indicator it is packed with advantageous settings that will help you whether you desire to: Snap the Peaks and Bottoms

Master Trend Trading Strategy The Master Trend Trading Strategy is a powerful and dynamic approach, harnessing the momentum of market trends with precision and clarity. Designed for traders seeking clear, actionable signals, this strategy employs intuitive arrows to identify prime entry points in both uptrends and downtrends, minimizing noise and maximizing potential gains. Sell Signal (Down Arrow) : When the trend signals a reversal from a peak, a red down arrow appears on the chart, indicating
FREE
Le Bande di Bollinger %b o Percent Bandwidth (%b) sono un indicatore derivato dall'indicatore standard delle Bande di Bollinger (BB). Le Bande di Bollinger sono un indicatore di volatilità che crea una banda di tre linee tracciate in relazione al prezzo di un titolo. La linea centrale è in genere una media mobile semplice a 20 giorni. Le bande superiore e inferiore sono tipicamente 2 deviazioni standard sopra e sotto la SMA (linea centrale). L'indicatore %b quantifica o visualizza la posizione d
FREE

The indicator visualizes market waves, like Elliott waves, but the algorithm is slightly different. Shows the current trend direction. It is recommended to use the indicator as a filter to determine the direction of the current trend and further search for entry points along the trend. On the last wave, you can turn on the display of the Fibo grid, when using entry into positions for Fibo line corrections. We recommend using the indicator on timeframes H1 and older.

The real market buy/Sell signals, you can trust.
This indicator tracks the trend strength, the market strength, the real current volume, and the price direction to give traders and investors the optimum point for entry in the form of signals. The time frames range from 5 minutes to one (1) hour chart.
Trading on higher time frames produce the best outcomes, but also do produce less frequent trades, compared to trading on lower time frames.
BERG Supertrend Indicator Developed by Berg Traders Overview The Berg Supertrend indicator is a custom technical analysis tool that helps traders identify potential trend reversals and market trends based on the Average True Range (ATR) and price movements. Designed for versatility and user-friendliness, the indicator offers a range of customization options, including notification settings for desktop, email, and mobile alerts. Key Features Supertrend Line Display : Plots dynamic trend lines
FREE

The indicator defines the buy and sell arrows with high performance and consistent results. Suitable for trend trading or following the trend. Automatic analysis of market opportunities ; Help traders earn more from their investments;
Never repaints, recalculates or backpaints signals; This is FREE demo version of the indicator and works only on "EUR USD M15" . The demo version does not work on SUFFIX OR PREFIX brokers ! Forex Trend Commander All details about the indicator here :
FREE

The indicator provides arrows and 2 moving averages
The arrows is based on T3 and only shows bullish arrows above both moving averages and vice versa - Where candle closes
The moving average shows color change based on slope
I didn't add alert because to many arrows
Suitable for any timeframe and symbol
Please test extensively in tester before purchase!
Enjoy! ----------------------
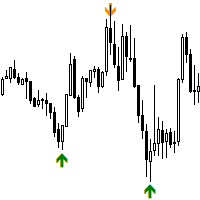
Swing Points Indicator for MetaTrader 4
The **Swing Points Indicator** is a custom-built technical tool designed for MetaTrader 5 (MT5), primarily used for identifying crucial reversal points in price action. By plotting swing highs and swing lows, it highlights potential trend reversals, making it a valuable tool for traders relying on price action analysis. This indicator helps traders anticipate changes in market direction by visually marking significant turning points on the chart.
Main
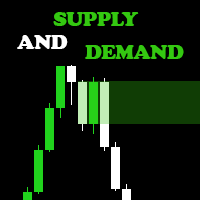
Are you ready to elevate your Forex trading game? Introducing the Supply and Demand Indicator , a powerful tool designed to help traders identify key market zones and make informed decisions with confidence! Key Features: Accurate Zone Identification : Our indicator pinpoints critical supply and demand zones, allowing you to spot potential reversal points and areas of price consolidation. User-Friendly Interface : With an intuitive design, you'll easily navigate through the settings and custom
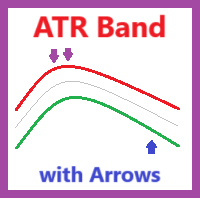
The indicator is an ATR band with 2 types of arrows
Band arrows are given when price reaches outside the band
The smaller arrows are MA crossover arrows
Arrows do repaint after refreshing or reloading chart
Not suitable for trending market, as it will give false signals!!!
Usable on any timeframe and symbol
___________________________________________________________
Please test in tester before purchase
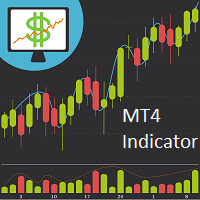
SMA Grid Visual Indicator
The SMA Grid Visual Indicator is a sophisticated, customizable tool designed for traders who want precise and actionable insights directly on their charts. This indicator uses two moving averages, a fast and a slow SMA, to identify trend directions and potential buy/sell signals, enhancing trading decisions with a visually intuitive setup. Key Features: Dynamic SMA Crossovers : The indicator utilizes Fast and Slow Simple Moving Averages (SMAs) to detect trend di

The Market Sessions indicator is a popular tool among forex and stock traders for visually representing global trading sessions on a price chart. It highlights the time periods for major trading sessions — such as the Asian (Tokyo) , European (London) , and American (New York) sessions — directly on the chart. This helps traders identify when markets open and close, allowing for better decision-making based on session-specific trading behavior. - Asian Session (Default: 00:00-09:00) - Lo

The *Intra SMC Candle* indicator analyzes *smart money concepts* (SMC) structures within the current candle. In other words, it identifies institutional action within the forming candle by tracking “footprints” of smart money through specific structures. At the start of the next candle, the indicator signals the direction in which an order should be opened.
The trade should be executed in the direction indicated by the arrow. The arrow appears at the opening of the candle, showing the direc
Very simple indicator. It shows you the order block areas. Best time frame H1 Works on all currency pairs, stocks, gold. Change the settings as desired. We recommend the default settings. Suitable for all brokers If you want it to trade automatically for you and you don't need to see the chart 24 hours a day: Message us to receive the automatic EA of this indicator.

LAUNCH PROMO: Only a few copies left at current price! Final price: 199$ https://discord.com/invite/nc43Mg7JaX WELCOME: AutoTrend uses multiple confirmation algorithms to find the best entry price and runs multiple strategies internally to spread the risk of the trades. This strategy has been tested across different pairs, using multiple pricefeeds for various brokers, nothing seems to be able to make it fail. NOTE TO USERS For guidance regarding setup, please join discord or contact me in priv
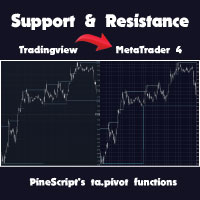
This indicator plots support and resistance levels using the equivalent of TradingView's ta.pivot functions. Said levels are updated in real time with no lag so it is Ideal for breakout strategies.
From the inputs you can set the look back and forward periods and even the source of the pivots (if from the body or wick).
The price will go up to 99 euro as soon as I sell 10 copies of the code, so take advantage of it!
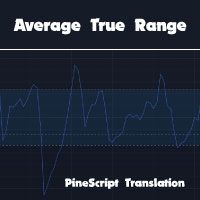
This indicator is a direct translation from the PineScript ATR. From the inputs it is possible to change the averaging period.
Knowing the weighted average of previous candles is useful for establishing take profit and stop loss levels or risk management strategies.
Price will go up to 59 euro as soon as i sell the first 10 copies so take advantage of the offer!

FX Levels, geleneksel Lighthouse yöntemini yenilikçi bir dinamik yaklaşımla birleştiren ve tüm ticaret sembollerinde kusursuz bir şekilde çalışan son derece doğru bir destek ve direnç göstergesidir. Buna döviz çiftleri, endeksler, hisse senetleri veya emtialar dahildir. FX Levels, tersine dönme noktalarını belirler ve bunları grafikte görüntüler, bu da ticaret faaliyetlerinizde kar hedefleri olarak ideal bir şekilde kullanılabilir. FX Levels'ı geliştirirken, brokerlar ve onların veri akışları i
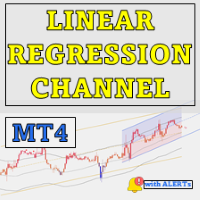
Yalnızca 4 kopya $49 – Fiyat $149'a çıkmadan önce kendinize bir tane alın! Doğrusal Regresyon Kanal Göstergesi , yatırımcılara fiyat trendlerini ve potansiyel dönüş noktalarını yakalamada yardımcı olan güçlü bir teknik analiz aracıdır. Doğrusal regresyon kanalları, bantlar ve gelecek projeksiyonlarını hesaplayıp göstererek, bu gösterge piyasa dinamikleri hakkında derin bir bakış açısı sunar. Aşırı alım ve satım durumlarını, trend yönünü belirlemeye yardımcı olur ve gelecekteki fiyat hareketleri
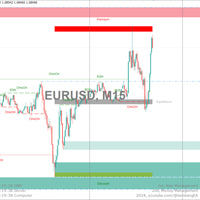
Bu hepsi bir arada gösterge, gerçek zamanlı "Piyasa Yapısı"nı (dahili ve swing BOS / CHoCH), emir bloklarını, prim ve indirim bölgelerini, eşit yüksek ve düşükleri ve çok daha fazlasını görüntüler... tüccarların grafiklerini yaygın olarak kullanılan fiyat hareketi metodolojileriyle otomatik olarak işaretlemelerine olanak tanır. Adil Değer Açığı betiğimizin yayınlanmasının ardından, topluluğumuzdan aynı kategoride daha fazla özellik yayınlamamız için çok sayıda talep aldık.
"Piyasa Yapısı", li
FREE

Reversal-Arrow: Hassas ve Güvenilir Dönüş Noktaları Tespiti (RP-ONLY) Reversal-Arrow, potansiyel trend dönüş noktalarını belirlemek için tasarlanmış gelişmiş bir göstergedir. Bu gösterge, görsel olarak anlaşılır sinyaller sunarak piyasa ortamını anlamayı kolaylaştırır, belirsizlikleri azaltır ve karar alma sürecini basitleştirir. Özellikle XAUUSD ve XAUEUR için 1, 5 ve 15 dakikalık zaman dilimlerinde optimize edilmiştir ve bu zaman dilimlerinde en yüksek performansı sağlar; ancak diğer döviz çif
FREE
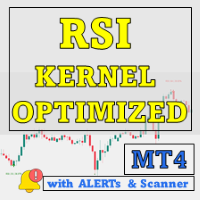
Sadece 4 kopya $49 – Fiyat $149’a çıkmadan önce hemen alın! devrim niteliğindeki RSI Kernel Optimized with Scanner’ı sunuyoruz. Bu gelişmiş araç, güçlü Çekirdek Yoğunluk Tahmin (KDE) algoritmasını entegre ederek geleneksel RSI analizini yeniden tanımlıyor. Bu gelişmiş gösterge, sadece piyasadaki trendlerle ilgili gerçek zamanlı bilgiler sağlamakla kalmaz, aynı zamanda birden fazla döviz çifti ve zaman dilimini aynı anda tarayabilen bir gösterge panosu içerir. Bu aracın neden ticaret cephaneliği
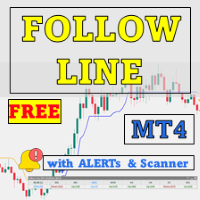
Volatiliteye dayalı gelişmiş bir gösterge olan Follow Line ve Tarayıcı ile ticaret avantajınızı en üst düzeye çıkarın. Bu araç, özelleştirilebilir ayarlarla Bollinger Bantlarının gücünü birleştirir ve fiyat hareketlerine ilişkin hassas bilgiler sunar. See more MT5 version at: Follow Line MT5 with Scanner See more products at: https://www.mql5.com/en/users/ndhsfy/seller Follow Line'ın anahtarı, fiyatın 1 standart sapmaya ayarlanmış Bollinger Bantlarının ötesine geçtiğini algılama yeteneğidir.
FREE
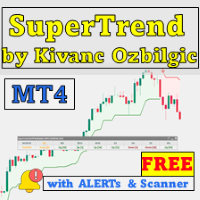
SuperTrend by Kivanc Ozbilgic with Scanner ’yi tanıtıyoruz – özelleştirilebilir özelliklere ve gerçek zamanlı uyarılara sahip, piyasa trendlerinin önünde olmanıza yardımcı olacak çok yönlü ve güçlü bir araç. Maksimum esneklik için ATR hesaplama yöntemini RMA (Göreceli Hareketli Ortalama) ve SMA (Basit Hareketli Ortalama) arasında değiştirebilirsiniz. ATR periyodu için varsayılan ayarlar 10 ve çarpan 3’tür, bu ayarlarla SuperTrend , alım ve satım sinyallerini verimli bir şekilde belirler. Entegr
FREE
Altın, petrol, döviz, kripto para için işlemlere giriş ve çıkış sinyalleri - hepsi MT4'te yeniden çizim yapmadan ve trend tahminiyle. Yeni başlayan biri bile herhangi bir zaman diliminde kolayca işlem yapabilir. Ekranda görülebilen, İngilizce duyulabilen, akıllı telefonda alınabilen sinyalleri otomatik olarak ayarlamak için esnek ve doğru algoritma.
Gösterge, kullanıcıyı eğitmek için bir ipucu sistemine sahiptir. Fare işaretçisini herhangi bir nesnenin üzerine getirin ve göreceksiniz. Bir kul
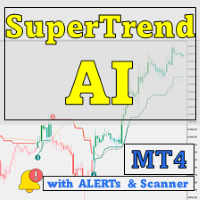
Yalnızca 5 kopya $49 – Fiyat $149'a çıkmadan önce kendinize bir tane alın! SuperTrend AI Clustering with Scanner ile yapay zekanın gücünü keşfedin, MetaTrader 4 (MT4) için devrim niteliğinde bir ticaret aracı. Bu gösterge, K-means kümeleme ile yaygın olarak kullanılan SuperTrend göstergesini birleştirerek piyasa analizini yeniden tanımlıyor ve yatırımcılara trendleri ve sinyalleri takip etme konusunda bir avantaj sağlıyor. See more MT5 version at: SuperTrend AI Clustering MT5 with Scanner See

Ultimate Trend Dashboard Ultimate Trend Dashboard, H1 zaman diliminde piyasa trendlerini tanımlamak ve vurgulamak için sezgisel renk şemaları kullanarak tasarlanmış güçlü bir MT4 göstergesidir. M30 zaman diliminde net giriş sinyalleri sağlar ve bu sinyaller gösterge panelinde bir sayı olarak görüntülenir. Bu sayı sıfıra yaklaştığında, bir uyarı tetiklenir ve böylece hiçbir ticaret fırsatını kaçı
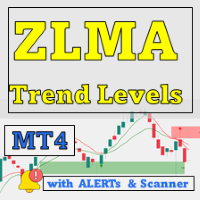
Sadece 5 kopya 49 $’a mevcut – Fiyat 149 $’a yükselmeden önce kendi kopyanızı alın! Zero Lag MA Trend Levels with Scanner indikatörü, Zero-Lag Hareketli Ortalama (ZLMA) ile standart Üstel Hareketli Ortalama (EMA) birleşimini kullanarak yatırımcılara piyasa momentumu ve kilit fiyat seviyeleri hakkında kapsamlı bir görünüm sunar. Ayrıca, tarayıcı ve uyarı işlevleri sayesinde yatırımcılar birden fazla parite ve zaman diliminde sinyalleri kolayca takip edebilir, böylece ticaret fırsatlarını tespit

MIGHTY FALCON PIPS Tanıtımı Mighty Falcon Pips, TRIX, Hareketli Ortalamalar ve Momentum’a dayalı, kolay bir alım ve satım göstergesidir. Gösterge, çıkış sinyallerini de ek olarak sunarak, potansiyel olarak yararlı ters sinyaller vermeye odaklanır. Güçlü çıkış sinyalleri, tersine dönen bir trendden zamanında çıkmanızı sağlar ve işlemlerinizi kolaylaştırır. Çıkış sinyalleri dahil tüm sinyaller ayarlanabilir; ancak yine de bunu iyi bir filtre ile (yapı temelli göstergeler gibi) kullanmanızı öneriri

Trend Osilatörü: Pürüzsüz ve Güvenilir Piyasa Trend Tanımlaması Trend Osilatörü, yatırımcıların trend yönünü ve potansiyel dönüş noktalarını doğru bir şekilde belirlemelerine yardımcı olmak için tasarlanmış, MT4 için gelişmiş bir göstergedir. Sezgisel bir görsel gösterim ile bu gösterge, piyasanın yukarı veya aşağı trendde olduğunu net bir şekilde gösterir, analizi basitleştirir ve grafiğin okunabilirliğini artırır. Çeşitli piyasalarda ve zaman dilimlerinde kullanılabilir, bu da farklı işlem iht
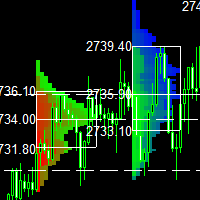
This indicator is a classic implementation of the Market Profile (Volume Profile Visible Range), allowing for the display of price density over time while highlighting the most significant price levels, the value area, and the control price within a specific trading session. MT5-version: https://www.mql5.com/en/market/product/125308 The indicator can be applied across timeframes from M1 to D1, enabling the analysis of market profiles for daily, weekly, monthly, or intraday trading. Utilizing l
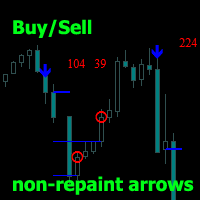
Expiry Arrows , fraktal noktalarda sinyal okları veren teknik bir göstergedir. RSI göstergelerine dayanmaktadır.
Yalnızca aşağı ok veya yalnızca yukarı ok olmak üzere iki modda çalışır. İki grafikte kullanın. Bağımsız olarak veya trend göstergeleriyle birlikte kullanılabilir.
Bağımsız olarak kullanılıyorsa, H1 veya H4 Zaman Çerçevesini açmanız, sinyal okundan sonra M5 veya M15'teki sinyali beklemeniz gerekir.
Bir mum açıldığında ve yeniden çizilmediğinde oklar görüntülenir. Sinyal oklarının g
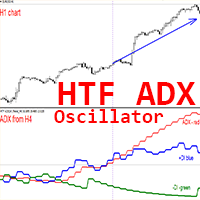
Forex Indicator HTF ADX for MT4 Upgrade your trading methods with the professional HTF ADX indicator for MT4. H TF means - H igher Time Frame ADX (red line) is used to measure trend strength - if ADX value is above 30 and has upstairs shape - trend is strong If the +DMI (blue line) is above the -DMI (green one): price is moving up, and ADX measures the strength of the uptrend If the -DMI (green line) is above the +DMI (blue one) : price is moving down, and ADX measures
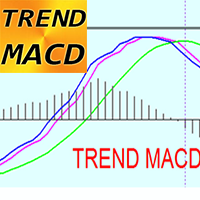
T REND MACD Indicator for MT4 - is great & efficient trading tool! This indicator is great for Trend Traders who are focused to catch big price movements TREND MACD consist of 3 lines: Green line - shows main trend direction , and Blue & Magenta lines for entry and exit. Indicator allows to maximize profit - not to exit from profitable trade too early Indicator has built-in Mobile and PC alerts
HOW TO USE indicator (see pictures): 1) Check if Blue & Magenta lines both are abo
123456789101112131415161718192021222324252627282930313233343536373839404142434445464748495051525354555657585960616263646566676869707172737475767778798081828384858687888990919293949596979899100101102103104105106107108109110111112113114115116117118119120121122123124125126127128129130131132133134135136137138139140141
MetaTrader mağazası, alım-satım robotları ve teknik göstergeler satmak için en iyi yerdir.
MetaTrader platformu için ilgi çekici bir tasarıma ve iyi bir açıklamaya sahip bir uygulama geliştirmeniz yeterlidir. Milyonlarca MetaTrader kullanıcısına sunmak için size ürününüzü Mağazada nasıl yayınlayacağınızı açıklayacağız.
Alım-satım fırsatlarını kaçırıyorsunuz:
- Ücretsiz alım-satım uygulamaları
- İşlem kopyalama için 8.000'den fazla sinyal
- Finansal piyasaları keşfetmek için ekonomik haberler
Kayıt
Giriş yap
Gizlilik ve Veri Koruma Politikasını ve MQL5.com Kullanım Şartlarını kabul edersiniz
Hesabınız yoksa, lütfen kaydolun
MQL5.com web sitesine giriş yapmak için çerezlerin kullanımına izin vermelisiniz.
Lütfen tarayıcınızda gerekli ayarı etkinleştirin, aksi takdirde giriş yapamazsınız.