Conheça o Mercado MQL5 no YouTube, assista aos vídeos tutoriais
Como comprar um robô de negociação ou indicador?
Execute seu EA na
hospedagem virtual
hospedagem virtual
Teste indicadores/robôs de negociação antes de comprá-los
Quer ganhar dinheiro no Mercado?
Como apresentar um produto para o consumidor final?
Novos Indicadores Técnicos para MetaTrader 4

Hello fellow trader, I have built this indicator by combining trend and entry mechanisms i have used for years. This is one of my high probability strategies. All calculations are done based on pure price action-based market structure. Multiple confluences are used to validate and filter entries. All calculations are done behind the scenes, and you are given only buy sell signals. Accuracy becomes higher and higher as you trade higher timeframes, also based on my experience with the technique,
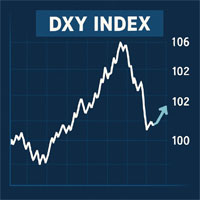
DXY Index indicator to help predict USD effect to your trade. DXY Index will help to see the power of USD.
For example if you trade XAUUSD and the DXY Index weaker, it could be the XAU will be bullish.
The same if DXY Index getting stronger, it could be that XAU will be bearish. I hope this indicator will help many trader to have better position to trade. Use this indicator wisely.

O Indicador SMC Sessions é uma ferramenta de precisão desenvolvida para traders de Smart Money que se baseiam em conceitos de TIC, busca por liquidez e estratégias baseadas em sessão . Ele mapeia perfeitamente as zonas críticas de negociação baseadas em sessão, utilizando os conceitos mais comprovados e populares utilizados por traders de nível institucional. Este indicador de sessão completo sobrepõe seu gráfico com as estratégias de intervalo mais eficazes e de alta probabilida
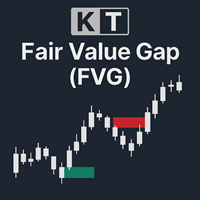
O KT Fair Value Gap (FVG) identifica e destaca zonas de desequilíbrio temporário de preço no mercado. Essas lacunas frequentemente funcionam como áreas potenciais de continuação do preço — ou, em alguns casos, de reversões (também chamadas de FVGs inversas). FVG de alta: Exibidas como caixas verdes, essas lacunas atuam como zonas de suporte onde o preço pode retomar seu movimento ascendente. Quando preenchidas, também podem se tornar pontos potenciais de reversão. FVG de baixa: Exibidas como cai

O Indicador de Estratégia de Rompimento da Sessão de Londres foi desenvolvido para traders que seguem os conceitos ICT (Inner Circle Trader) e Smart Money Concepts (SMC) , com foco em buscas por liquidez baseadas em sessões, killzones e comportamento do formador de mercado durante a sessão de Londres. Esta ferramenta captura os níveis de preço mais altos e mais baixos entre 00:00 e 07:00 GMT , comumente identificados como London Killzone ou intervalo do formado
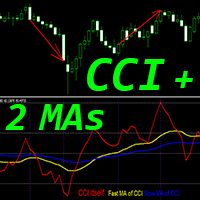
Indicador Crypto_Forex "CCI e 2 Médias Móveis" para MT4, sem repintura.
- Commodity_Channel_Index (CCI) é excelente para negociação de momentum na direção da tendência. - O indicador "CCI e 2 Médias Móveis" permite visualizar as Médias Móveis Rápidas e Lentas do indicador CCI. - Tendência de alta - Média Móvel Rápida está acima da Média Móvel Lenta; Tendência de baixa - Média Móvel Rápida está abaixo da Média Móvel Lenta. - O CCI é um dos osciladores mais populares para negociação - ele mede a
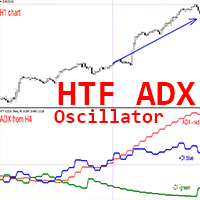
Indicador HTF ADX Crypto_Forex para MT4.
- Aprimore seus métodos de negociação com o indicador profissional HTF ADX para MT4. HTF significa - Período de Tempo Superior. - ADX (linha vermelha) é usado para medir a força da tendência - se o valor do ADX estiver acima de 20 e tiver uma forma ascendente, a tendência é forte. - Se o +DMI (linha azul) estiver acima do -DMI (linha verde): o preço está subindo e o ADX mede a força da tendência de alta. - Se o -DMI (linha verde) estiver acima do +DMI (

Indicador Crypto_Forex para MT4 com Filtro Histo Heiken Ashi - uma ótima e eficiente ferramenta auxiliar de negociação! Sem necessidade de repintura!
- Novo método de cálculo avançado - 10 opções para o parâmetro "Preço para cálculo". - Excelente para combinar com padrões de Ação de Preço: - Histograma verde - Procure padrões de alta. - Histograma magenta - Procure padrões de baixa. - Há muitas oportunidades para aprimorar até mesmo estratégias padrão com este indicador. - O indicador possui a
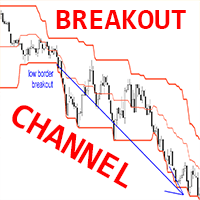
Indicador Crypto_Forex BREAKOUT CHANNEL para MT4, sem repintura.
- Este indicador pode ser usado como um sistema de negociação completo baseado em rompimentos de máximas/mínimas. - Possui apenas 1 parâmetro - PROFUNDIDADE HISTÓRICA, que reflete o número de velas consideradas pelo indicador. - Valores recomendados para o parâmetro PROFUNDIDADE HISTÓRICA: período D1 - 20 (um mês), H4 - 30 (uma semana), H1 - 24 (um dia). - O BREAKOUT CHANNEL consiste em 3 linhas: Borda Máxima - preço máximo das ú
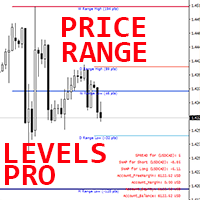
Indicador Forex "Níveis de Faixa de Preço Pro" para MT4.
- O indicador "Níveis de Faixa de Preço Pro" é uma ferramenta profissional auxiliar de negociação muito útil. - Ele mostra os níveis mais prováveis diários, semanais e mensais, que podem ser alcançados pelo preço (níveis de faixa de preço). - A faixa diária é útil para traders intradiários. - As faixas semanais e mensais são úteis para traders de Swing e de longo prazo. - O indicador é excelente para planejar suas metas de Take Profit

Indicador Crypto_Forex "RSI SPEED" para MT4 - ótima ferramenta preditiva, sem necessidade de repintura.
- O cálculo deste indicador é baseado em equações da física. O RSI SPEED é a primeira derivada do próprio RSI. - O RSI SPEED é bom para entradas de scalping na direção da tendência principal. - Use-o em combinação com um indicador de tendência adequado, por exemplo, HTF MA (como nas imagens). - O indicador RSI SPEED mostra a rapidez com que o próprio RSI muda de direção - ele é muito sensíve
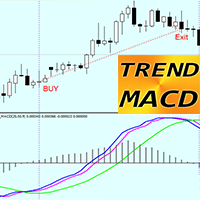
Indicador TREND MACD para MT4 - uma ferramenta de negociação excelente e eficiente!
- Este indicador é ótimo para traders de tendências que buscam captar grandes movimentos de preços. - O TREND MACD consiste em 3 linhas: Linha Verde - mostra a direção principal da tendência e as linhas Azul e Magenta para entrada e saída. - O indicador permite maximizar o lucro - evitando sair de operações lucrativas muito cedo. - O indicador possui alertas integrados para dispositivos móveis e PC.
COMO USAR
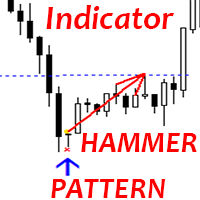
Indicador Crypto_Forex "Padrão Martelo" para MT4.
- O indicador "Padrão Martelo" é um indicador muito poderoso para negociação de Ação de Preço: Sem repintura, sem atraso. - O indicador detecta padrões de Martelo de alta no gráfico: Sinal de seta azul no gráfico (veja as imagens). - Com alertas para PC, celular e e-mail. - O indicador "Padrão Martelo" é excelente para combinar com Níveis de Suporte/Resistência.
// Excelentes robôs de negociação e indicadores estão disponíveis aqui: https://ww
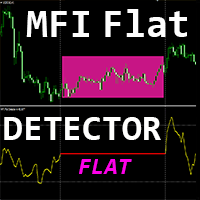
Indicador Crypto_Forex "MFI FLAT Detector" - uma ferramenta auxiliar eficiente para negociação! Sem necessidade de repintura. Eu ofereço a você a oportunidade de atualizar seus métodos de negociação com este ótimo indicador para MT4.
- O indicador mostra áreas de flat no gráfico. Ele possui o parâmetro "Sensibilidade de flat" - responsável pela detecção de flat. - O "MFI FLAT Detector" é muito útil para detecção de divergências e também é ótimo para combinar com o Price Action. - Você pode usá

O Indicador de Faixa de Nova York é uma ferramenta de análise baseada em sessão, desenvolvida para traders que aplicam os conceitos de ICT (Inner Circle Trader) , negociação Smart Money e métodos institucionais de ação de preço . Projetado especificamente para a sessão de Nova York, este indicador captura a faixa de preço entre 12h e 14h GMT , um período crítico que se sobrepõe ao Fechamento de Londres e à Abertura de Nova York . Ele identifica as máximas e mínima
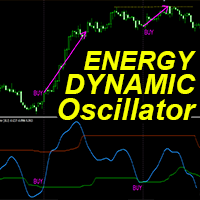
"Dynamic Energy Oscillator" - um indicador avançado e personalizado para Crypto_Forex - uma ferramenta de negociação eficiente para MT4!
- Nova geração de osciladores - veja as imagens para saber como usá-lo. - O Dynamic Energy Oscillator possui zonas adaptáveis de sobrevenda/sobrecompra. - Este é um indicador técnico de momentum muito útil em mercados de tendência. - O oscilador é uma ferramenta auxiliar para encontrar pontos de entrada exatos em áreas de sobrevenda/sobrecompra. - Valores d
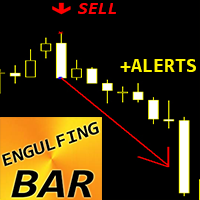
Indicador Crypto_Forex com Padrão de Barras ENGULFING para MT4.
- O indicador "Barra ENGULFING" é um indicador muito poderoso para negociação de Price Action: sem repintura, sem atraso. - O indicador detecta padrões de Barras Engulfing no gráfico: - Barra Engulfing de Alta - Sinal de seta azul no gráfico (veja as imagens). - Barra Engulfing de Baixa - Sinal de seta vermelha no gráfico (veja as imagens). - Com alertas para PC, celular e e-mail. - O indicador "Padrão de Barras ENGULFING" é excel

Este indicador foi desenvolvido para scalping agressivo e entradas rápidas em opções binárias , gerando sinais a cada vela , para que você saiba exatamente o que está acontecendo a todo momento.
Veja a operação ao vivo: https://youtu.be/QR5F_9uIb6k Junte-se ao canal Happy Scalping: https://www.mql5.com/en/channels/forexnewadvisor
Não repinta : o sinal da vela atual é gerado em TEMPO REAL , o que significa que pode mudar enquanto a vela ainda está se formando, dependendo se o preço u
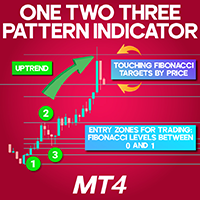
1-2-3 Pattern Indicator for MetaTrader 4
The 1-2-3 Pattern Indicator for MetaTrader 4 is a sophisticated technical tool designed to identify potential market reversals. It highlights three significant turning points, connecting them with a ZigZag pattern to visually map the price trajectory. Once the formation is complete, the indicator automatically generates Fibonacci retracement levels between the first two points to assist with trade planning. «Indicator Installation & User Guide»
MT4 Indi
FREE

Core Drift Index: Your Reliable Guide in the World of Trading Core Drift Index is an innovative trend indicator designed for precise detection of market directions and reversal points . This powerful tool enables traders to optimize their investments , minimize risk, and maximize profit. Key Features and Benefits Intuitive Trend Detection Core Drift Index clearly shows trend direction, helping traders make timely entry and exit decisions. High Probability of Success With its high accuracy
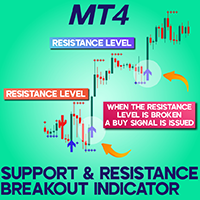
Support Resistance Breakout Indicator (SRBAI) download for MetaTrader 4
The Support Resistance Breakout Indicator (SRBAI) available for MetaTrader 4 (MT4) is designed to highlight significant pivot zones by mapping support and resistance levels on the price chart. Blue dashed lines represent support zones, while red dashed lines indicate resistance levels. Once the price breaks through a support area, the indicator generates a sell alert with a red downward-pointing arrow. Conversely, a resista
FREE

Average Daily Range (ADR) Indicator for MetaTrader 4 The Average Daily Range (ADR) Indicator for MetaTrader 4 is a vital technical analysis tool used to assess the typical price movement range an asset experience during a trading day.
By analyzing the average distance between daily highs and lows over a specified number of days, this indicator defines the ADR High (upper boundary) and ADR Low (lower boundary), helping traders identify possible support and resistance zones. «Indicator Installatio
FREE
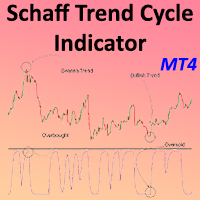
Schaff Trend Cycle Indicator for MetaTrader4 The Schaff Trend Cycle Indicator for MetaTrader4 merges the core functionalities of two widely used indicators—MACD (Moving Average Convergence Divergence) and the Stochastic Oscillator. This tool is engineered to identify trend reversals and momentum extremes with enhanced sensitivity. Readings below 25 often signal an oversold market, while values above 75 highlight overbought conditions. This makes the STC highly reliable for early trend recognitio
FREE
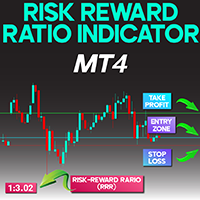
Risk Reward Indicator for MetaTrader 4
The Risk Reward Indicator for MetaTrader 4 is developed to assist traders in determining the potential risk and return of a trading position. It calculates the Risk-to-Reward Ratio (RRR) using three key levels: Entry Price (EP), Stop Loss (SL), and Take Profit (TP).
This tool graphically presents the RRR at the top-left corner of the chart and highlights the trade levels with three distinct horizontal lines:
• Green Line – Indicates the Take Profit level
•
FREE
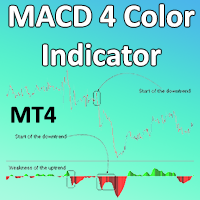
MACD 4 Color Indicator for MetaTrader 4
The MACD 4 Color Indicator for MetaTrader 4 (MACD 4C) is a refined upgrade of the traditional MACD, designed to not only indicate trend direction but also visualize the strength of the trend using four distinct color codes. These color variations are derived from the gradient of the moving average lines. It is particularly effective for identifying when a trend begins or starts to fade. The tool also incorporates divergence and convergence principles, mak
FREE
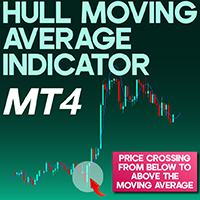
Hull Moving Average Indicator MetaTrader 4
The Hull Moving Average (Hull MA) indicator, developed by Alan Hull, is designed to minimize delay in standard moving averages and enhance responsiveness in trend evaluation. Available on the MetaTrader 4 platform, this indicator allows traders to spot short-term directional moves with greater clarity. It serves as an effective tool for identifying optimized trade entry and exit points. «Indicator Installation & User Guide»
MT4 Indicator Installation
FREE
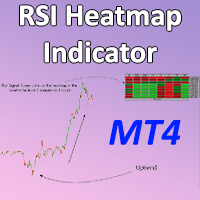
RSI Heatmap Indicator for MetaTrader4 The RSI Heatmap Indicator is a powerful technical tool in MetaTrader 4 that allows traders to assess the relative strength conditions of different currency pairs via a color-coded heatmap. By merging the Relative Strength Index (RSI) with a visual heatmap approach, this indicator simplifies market analysis by displaying strength and directional bias of multiple instruments at a glance. This indicator produces a heatmap based on calculated RSI levels across v
FREE
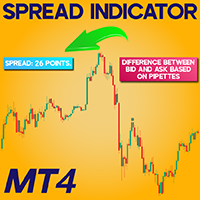
Spread Indicator download For Meta Trader 4
The Spread Indicator on MetaTrader 4 (MT4) serves to reveal the real-time gap between the Bid and Ask values. This variance, calculated in points (pipettes), appears clearly at the upper-left section of the chart window. «Indicator Installation & User Guide»
MT4 Indicator Installation | Spread Indicator Download for MT5 | ALL Products By TradingFinderLab | Best MT4 Indicator: Refined Order Block Indicator for MT4 | Best MT4 Utility: Trade
FREE
Trend detection is one of the basic challenges of every trader. Finding a way to tell when to enter a trade is very important, timing is a game changer, not too early and not too late. Sometimes, due to not knowing the market conditions, the trader closes his positions with a small profit or allows the losses to grow, these are the mistakes that novice traders make. Indicator Trend Whipper is a complete trading strategy and can improve the trader's trading process. The trend detection algorithm

Indicator defines the buy and sell arrows with high performance and consistent results . Automatic analysis of market opportunities ; Identifies a direction of a trend; Suitable for trend trading or following the trend;
This is FREE demo version of the indicator and works only on "EURUSD M5".
Forex Trend Commander full version: All details about the indicator here : Works in all symbols + free Multi Currency Scanner + free SPECIAL BONUS .
FREE
Warp Range Sensor: The Color of Your Trend Warp Range Sensor is a trend direction indicator that visually displays the current market condition by coloring bars red and blue based on trend direction. What Does Warp Range Sensor Do? Identifies the Current Trend Direction Blue bars indicate an uptrend Red bars signal a downtrend Universal Application
Compatible with all currency pairs and timeframes , from short-term scalping to long-term trading. Powered by Market Context & Historical Data
W

Rocket pro is a powerful indicator for MetaTrader 4, designed to identify the most relevant trends in the financial market. If you are looking for a tool that accurately predicts movements, Rocket pro is your ally.
Live signal: https://www.mql5.com/en/signals/2303662 How it works: This indicator combines three different methods - volume analysis, candlestick closing and symmetrical trend - to detect and signal buying and selling opportunities. Rocket pro is like a "rocket" when it detects a bu

Divergence Divergence refers to when the price of a currency pair moves in one direction while the trend indicator is moving in the opposite direction. With divergence, there can be positive and negative signals. Divergences in Forex trading are quite common signals of technical analysis. These are basic early Forex signals indicating the trend reversal and filter false signals. Application of this indicator It is usually not easy to detect divergences by the trader and it may be time-consuming
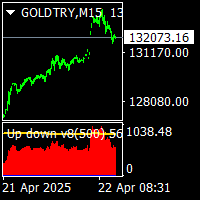
Up down v8 indicator is no repaint counter trend indicator . it try to find market up down points. it works all timeframes and all pairs. suitable for beginner and experienced trader. there is wave and c values to set defaults. minimum processed value cnt can be equal to wave value. traders can change them suitable up down points on different time frames. indicator use moving averages histograms and volatilty trigger. when red histogram is over volatility level that is tops. . when blue histogr
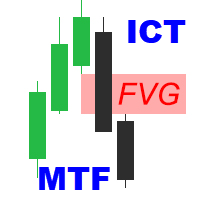
ICT Fair Value Gaps MTF Indicator Unlock the power of Fair Value Gaps (FVGs) across multiple timeframes using the ICT Fair Value Gaps Multi - Timeframe Indicator —a precision tool built for traders who follow the Smart Money Concept (SMC) . Key Features : Multi-Timeframe FVG Detection : Automatically identifies Fair Value Gaps from higher timeframes (M15, H1, H4, etc.) and plots them on your active chart for immediate insight. Break of Structure (BOS) & Change of Character (CHoCH
Convenient Dashboard for Moving Average Crossover Trading Strategy . On the panel, numbers display how many candles ago a signal occurred. The number 0 means the signal is on the current candle (it may disappear if the crossover does not hold). The number 1 means the signal was on the previous candle (arrows remain, as moving averages have confirmed the crossover). Moving averages can optionally be added, but the indicator works without them. Advantages of the indicator : Automa

Price Change Indicator Introduction The Price Change Indicator is a powerful tool designed to help traders identify significant price movements over a specified period. By calculating and visualizing percentage changes between current and historical prices, it allows traders to quickly spot potential trading opportunities when markets show unusual volatility or momentum. Features Real-time monitoring of price changes Visual histogram display when changes exceed threshold Text display showing cur
FREE
As the suggested, with this indicator you are able to switch from one symbol or timeframe to another in the same single chart. So forget about opening tons of chart on your screen! It's not designed for ICT or SMC trader, but if you are that kind of trader you still can use it. Imagine you have a strategy containing various indicators and settings, on a single chart you can screen the entry opportunity then move to the next symbol or timeframe.
FREE
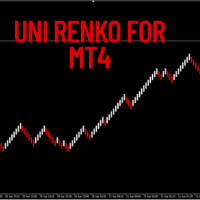
This versatile tool lets you create various Renko-style charts, including Median Renko, Mean Renko, and Traditional Renko with wicks . It offers a wide range of chart options to suit the needs of day traders, scalpers, and long-term investors.
Indicator Settings Starting Price. Box Size (in pips). Shift Percent. Timeframe Name. Show Wicks (On or Off). Amount of Bars.
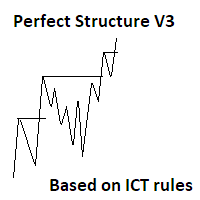
Here is the V3 of perfect structure. Whats new? (Please check added screenshots for better understanding.) 1. Coded based on ICT rules. 2. No more trend confusions...-- Added labels to show current trend 3. No more timeframe juggling and missing out important points, -- Now You can add indicator multiple times to mark multi timeframe structure on the same chart window( 1D structure on 4H or may be 4H structure on 15 min timeframe and more.....) 4. No more waiting in large range as sometimes mark
Scalping Strategy BUY SELL
Having a strategy in the market is one of the main conditions for trading. The presence of various and complicated indicators and tools sometimes makes trading difficult, and the user gets confused after trying various methods and gets stuck in a loss cycle, the result of which is usually clear. This indicator is a simple strategy based on the detection of pivots and short-term trends, which helps you to easily trade in trends. Sometimes a simple but efficient st

MACD Indicator The Moving Average Convergence and Divergence (MACD) is a trend following momentum indicator which shows the relationship between two moving averages that we chose and configure them on the indicator. The MACD is calculated by subtracting the 26-period exponential moving average and the 12 period D.A.M. These are the default parameters when you put the MACD indicator on the charts, and the period is usually 9 which means the last 9 candles. DT-Oscillator This is Robert C. Miner's
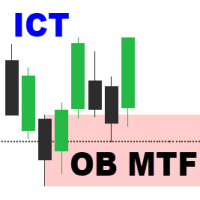
Order Block Multi Timeframe The Order Block Multi Timeframe is a powerful tool for Smart Money Concept (SMC) traders, combining high-accuracy Order Block detection with real-time Break of Structure (BOS) and Change of Character (CHoCH) analysis across multiple timeframes. Smart Money Insight, Multi-Timeframe Precision This indicator automatically identifies institutional Order Blocks —key price zones where large players have entered the market—and plots them directly on your ch

CHoCH & EQH/EQL: Market Structure and Liquidity Zones Indicator Overview: This versatile indicator is designed to help traders identify potential shifts in market structure and pinpoint key liquidity zones directly on their MetaTrader 5 charts. It automatically detects and visualizes two crucial price action concepts: Change of Character (CHoCH) for potential reversals, and Equal Highs/Lows (EQH/EQL) for significant support/resistance levels. Key Features: Change of Character (CHoCH) Detection:

Zeta Breakout Indicator MT4 is the best custom indicator we have ever created based on the best expert advisor we have ever created (The EA isn't for sale). The Zeta Breakout Indicator MT4 is a powerful trading breakout strategy custom indicator. It can help traders determine the level of breakout (support and resistance levels) simple, easily and accurately. Zeta Breakout Indicator MT4 is a custom indicator that created by MQL4 programming language that based on the results of our breakout tr

H4 scalper
The H4 scalper indicator is built specifically for the H4 timeframe and works on all currency pairs.
The H4 scalper indicator is very good for scalping.
BUY and SELL signals are given by the white and yellow circles, respectively.
Take Profit can start from a minimum of 5, 10 pips.
For this indicator to work, you need to download two indicators, Trend envelopes v2 and DSS of momentum + arrows + alerts _ mtf nmc, which you can find in the first comment.
These two indicators are

Hello fellow trader, I have built this indicator by combining trend and entry mechanisms i have used for years. This is one of my high probability strategies. All calculations are done based on pure price action-based market structure. Multiple confluences are used to validate and filter entries. All calculations are done behind the scenes, and you are given only buy sell signals. Accuracy becomes higher and higher as you trade higher timeframes, also based on my experience with the technique,

The Neural Adaptive MACD is a customized MACD indicator for MT4 that visually represents momentum strength using four color-coded histogram bars: strong bullish, bullish, strong bearish, and bearish.
It features neural adaptive signal smoothing and integrates optional real-time alerts, notifying traders of new momentum shifts along with the symbol and timeframe.
This tool enhances decision-making by highlighting trend strength and change dynamics.
Can be used any forex, crypto....
Any timefr

Simple. Informative. Instantly Visible on Your Chart. Alwinson Active Trades Info (MT4 Version) is a lightweight custom indicator that displays a real-time summary of your currently open trades —right on your chart. No more switching tabs just to see what pairs are active and how much lot size is in play.
Alwinson Active Trades Info is also available for the MetaTrader 5 (MT5) version .
Key Features: Displays a list of all symbols with open positions in your trading account. Shows th

Arrow Indicator (Buy/Sell Alerts) – Simple Yet Powerful Tool! Product Version: 1.01 Indicator Type: Trend Reversal Signals Timeframes Supported: All (Recommended: H1, H4, D1) Key Features: Buy Signal : Green upward arrow () appears below the candle Sell Signal : Red downward arrow () appears above the candle Accurate Trend Reversal Detection – Based on tried and tested SMA strategy. ️ Clean Chart View – Minimalist, non-intrusive arrow signals for easy trading. Work
FREE

Z Score Pair Trade Indicator for MT4 is a powerful statistical tool designed to help traders identify mean-reversion opportunities and overbought/oversold market conditions with precision. Based on standard deviation and mean analysis, this indicator calculates the Z-score of a selected spread, price series, or custom input to determine how far the current value deviates from its historical average.
Unlock powerful market insights with the Z Score Pair Trade Indicator — a must-have tool for tr

CDS SR Fractal Level: Enhance Your Trading Accuracy with Automatic Fractal-Based Support and Resistance Levels The CDS SR Fractal Level indicator is an advanced trading tool designed by CDS to automatically identify and visualize key Support and Resistance (SR) levels. This indicator utilizes the concept of fractals to present relevant SR levels for your trading decisions. Key Features: Automatic Fractal Level Identification: The indicator dynamically marks fractal levels as they form on the pri

The Great Oracle – Your Guide to Consistent Trend Trading Success
The Great Oracle is a powerful trend-following indicator designed for traders who seek precision in their entries and exits. Whether you’re navigating trending markets or spotting opportunities in ranging conditions, The Great Oracle provides you with accurate signals and a second chance to join strong market trends. It’s the ultimate tool for traders who want to maximize profits while keeping risks manageable.
Key Features:
•
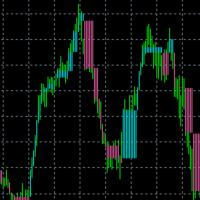
When there is no position, when changing the color, you can consider opening an order. With the fluctuation of the market, when the current color changes again, you need to close the position and leave. Suitable for different cycles, the trading rules are simple and require friends to explore on their own.
I hope friends who use this indicator can make a lot of money, rolling bigger and bigger like a snowball. thank you!
The presented indicator is an original development. The indicator gives signals to open/close a position. The indicator sensitivity can be adjusted in a literally infinite range, which allows it to be used for trading in any market. The indicator signals vary in strength depending on their consistency with the trend over three different time periods. The above indicator feature allows you to estimate the indicator signal potential in advance. Namely: If the signal is strong (coincides with the
The presented product is the author's implementation of the REI (Range Expansion Index) indicator developed by Thomas DeMark. REI Oscillator AM is an indicator that measures the rate of price change and signals overbought/oversold conditions if the price shows weakness or strength. The indicator value changes within the range from -100 to +100. Thomas DeMark suggests using the default period of 8 and the following algorithm for using the indicator: When the price rises above level 60 and then fa
FREE
One of the standard ways to determine the direction of price movement at a specific point in time is to calculate the linear regression for the values of such a price for a certain period of time. This indicator displays points on the price chart, built on the basis of the linear regression values of the selected price for the selected period of time.
The indicator also displays signals at moments of change in the direction of the calculated values of linear regression. The indicator is
FREE
The presented indicator is an original development. The indicator places two types of signals on the price chart: Signals to open a position; Signals to close a position. The indicator signals appear after the bar formation is complete and are not redrawn. The signals require confirmation, namely - the price must overcome the maximum (for buying) or minimum (for selling) of the bar on which the signal was placed. The indicator can send notifications about its signals to a mobile terminal and e-
FREE
The presented indicator is the author's implementation in the oscillator format of the classic Aroon indicator. The Aroon indicator was developed in 1995 by the Indian trader Tushar Chande. Chand's origin played a role in choosing an unusual name for the oscillator. "Aroon" is translated from Sanskrit as "Light of the morning dawn". The formula for calculating the classic Aroon indicator: Aroon-Up = ((specified number of periods) – (number of periods since the maximum was formed)) / (specified n
FREE

The presented indicator is the author's implementation of the classic Aroon indicator. The Aroon indicator was developed in 1995 by the Indian trader Tushar Chand. Chand's origin played a role in choosing an unusual name for the indicator. "Aroon" is translated from Sanskrit as "Light of the morning dawn". The formula for calculating the classic Aroon indicator: Aroon-Up = ((specified number of periods) - (number of periods since the formation of the maximum)) / (specified number of periods) * 1
FREE
The presented indicator allows you to visualize the current trend. The indicator identifies the trend using the following definition as an algorithm: A trend is a situation when each subsequent maximum price rise is higher/lower than the previous one, and similarly each subsequent maximum price fall is higher/lower than the previous one; The beginning of a new trend is considered to be when the current maximum/minimum overcomes all maximums/minimums of a specified number of previous bars. The i
FREE
The presented indicator is the author's implementation of the DMI indicator. DMI (Directional movement Index) is a directional movement index. The concept of the indicator was developed by Welles Wilder. This is a technical indicator, it is used to identify the trend direction, moments of the market exiting consolidation and to confirm potential reversal points. It is an oscillator consisting of two curves. The constituent components of the Directional Movement Index: +DI (Positive Directional
FREE

NOTE: CYCLEMAESTRO is distributed only on this website, there are no other distributors. Demo version is for reference only and is not supported. Full versione is perfectly functional and it is supported CYCLEMAESTRO , the first and only indicator of Cyclic Analysis, useful for giving signals of TRADING, BUY, SELL, STOP LOSS, ADDING. Created on the logic of Serghei Istrati and programmed by Stefano Frisetti ; CYCLEMAESTRO is not an indicator like the others, the challenge was to interpret only t
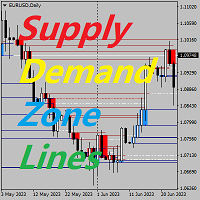
Indicadores-chave de preços da zona de oferta e demanda fundo O sistema busca automaticamente áreas de oferta e demanda na linha K e desenha linhas de preços-chave em tempo real. Os comerciantes podem negociar com base nas linhas de negociação de preços. Principais Características O sistema busca automaticamente as áreas de oferta e demanda na linha K. O sistema também desenhará linhas de preços-chave em tempo real, e os traders poderão negociar com base nas linhas de negociação de preços. Port
O indicador de Candles de Múltiplos Períodos é uma poderosa ferramenta de visualização projetada para ajudar os traders a alinhar suas análises de períodos menores com a estrutura de períodos maiores. Ao plotar candles de um período maior selecionado (H1, H4, D1, etc.) diretamente no seu gráfico atual, este indicador oferece uma perspectiva mais clara da narrativa geral do mercado sem precisar alternar entre os gráficos.
Quem precisa deste indicador? Esta ferramenta é ideal para: Conceito
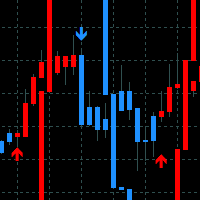
Reversal Bands - indicador concebido para análise de volatilidade e aplicação de resultados em negociações. Fornece sinais de direção do preço ao longo da tendência e nas fases iniciais de uma reversão.
Capacidades do indicador
O indicador baseia-se em linhas de velocidade construídas de acordo com os princípios de aceleração e desaceleração da volatilidade utilizando o grau de suavização. A força motriz da linha é a volatilidade, quanto maior for, mais as linhas se desviam do preço. As setas
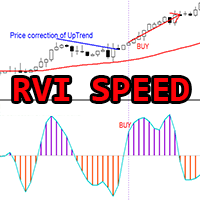
Indicador Crypto_Forex "Velocidade RVI" para MT4, sem repintura.
- O cálculo deste indicador é baseado em equações da física. A Velocidade RVI é a primeira derivada do próprio RVI. - O Índice de Vigor Relativo (RVI) é um indicador técnico de momentum muito útil em mercados de tendência. - A Velocidade RVI é boa para entradas de momentum após a correção do preço na direção da tendência principal. - Use-o em combinação com um indicador de tendência adequado, por exemplo, uma MME padrão (como nas
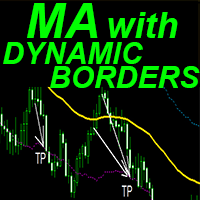
Indicador Crypto_Forex "Média Móvel com Bordas Dinâmicas" para MT4.
- O indicador possui um recurso exclusivo associado à Média Móvel - Bordas de Volatilidade Dinâmica. - As Bordas de Volatilidade Dinâmica utilizam os valores da Média da Faixa Real para cálculo. - Este indicador é ótimo para segmentação TakeProfit e arranjo de SL em linhas de borda. - O indicador também é excelente para combinar com sinais de Ação de Preço.
// Ótimos robôs de negociação e indicadores estão disponíveis aqui: h
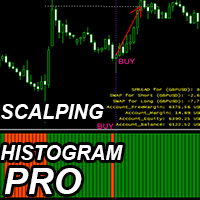
Indicador Crypto_Forex "Scalping Histogram Pro" para MT4, sem repintura.
- O indicador Scalping Histogram Pro pode ser usado para buscar sinais de entrada na direção principal do momentum do preço após pequenas correções de preço. - O Scalping Histogram Pro pode estar disponível em 2 cores: laranja para momentum de baixa e verde para momentum de alta. - Ao visualizar pelo menos 10 barras consecutivas do histograma da mesma cor, significa que ocorreu um momentum forte. - O sinal de entrada é um
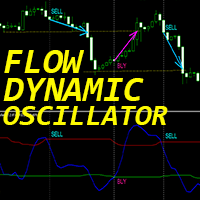
"Dynamic Flow Oscillator" - um indicador avançado e personalizado para Crypto_Forex - uma ferramenta de negociação eficiente para MT4!
- Nova geração de osciladores - veja as imagens para ver como usá-lo. - O Dynamic Flow Oscillator possui zonas de sobrevenda/sobrecompra adaptáveis. - O indicador utiliza dados de preço e volume para identificar zonas de sobrevenda e sobrecompra. - O oscilador é uma ferramenta auxiliar para encontrar pontos de entrada exatos em áreas de sobrevenda/sobrecompra.
123456789101112131415161718192021222324252627282930313233343536373839404142434445464748495051525354555657585960616263646566676869707172737475767778798081828384858687888990919293949596979899100101102103104105106107108109110111112113114115116117118119120121122123124125126127128129130131132133134135136137138139140141142143144145146147148149
O mercado MetaTrader é um espaço, sem precedentes, para negociar robôs e indicadores técnicos.
Leia o artigo Manual do usuário da MQL5.community para saber mais sobre os serviços exclusivos que oferecemos aos traders: cópia de sinais de negociação, aplicativos personalizados desenvolvidos por freelances, pagamentos automáticos através de sistema de pagamento e a rede em nuvem MQL5.
Você está perdendo oportunidades de negociação:
- Aplicativos de negociação gratuitos
- 8 000+ sinais para cópia
- Notícias econômicas para análise dos mercados financeiros
Registro
Login
Se você não tem uma conta, por favor registre-se
Para login e uso do site MQL5.com, você deve ativar o uso de cookies.
Ative esta opção no seu navegador, caso contrário você não poderá fazer login.