Conheça o Mercado MQL5 no YouTube, assista aos vídeos tutoriais
Como comprar um robô de negociação ou indicador?
Execute seu EA na
hospedagem virtual
hospedagem virtual
Teste indicadores/robôs de negociação antes de comprá-los
Quer ganhar dinheiro no Mercado?
Como apresentar um produto para o consumidor final?
Novos Indicadores Técnicos para MetaTrader 4 - 118

Hrumer Alpha - um indicador forex fundamentalmente novo, que é construído sobre o algoritmo de rastreamento dos valores de pico do preço. Este não é o ZigZag e nem o Fraclals e, apesar da semelhança visual, não tem nada a ver com esses indicadores. Ele não redesenha seus valores e trabalha a partir da barra zero, isto é, com Open [0]. Ele reage rapidamente a quaisquer alterações no preço e informa o comerciante sobre as reversões. Funciona em todos os pares de moedas e prazos. Você pode usar par
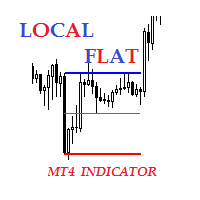
Description The indicator of local flat. The indicator allows to find local flats in the following options: Width of channels that is not more than certain number of points Width of channels that is not less than certain number of points Width of channels that is not more and not less than certain number of points The indicator displays the middle and boundaries of the channel. Attaching multiple instances of the indicator to the chart with different ranges leads to displaying a system of chann

Iterative Moving Average – IMA. IMA is obtained by correcting the usual MA. The correction consists in addition to MA averaged difference between the time series (X) and its MA, i.e. IMA(X)=MA(X) + MA ( Х -MA(X)). Correction is done in several iterations (and, exactly, 2 iterations in this indicator) and with a change in the averaging period. As a result, the time-series points begin to cluster around (on all sides) of the getting IMA and with a smaller de

Welcome all to the famous Gann's "Square Of 9"!! This method was used by one of the best traders in the history, a person who made his way among the top traders. An "Holy Grail" for whoever wants to learn trading. The "Square of 9" was used by this genius to find the market's future supports and future resistances. Nowadays is possible to find them with just a click, thanks to softwares. At the time Gann was using just his set of square and goniometer!! Gann describes, partially, the tecnique on
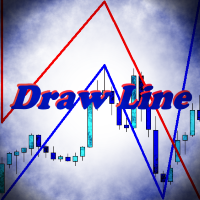
Indicator Draw Line, is a utility for drawing in the chart trend lines, connecting together and following one after another. It will be especially useful for traders who use in their trading wave analysis. Above the graph are buttons for switching the basic settings: Calling the color bar, Turning the indicator on and off, Turning the sound on and off, Clearing the chart from the created objects. With the rest of the settings will not be difficult to understand. Use your health!

A new interpretation of the classical indicator in the form of an oscillator for a more accurate representation of the situation on the market. Less lagging than the standard Alligator. All settings are fully accessible, such as the type and prices for which it is built. Thanks to the additional parameters, it became possible to fine tune.
Distinctive features Does not redraw. Additional parameters for fine tuning. Works on all timeframes and symbols. Suitable for manual trading and developmen
FREE

BeST_Darvas Boxes is an MT4 Indicator based on the trading method developed in the 50’s by the Hungarian Nicolas Darvas . BeST_Darvas Boxes indicator draws the Top and the Bottom of every Darvas Box that can be confirmed on the current Chart. draws Buy and Sell Arrows for every confirmed Upwards or Downwards Breakout of the above levels. draws always only after the bar closing and so is non-repainting or backpainting .
Note : Every customer who wants to have the older version v_1.75 with th

Price action is among the most popular trading concepts. A trader who knows how to use price action the right way can often improve his performance and his way of looking at charts significantly. However, there are still a lot of misunderstandings and half-truths circulating that confuse traders and set them up for failure. Using PA Trend Reversal will be possible to identify high probability exhaustion moves of a trend. ️ AVOID NEWS AND SPEECHES - most of the bad signals are during the news/sp
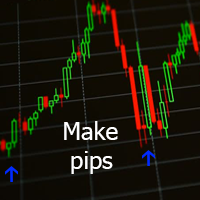
Данный индикатор отмечает участки разворота тренда, в точках разворота давая сигнал на вход в рынок в виде стрелок соответствующего цвета и направления и звукового оповещения. За расчет точек разворота отвечают классические технические индикаторы Bollinger Bands и MA . Расчет MA производится не по периоду, а по объему контракта разделённому на цены OHLC. Индикатор не перерисовывается.
Входные параметры Show Text Label - показывать текстовые метки Set Stop Loss - показывать расстояние до Stop

Indicator FiboZag - transfer the indicator to the chart and the Fibonacci levels will be built automatically on the last ZigZag turn. The main advantage lies in the correct construction of Fibonacci levels and markup of price levels. Simple, visual and effective use. The indicator is not redrawn and does not lag. Works on all currency pairs and on all timeframes.

The Flag Streamer Pattern indicator is an indicator designed to find flag and pennant patterns. When the legend finds patterns, it draws lines on the graph screen. Magenta lines represent the streamer pattern. Aqua colored patterns represent the flag pattern. You can change the pattern colors according to your request. Our Popular Products Super Oscillator HC Cross Signal Super Cross Trend Strong Trend Super Signal Parameters fs- =======Channel Trend Setting===== Channel - Channel period setting
FREE

This indicator zone indicator.Indicator displays high and low zone.
Features Green color - Shows movement on the high zone.
Red colr - Shows movement on the low zone. Yellow colr - Shows movement on the zero zone.
How to understand the status:
If the bar is higher than the yellow color line , trend is up. If the bar is lower than the yellow color line , trend is down.

Signal Arrows is an indicator that generates trade arrows. It generates trade arrows with its own algorithm. These arrows give buying and selling signals. Can be used in all pairs. Sends a signal to the user with the alert feature. The indicator certainly does not repaint.
Trade rules Enter the signal when the buy signal arrives. In order to exit from the transaction, an opposite signal must be received. It is absolutely necessary to close the operation when an opposite signal is received. The

Pro Strong Trend is an indicator that generates trend signal. It generates trend signal with its own algorithm. These arrows give buying and selling signals. The indicator certainly does not repaint. Can be used in all pairs. Sends a signal to the user with the alert feature.
Trade rules Enter the signal when the buy and sell signal arrives. Processing should only be initiated when signal warnings are received. It is absolutely necessary to close the operation when an opposite signal is receive

The Sensitive Oscillator indicator is designed to find trends. It recognizes trends with its own algorithm and changes color. Finds trends relative to the degree of sensitivity. You can use it in all time periods. You can use this indicator alone or in conjunction with other indicators suitable for your other strategies.
Transaction strategies You can do breakout strategies with this indicator. Each time you change colors, you can enter the process. You can use it in the long run by putting sto

BeST_Fibonacci Retracement Lines is an MT4 Indicator that by default is based on common Fibonacci levels but it can also draw any 3 desired levels of Retracement or Support of a trending move. It can be used to identify pullback points but also additionally as a kind of a Trailing Stop . BeST_Fibonacci Retracement Lines indicator: • by default draws 38.2%, 50% and 61.8% Retracement Levels of the current price move defined using the Highest High (HH) and Lowest Low (LL) of a desired Look Back Pe

This is the FXTraderariel F.U.E.L . It scans the market for opportunities and shows a buy or sell signal.It uses price action and VIX to find the best opportunities. Depending on the settings it and trading style, it can be used for scalping or long-term trading . The indicator can be used on every time frame , but we advise to use it on H1 and H4 . Especially if you are a novice trader. Pro Traders can also you use it for scalping in smaller timeframes (M1, M5 and M15). This indicator is not a

Все трейдеры знают, что без статистики работать нельзя и ведут статистику на бумаге или используют интернет ресурсы. Индикатор "VG-Statistics" создает статистику по истории Ваших сделок. Для правильной работы нужно выбрать нужный период в истории сделок и нажать кнопку "Развернуть" в левом углу графика, по умолчанию будут подсчитаны все сделки загруженные в ваш терминал с учетом комиссии и свопа, для подсчета например только "EURUSD" установите индикатор на график "EURUSD" и в настройках изменит
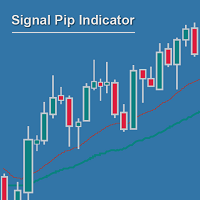
Measuring the distance between two MAs can be much more powerful and reliable than waiting for crossing MAs, and then again for confirmatory setups... If you no longer want to wait for MA crosses as being too late for good entry positions, you are right with the Signal Pip Indicator.
You are supposed to set an alarm for the distance between two MAs, fast & slow, whereas a 3rd confirmatory MA can be added as additional trigger & a fourth to filter out.
You are able to select to be alerted when t

Universal author's strategy, allows to determine the entry points for Buy and Sell both in the direction of the trend, on the reversals of trends and in the flat market. The indicator is equipped with a unique scanner which each tick analyzes the price chart, calculates optimal levels and patterns for finding entry points by one of the 3 strategies. Each of the strategies combines author formulas and algorithms, for optimal trading we recommend using 3 strategies simultaneously as they are compl
BinaryPin is an indicator developed and adapted specifically for trading short-term binary options. The indicator's algorithm, before issuing the signal, analyzes many factors, such as market volatility, searches for the PinBar pattern, calculates the probability of success when making a deal. The indicator is set in the usual way. The indicator itself consists of an information window where the name of the trading instrument is displayed, the probability of making a successful transaction, the
FREE

The Oscillators histogram indicator is designed to show the histogram of some oscillator indicators. These oscillators are RSI, Momentum, ATR and CCI indications. Our Popular Products Super Oscillator HC Cross Signal Super Cross Trend Strong Trend Super Signal Parameters Oscillators - indicator name. Period - indicator period. Level indicator - indicator level. MAPrice - applied price for Momentum, CCI or RSI. Alerts - enable/disable alerts. Email Notification - enable/disable Email notifica
FREE
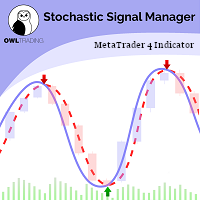
Stochastic Alert Manager Introduction: The Stochastic Alert Manager is a customizable indicator used to send alerts when trading signals occur. It also gives the user an overall idea of the tendency in all timeframes through a panel, to keep an eye on the global market behaviour. It is based on the stochastic crossovers strategy. The Stochastic Alert Manager is not meant to open trades for now. - Simple - Configurable - Respond quickly - Monitor the global behaviour How is it working? - It
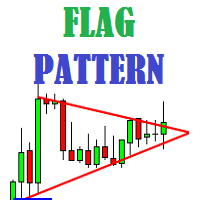
Flag Pattern indicator is an indicator designed to find flag patterns. Bullish and bear find flag patterns. It finds these patterns by its own algorithm. The display is easy to use and simple.
Features Bullish and bear find flag patterns. Draw patterns on the graphic screen. invalid flag patterns. alert the user with the alert feature. Flag patterns have the ability to change colors. Parameters MinSplashHeight - Min. height of splash setting MaxBarsDuration - Max bars before crossing setting

THE TREND IS YOUR FRIEND and I am your guide. Allow me to shed light to your surroundings in the darkness of trading. This indicator will give you the direction you need to trade with the trend. It does not require any specific settings, optimisation or curb fitting. No restrictions on symbols or time frames. It will work on metatrader 4 for any market and on all time frames. Does NOT repaint once candle closes. The Trend Qualifier is a great tool. It also helps to reduce the clutter on your c
The Channel Trade System indicator is an indicator designed to trade with channels. Only by this indicator can be done beautifully by itself. This indicator is composed of moving average and some algorithms.
Features and Suggestions The display has 4 channels. There is one main trend line. The signal line is the thick channel with magenta color. To trade, it is advisable to start with the channel line which is magenta color. A channel calculation setting of 3 to 5 is recommended. the different
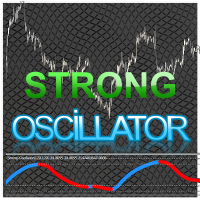
Strong Oscillator is an indicator designed to find indicator trends. It finds trends using a set of algorithms and a set of indicators.
This indicator is a trend indicator. Helps to find trends easily. You can use this indicator alone, or you can use it as an auxiliary indicator for other strategically appropriate indicators. You can use it as a trend validation indicator.
Suggestions and Features There are 4 level lines on the indicator. These level lines 5, 20 and 80 are 95 lines. 5, 20 leve

Easily and rapidly access to the average range of all the markets with "A.R. Dashboard"!! This professional multi-timeframe indicator will show you the average range of all desired markets (till 50) with one click!! Choose the number of bars to calculate the average range and this indicator will show you, automatically, this average range in points of the chosen markets for each timeframe. You'll have at your disposal two panels: AR Dashboard : Main panel. Notifications Settings : Here you can

The Auto Super Pivot indicator is an indicator designed to calculate support points and resistance points for pivot points. this indicator has the ability to calculate standard pivot, fibonacci, camarilla, woodie and demark pivot points. It also allows you to use all time zones with the time frame feature. Another feature of the indicator is the auto time slice feature. This feature allows automatic calculations without having to set any time zone.
Features 6 different pivot calculation modes A

Highly configurable CCI indicator. Features: Highly customizable alert functions (at levels, crosses, direction changes via email, push, sound, popup) Multi timeframe ability Color customization (at levels, crosses, direction changes) Linear interpolation and histogram mode options Works on strategy tester in multi timeframe mode (at weekend without ticks also) Adjustable Levels Parameters:
CCI Timeframe: You can set the current or a higher timeframes for CCI . CCI Bar Shift: you can set
FREE

This Cross Trend Signal indicator uses Donchian channel and ATR indicators. This trend tracking system uses historical data to buy and sell. This indicator does not repaint. The point at which the signal is given does not change. You can use it in all graphics. You can use it in all pairs. This indicator shows the input and output signals as arrows and alert. Open long deals on blue arrows Open short deals on red arrows When sl_tp is set to true, the indicator will send you the close long and cl

Панель предназначена для быстрого визуального нахождения и отображения внутренних баров по всем периодам и на любых выбранных валютных парах одновременно. Цвет сигнальных кнопок, указывает на направление паттерна. По клику на сигнальную кнопку, осуществляется открытие графика с данным паттерном. Отключить не используемые периоды, можно кликом по его заголовку. Имеется поиск в истории (по предыдущим барам). Прокрутка (scrolling) панели, осуществляется клавишами "UP" "DOWN" на клавиатуре. Имеется
Oscillator The Trend Signal indicator is an indicator designed to generate trend signals. It uses its own set of algorithms and the moving average indicator to find signals. It has the feature of filtering the signals with the channel system. In this way, it tries to improve the quality of the signals.
Features and Trade strategy There are two channels in the indicator. These channels are 70 and -70 channels. You will reach the signals without losing time thanks to the alarm features found on t
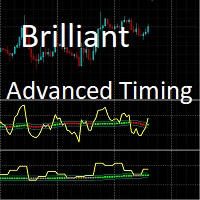
This indicator shows the Up/Down trend calculated on a specific Time Frame defined by the user.
The trend is shown in color coding for easy identification. ex: User can show the trend calculated from a Daily (D1) chart on the H4 chart. NOTE: Required Time Frame must be higher than the chart current time frame, otherwise the indicator will draw nothing. The available Moving Averages for the signal are: Simple Moving Average.
Exponential Moving Average. Smoothed Moving Average. Linear Weighted Mov
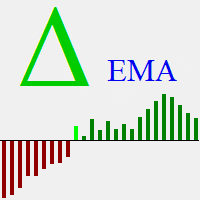
Delta EMA is a momentum indicator based on the changes of closing price from one bar to the next. It displays a histogram of the exponential moving average of those changes, showing magnitude and direction of trend. Positive delta values are displayed as green bars, and negative delta values are displayed as red bars. The transition from negative to positive delta, or from positive to negative delta, indicates trend reversal. Transition bars that exceed a user specified value are displayed in br
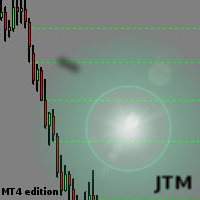
This indicator scanning thorough the history and drawing horizontal rays on all bars untested lows and highs. Fresh supply/demand zones and support/resistance levels will be marked down. It allows to be sure that certain levels is fresh and has not been tested yet. Usually after strong departure price is not retesting base immediately and leaving unfilled orders. There is no inputs, so indicator is ready to go. Version for MT5 is also available here: https://www.mql5.com/en/market/product/3084
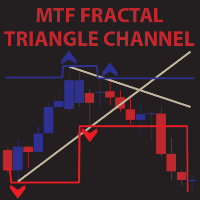
MTF Fractal Triangle Channel is a complete set of fractal indicator not just showing ascending,decending and flat fractal channel but also triangle channel with built in trend detector.It can notify you through e-mail,push alert and pop up window once it detected triangle or any kind of channel you wish for combine with trend. For example,this indicator found a new triangle channel and it wait for specific trend to alert you buy or sell.It up to you to set your own best trend.Not only that,you c

Procurando por um poderoso indicador de negociação forex que possa ajudá-lo a identificar oportunidades de negociação lucrativas com facilidade? Não procure mais do que o Beast Super Signal. Este indicador baseado em tendências fácil de usar monitora continuamente as condições do mercado, procurando por novas tendências em desenvolvimento ou aproveitando as já existentes. O Beast Super Signal dá um sinal de compra ou venda quando todas as estratégias internas se alinham e estão em 100% de conflu

Grade Day O indicador de linhas de tendência de suporte e resistência, calculado para um dia. O indicador não exibe suas leituras em um período de gráfico superior a 4 horas. Descrição das configurações color_1 - cor da terceira linha de suporte largura_1 - espessura da terceira linha de suporte style_1 - estilo da terceira linha de suporte color_4 - cor da segunda linha de suporte largura_4 - espessura da segunda linha de suporte style_4 - estilo da segunda linha de suporte color_6 - cor da p
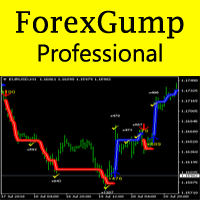
Now ForexGump has become an even more professional tool for trading on Forex. ForexGump Professional works on the strategy of following a trend. All filtering, optimization and monitoring functions of the market are built into one indicator. Fully automatic neural network algorithm with accuracy determines the direction of the price and the most effective points of opening and closing orders. All you need is to follow the instructions of ForexGump Professional. Now the indicator in a very simple

FOLLOW THE LINE GET THE FULL VERSION HERE: https://www.mql5.com/en/market/product/36024 This indicator obeys the popular maxim that: "THE TREND IS YOUR FRIEND" It paints a GREEN line for BUY and also paints a RED line for SELL. It gives alarms and alerts of all kinds. IT DOES NOT REPAINT and can be used for all currency pairs and timeframes. Yes, as easy and simple as that. Even a newbie can use it to make great and reliable trades. NB: For best results, get my other premium indicators for more
FREE
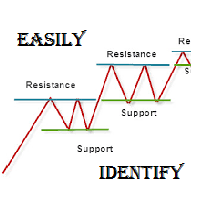
As per name Easily Identify, This Indicator is a affordable trading tool because with the help of Popular Developers & Support of M Q L Platform I have programmed this strategy. I tried to input 4 types and 3 periods of Calculation regarding Support Resistance, Furthermore, I have also care about Trend lines that Trader can easily get in touch with market in another way also. What is in for Trader?
Trading Modes: This selection is for activate whole strategy "Easily Identify" Support_R
FREE
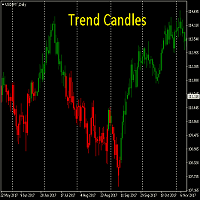
Conhecer a tendência à primeira vista.
A capacidade de ver o caminho que o mercado está indo instantaneamente.
Esta é uma obrigação para todos os comerciantes de tendência.
Funciona em todos os prazos.
Não há necessidade de otimizar Não redesenhar uma vez vela está fechado
A tendência Velas são uma ótima ferramenta para substituir velas padrão. Eles também ajudam a reduzir a desordem em suas cartas e mostrar o que você precisa ver - DIREÇÃO

Function Indicate Buy Sell Signals Indicate Strength of Buy Sell Signals This system is for both type of traders (Short & Long Term) Instead of Other Calculations, Parabolic Sar & Awesome are also used In Any time frame this can be use. What is in for Trader? Trading Switch: Short Term & Long Term Finally, we all knows that Forex Trading needs completely concentrate & proper cash management, So I never promising that my program will never give you loss but I tried well to provide good and respo
FREE
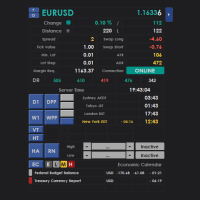
Intraday Dashboard for MetaTrader 4 - Promo 30 USD - 8 license left Intraday Dashboard consists of comprehensive data designed to only be displayed with the toggle button. A lot of trader don't like messy chart, however it does happen sometimes that trader need to look into data such as session and economic calendar to make a better decision making when trading. This indicator is solution for that particular condition, to provide market information only if needed. Features Separated button for
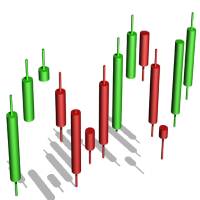
The algorithm of the Tic Tac Toe indicator differs from the usual indicators on the price charts in that it completely ignores the flow of time and reflects only changes in the price. Instead of displaying the time intervals on the X axis, and the price value on the Y axis, the Tic Tac Toe indicator displays price changes on both axes. The indicator displays in red if prices rise by a certain base value (TicTacToe) and blue if prices fall on the same value. If prices fell / rose by less than a c

This indicator scans and displays currency pairs that have recently aligned moving averages on a given timeframe. You can configure which pairs the indicator will scan. It also includes all types of alert options. Bullish MA Alignment = MA1>MA2>MA3>MA4>MA5
Bearish MA Alignment = MA1<MA2<MA3<MA4<MA5
Features Attach to one chart and scans all the currency pairs configured and visible in the Market Watch Window It can monitor all the available timeframes from M1 to MN1 and sends alerts on every

The Super Cross Trend Advanced indicator is designed for trend and signal trading. This indicator generates trend signals. It uses many algorithms and indicators to generate this signal. It tries to generate a signal from the points with the highest trend potential. This indicator is a complete trading product. This indicator does not need any additional indicators. You can only trade with this indicator. The generated signals are displayed on the graphical screen. Thanks to the alert features y

Stronger Trend is an indicator that generates trend signal. It generates trend signal with its own algorithm. These arrows give buying and selling signals. The indicator certainly does not repaint. Can be used in all pairs. Sends a signal to the user with the alert feature.
Trade rules Enter the signal when the buy and sell signal arrives. Processing should only be initiated when signal warnings are received. It is absolutely necessary to close the operation when an opposite signal is received.

ATR Accelerator Indicator informs you about strong price movements based on the ATR Indicator. This Indicator works for all Timeframes and Symbols, the strength of movements can be configured.
Important: Get informed about new Products, join our MQL Channel: https://www.mql5.com/en/channels/etradro
Useage This Indicator works for all Timeframes and Symbols, the strength of movements can be configured. Features works on all timeframes and forex pairs or indices. Alert and Notify function i
FREE
Signal Power System is an indicator that generates trade arrows. It generates trade arrows with its own algorithm. These arrows give buying and selling signals. The indicator certainly does not repaint. Can be used in all pairs. Sends a signal to the user with the alert feature.
Trade rules Enter the signal when the buy and sell signal arrives. Processing should only be initiated when signal warnings are received. It is absolutely necessary to close the operation when an opposite signal is rece

Индикатор Magneto BCS работает на основе анализа свечей. Определяет точки разворота и продолжение тренда. Основан на простой и стабильной стратегии для внутридневной и среднесрочной работы. Адаптируется к текущей волатильности инструмента.
Настройка и работа с индикатором Настройка индикатора сводится к подбору параметров Gate и Size detect . Чем больше значение Gate тем меньше сигналов. Size detect позволяет применить расчёт только к телу свечи либо к полному размеру. Кроме выделенных на граф

This indicator is designed to find the difference in RSI price and indicator. This indicator shows the price and indicator difference on the screen. The user is alerted with the alert sending feature. Our Popular Products Super Oscillator HC Cross Signal Super Cross Trend Strong Trend Super Signal
Parameters divergenceDepth - Depth of 2nd ref. point search RSI_Period - Second calculation period indAppliedPrice - Applied price of indicator indMAMethod - MA calculation method findExtInte
Highly configurable RSI indicator. Features: Highly customizable alert functions (at levels, crosses, direction changes via email, push, sound, popup) Multi timeframe ability Color customization (at levels, crosses, direction changes) Linear interpolation and histogram mode options Works on strategy tester in multi timeframe mode (at weekend without ticks also) Adjustable Levels Parameters:
RSI Timeframe: You can set the current or a higher timeframes for RSI. RSI Bar Shift: you can set t
FREE

This classic "old school" MAGIC MACD indicator gives you the cross of the parameters you set. Standart setting is (12,26,9) . The arrows give you a possible change of trend. Be careful and do not use this indicator as a single signal source.
FREE version Please feel free to check out our other REX indicator series. We do have other free indicators.
"OLD BUT GOLD"
FREE

This indicator is designed to find the difference in MOMENTUM price and indicator. This indicator shows the price and indicator difference on the screen. The user is alerted with the alert sending feature. Our Popular Products Super Oscillator HC Cross Signal Super Cross Trend Strong Trend Super Signal Parameters divergenceDepth - Depth of 2nd ref. point search Momentum_Period - Second calculation period indAppliedPrice - Applied price of indicator indMAMethod - MA calculation method findEx
FREE

Индикатор " AutoDiMA " рисует по графику в основном окне скользящую среднюю с динамическим периодом, рассчитываемым по стандартному индикатору " Average True Range (ATR) ". Когда " ATR " изменяется в диапазоне значений между верхним уровнем и нижним уровнем - тогда в заданном диапазоне меняется вариативный период скользящей средней. Принцип ускорения или замедления скользящей средней переключается в настройках параметром " FLATing ".
ВХОДНЫЕ ПАРАМЕТРЫ: - DRAWs : Количество баров для отображения
FREE
Trading System Signals is an indicator that generates trade arrows. It generates trade arrows with its own algorithm. These arrows give buying and selling signals. The indicator certainly does not repaint. Can be used in all pairs. Sends a signal to the user with the alert feature.
Trade rules Enter the signal when the buy signal arrives. In order to exit from the transaction, an opposite signal must be received. It is absolutely necessary to close the operation when an opposite signal is recei
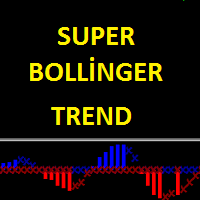
Super Bollinger Trend indicator is an oscillator designed to calculate trend points. A set of bollinger bands calculations and a set of algorithms to calculate trend reversals. Level probing system with high probability trends. All of these features combine to make it easier for investors to find trends. Prameters bollinger_Period - bollinger bands period setting bollinger_Deviations - bollinger bands deviations setting
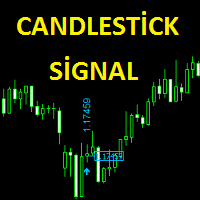
The Candlestick Signal indicator generates signals using a set of indicators and a set of candle patterns. It allows you to operate with these signals. Features
Works on any currency pairs. It works in all periods. Sensitivity setting. You can set the signal frequency. Use recommended standard settings. The greatest feature of this display is the possibility of manual martingale.
The signal intensity region tends to go in the direction of the signal. Works on all charts. Any broker. It is advi
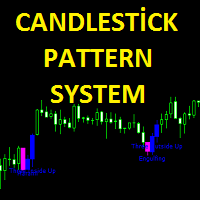
Candlestick pattern system finds 40 candle formations. Features Has the feature to send the notification. It has candlestick patterns feature. Bullish patterns feature. Bearish patterns feature. Trend filter and reliability features.
Parameters Show alert - Send alert Send email - Send alerts to mail address. Look back - Retrospective calculation === PATTERN SETUP === Show bullish patterns - Open close feature Show bearish patterns - Open close feature Trend filter - Open close feature
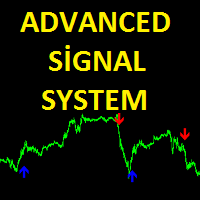
Advanced Signal System is an indicator that generates trade arrows. It generates trade arrows with its own algorithm. These arrows give buying and selling signals. Can be used in all pairs. Sends a signal to the user with the alert feature. The indicator certainly does not repaint.
Trade rules Enter the signal when the buy signal arrives. In order to exit from the transaction, an opposite signal must be received. It is absolutely necessary to close the operation when an opposite signal is rece
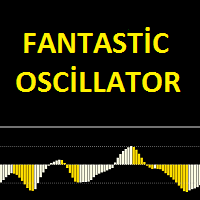
Fantastic oscillator indicator is an oscillator designed to calculate trend reversal points. A set of bar calculations and a set of algorithms to calculate trend reversals. Level probing system with high probability trends. All of these features combine to make it easier for investors to find trends.
Suggestions and Features There are two levels on the fantastic oscillator indicator. They are at levels of 0.5 and -0.5. The oscillator bar should be below -0.5 to find the upward trend. And a blue
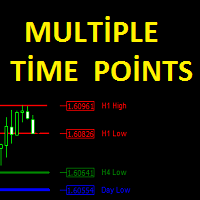
The Multiple Time Points indicator is designed to show candle high and low points. It also shows the high and low points of 4 different time periods. All graphics appear on a single graphical screen. the currently used time slots are H1, H4, D1, W1. Parameters Line style - Line style setting. H1 color - H1 color setting. H4 color - H4 color setting. Day color - D1 color setting Week color - W1 color setting. H1 width - H1 width setting. H4 width - H4 width setting. Day width - D1 width setting.
This indicator is designed to find the difference in MACD price and indicator. This indicator shows the price and indicator difference on the screen. The user is alerted with the alert sending feature. Our Popular Products Super Oscillator HC Cross Signal Super Cross Trend Strong Trend Super Signal
Parameters divergenceDepth - Depth of 2nd ref. point search Fast ema - Fast ema setting Slow ema - slow ema setting MACD sma - macd sma setting indAppliedPrice - Applied price of indicator indMAM
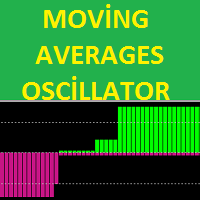
The MA's oscillator indicator is a trend indicator consisting of moving average indicators. It was formed with 4 moving average indicators. This indicator is used to find trends. It is also compatible with other indicators suitable for stretching. The indicator also has multi-time frame (MTF) capability.
Features There are two channel lines on the display. these are the channel lines 3.5 and -3.5. The 3.5 level is the overbought territory The -3.5 level is the oversold territory. The indicator

EZT_Stochastic This is a Multi Timeframe stochastic indicator, with colored background. The colored background can be set to different colors based on the K and D line, (moving up, or down), and also about the position of the lines. In the oversold or overbought zones you can choose different colors. Settings: You can choose the time-frame you want to see the stochastic. Set the regular parameters in a same way like in the original stochastic. Histogram style: The style. Histogram width: The

TREND REBORN is a non-repainting indicator that shows you the trend of the market can be used as a trend filter or a trade entry or exit BUY when indicator is blue and SELL when Indicator is Orange only The indicator can be used alone or with another indicator based on your trading strategy
Timeframe All Timeframe can be traded Currency pairs All Currency pairs can be traded
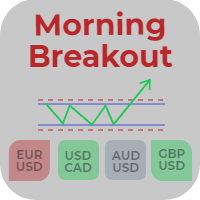
Morning Breakout is an indicator that calculates the morning range where a symbol has been moving in a period of time. It also displays that levels in the current symbol. Through this indicator you can analyze and track all the symbols you want to invest in. It also includes alerts, mails and notifications that enables the possibility to look for new market opportunities. Main Features of Morning Breakout Track all the symbols you want to invest in or the symbols in your market watch. Apply a co

Market Skanner Baks is a new indicator of market scanner. This indicator is equipped with a new algorithm for determining the trend. Now the trader does not need to analyze dozens of different indicators to determine the direction of the price movement. It is enough to place on the Market Scanner Baks chart and see where the arrow shows on the big and small timeframes. Thus, one can understand the short-term and long-term potential price movement. In addition, the indicator on the completion of
O Mercado MetaTrader oferece um local conveniente e seguro para comprar aplicativos para a plataforma MetaTrader. Faça download de versões de demonstração gratuitas de Expert Advisors e indicadores a partir do seu terminal para testes no Testador de Estratégia.
Teste os aplicativos em diferentes modos para monitoramento do desempenho e assim fazer um pagamento para o produto que você deseja, usando o sistema de pagamento MQL5.community.
Você está perdendo oportunidades de negociação:
- Aplicativos de negociação gratuitos
- 8 000+ sinais para cópia
- Notícias econômicas para análise dos mercados financeiros
Registro
Login
Se você não tem uma conta, por favor registre-se
Para login e uso do site MQL5.com, você deve ativar o uso de cookies.
Ative esta opção no seu navegador, caso contrário você não poderá fazer login.