Conheça o Mercado MQL5 no YouTube, assista aos vídeos tutoriais
Como comprar um robô de negociação ou indicador?
Execute seu EA na
hospedagem virtual
hospedagem virtual
Teste indicadores/robôs de negociação antes de comprá-los
Quer ganhar dinheiro no Mercado?
Como apresentar um produto para o consumidor final?
Novos Indicadores Técnicos para MetaTrader 4 - 68

Hi friends! Introducing the Currency Strength Indicator Currency Scanner ! The indicator tracks the strength level (percentage) of currencies The indicator allows you to create a picture of 28 currency pairs You can manually track the strength in the table. Strength is indicated as a percentage. Also on the side of the table, the recommended trading pairs will appear, on which you can perform a trading operation. This does not oblige anything and you can only cool down the tools that you need.

Important notice: Have to be installed altogether with YAHMA indicator [ https://www.mql5.com/en/market/product/66389 ]
Absolutely not as simple as SMA, however, using is still as simple as any other moving averages.
Moreover, you can be informed what is going on higher time frames, where are more important zones.
Minimalist parameter set: Higher Time Frame: (default: H1)
Period: number of calculated bars; the larger, the smoother (default: 200, minimum: 4)
MA method: use LWMA o
RSI tells you oversold and overbought levels, but how can you handle with trending markets with RSI? Solution is CFX Adaptive RSI that recalculate oversold and overbought levels according to a moving average.
Indicator parameters: - RSIPeriod: Period of RSI. - Sensibility: high value means that indicator will be more sensible to trending market. Low value means that indicator will be less sensible to trending market. - MAPeriod: Period of the moving average - TotalHistory: number of candles in

VR Cub é um indicador para obter pontos de entrada de alta qualidade. O indicador foi desenvolvido para facilitar cálculos matemáticos e simplificar a busca por pontos de entrada em uma posição. A estratégia de negociação para a qual o indicador foi escrito tem provado a sua eficácia há muitos anos. A simplicidade da estratégia de negociação é a sua grande vantagem, o que permite que até mesmo os comerciantes novatos negociem com sucesso com ela. VR Cub calcula os pontos de abertura de posição e

Candle Timer Countdown exibe o tempo restante antes que a barra atual feche e uma nova barra se forme. Ele pode ser usado para gerenciamento de tempo.
Versão MT5 aqui !
Recursos
Rastreia a hora do servidor, não a hora local Cor de texto e tamanho da fonte configuráveis Visualização opcional da variação diária do símbolo Otimizado para reduzir o uso da CPU
Parâmetros de entrada
Mostrar variação diária: verdadeiro / falso Tamanho da fonte do texto Cor do texto Se você ainda tiver dúvida
FREE

Este indicador desenhará um rótulo acima ou abaixo de cada vela com base em de Rob Smith A Strat à medida que se desenvolvem ao longo do tempo em seu gráfico.
À medida que o preço evolui, uma vela pode alternar entre três estados. Quando a vela se abrir pela primeira vez, se ela ficar completamente dentro das velas anteriores altas e baixas, ela começará como um tipo 1. Com o passar do tempo, se quebrar a máxima ou a mínima da vela anterior, será um tipo 2, e se a ação do pr

Eu criei este indicador simples enquanto estava aprendendo sobre o TheStrat de Rob Smith e o achei tão útil que pensei em compartilhá-lo com você. Se você achar útil, veja os outros indicadores que publiquei no MQL5. O indicador simplesmente desenha uma única linha no gráfico mostrando o nível de preço que você seleciona em um período de tempo mais alto. Usando as configurações, você tem controle total sobre o período de tempo exibido, mas, por padrão, ele calcula o período de tempo mais alto,
FREE
O melhor scanner Forex que já criei.
Você estará no controle de todas as 28 operações de câmbio com um único clique.
Com este indicador, você terá controle total sobre sua negociação Forex,
Você poderá ver o que acontece em todas as 28 casas de câmbio ao mesmo tempo.
RSI
ATR
MÉDIA EM MOVIMENTO
ESTOCÁSTICO
MACD
Este scanner, com base no indicador que você escolher, mostrará se os mercados estão em alta ou em baixa.
Você mesmo poderá escolher os valores de cada ind
FREE

FTFC refere-se a Full Timeframe Continuity, conforme definido por Rob Smith's The Strat . Este indicador desenha duas linhas no gráfico, uma das mais altas dos níveis de abertura Trimestral, Mensal, Semanal, Diário ou Horário, e a segunda do mais baixo desses valores. Isso fornece um canal acima ou abaixo do qual é mais provável que a negociação seja muito forte em uma direção. Entre as linhas, a ação do preço será mais instável e você poderá usar paradas mais amplas. Uma terceira linha trac

There is a very simple and surprisingly effective indicator called Pi Cycle, which starts to give the first warning. It is worth a look, so as not to miss the giant elephant in the living room!))
What is Pi Cycle?
Pi Cycle is a very simple indicator created by analyst Philip Swift . It takes into account two (DMA biased moving averages ): 350-day average x 2 111-day average Both can be considered long-term indicators. The second one is obviously more sensitive to current market changes, sin
FREE
O Lord Info é um indicador para mercado financeiro sobre a plataforma META TRADER 4. Você pode colocar o Lord Info em qualquer par de ação/moeda em sua plataforma. O Lord Info é capaz de nós mostrar o relatório ATR dos últimos (10) dias ou configurável, onde podemos ver a base volatilidade do par, e de sua decorrência. O intervalo verdadeiro médio (ATR) é um indicador de volatilidade do mercado usado em análises técnicas. É tipicamente derivado da média móvel simples de 14 dias de uma série de i
FREE

Ranging Market Detector scans the market for momentum and price to check whether the price is range- bound and the direction to which it will breakout. It works with all the all assets and visually shows you the instances when the market is either ranging or trending. Informs when the price has finished a retracement, an opportune time to re-enter the trend early. This will help you in position management. It works very well for Scalping, Day trading, and Swing trading. Helpful in all timefra
O Signal complex Atlon é um sistema de negociação pronto para uso que envia sinais na forma de setas para e-mail e notificações push para o seu telefone. Atlon também exibe níveis de TP prontos na forma de quadrados vermelhos.
O sistema funciona em qualquer gráfico (pares de moedas, ações, criptomoedas, metais, petróleo).
Cronograma H1. O sistema não é redesenhado e as setas não desaparecem em lugar nenhum.
O conjunto inclui configurações prontas que devem ser carregadas antes de instalar
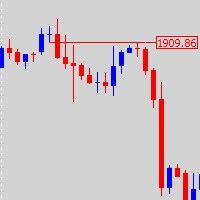
This is a combine that combines the ATR, Candle Timer, Watermark indicators and a tool for working with graphical objects, which allows you to reduce the time for marking charts. Functionality: Levels and proteins with price tags; drawing strictly horizontal levels; continuous zigzag manually; expansion / truncation of lines, wrinkles; quick change of colors and fonts and shapes; Filling/removing the filling of vessels, triangles, ellipses; dragging by 1 (first) point and auto alignment of the h
FREE
Super Trend Pro Its simple. as you see in product picture you can find out how it work. We Use Several MA and use Statistics and Probability inside the code to draw nice, great and pure Trend Detection. Do you like it? Yes me too Here, Super trend pro with 100% non-repainting indicator
Input Parameter is clear and simple.
Inputs Period 1 --------------------------->>>> Use for mathematical calculating
Period 2 --------------------------->>>> MA Period
Indicator Type ------------------->>>>
FREE
Please read before you purchase : - We don't have buyer's detail when purchase was made. In order to get the bonuses, you need to contact me via product comment ( not product review). That way I will contact you back via mql message asking for email. - Please make sure you enable receiving message from non-friend list, otherwise I cannot message you for email. This indicator is not just about Smart Money Concept, with lots of features which I believe could help you understand the concept. Not on

This indicator will draw patterns based on Rob Smith's The Strat as they emerge in real time on your chart.
As price evolves, TheStrat offers 18 distinct price action patterns that can help you get good entries in the market. Each pattern involves two or three candles, and this indicator will draw a bounding box around the candles and name the pattern. The indicator also shows when a potential setup is forming, known by stratters as an Actionable signal.
Candles
Each candle is defined by i

Reversal Prices is an indicator that has a fairly powerful and effective mechanism for adapting to changing market conditions. Reversal Prices - the new word in trend detection! With the development of information technology and a large number of participants, financial markets are less and less amenable to analysis by outdated indicators. Conventional technical analysis tools, such as the Moving Average or Stochastic, in their pure form are not able to determine the direction of the trend or it

Smart Channel is a non-redrawing channel indicator based on moving averages. The indicator is used to identify trends in financial markets and indicates the direction of price movement.
Smart Channel, in fact, is a miniature trading strategy, since, regardless of the construction methods, it uses the tactics of rebounding from the boundaries of the built channel, and the boundaries themselves are used as guidelines for the correct placement of stop loss and take profit orders.
The key diffe

This indicator draws the prior Highs and Lows for multiple timeframes, and can display potential Take Profit and Stop Loss levels. In Rob Smith's # The Strat terms, these are potential entry points, or alternatively potential targets for open positions. I like to use them in both ways. On a lower timeframe, say 5 minutes to get a good entry on a daily or weekly level, and then as a potential target. Very small stops required giving an excellent risk/reward ratio. Please watch the DEMO video
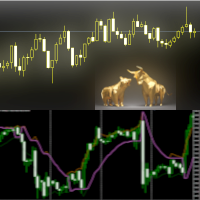
The Trends Change indicator can be used as an anticipator of the next trend, preferably confirmed by Price Action or another oscillator (RSi, Stochastic ..).
Great tool for indices, currencies and commodities.
It works on every timeframe.
Parameters
Range : setting to determine the speed of the indicator
Line_Up : higher RSI value
Line_Down : lower RSI value
Show_Bands : if TRUE shows RSI lines
MaxBars : analyzed bars
Change_Alert : pop-up alert Send App Notification: send
Big changes in prices (dips) can be opportunity for entering trend reversal trades. Dip histogram shows these big price movements. User can define minimal movement in %, as well as timeframe which will be used for calculation of price movement. Dip histogram input settings: Dip period - timeframe which will be used for price change calculation Price to compare - price type to compare Indication method - percent (alert when price movent is > min. dip in %) / Dip MA (alert when price movement

Advanced Trend Breaker Free Dashboard!!! Advanced Trend Breaker DashBoard: https://www.mql5.com/en/market/product/66336 Breaker's smart algorithm detects the trend,Support and resistance, filters out market noise and find entry signals!!! Test the demo version and explore its features, it would be useful tool added to your trading arsenal. Do not foget down load Free DashBoard!!! Advanced Trend Breaker DashBoard !!!
Advantages You Get Easy, visual and effective trend detection. Support a

This Dashboard is free to download but is dependent on you owning the Advanced Trend Breaker . Get the indicator here: https://www.mql5.com/en/market/product/66335
The Dashboard will show you on a single chart all the timeframes (M1 to Monthly) with their own status for the indicator: Advanced Trend Breaker
all time frame and all symbol: smart algorithm detects the trend,Support and resistance, filters out market noise and find breaker of entry signals!!!
!!!
How to unders
FREE

This is a Bot which send notifications every hour at your MT4 platform. The notification consists of four part. <<Clock>> + Your Message + Symbols + profit + Total # of Orders + Total profit Here is an example : 21:00 Hodor: #US30 $+40.31 GOLD $-5.31 Total 5 Orders $+35.00 If there is no order : 21:00 Hodor: HODOR signals: https://www.mql5.com/en/signals/977796
There is a private message parameter where you can enter your own message also. Hodor_Comment_OnOff_Flag removes the "Hodor
FREE
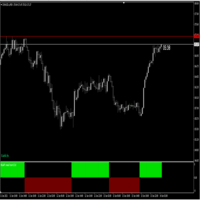
Follow Trend indicator , indicator works on Currencies , Indices ,Stocks Gold etc , good for follwoing trend on the markets suitable for scalping Buy Rules; When the histo changes to Blue you place buy order ,stop loss just below the previous swing low Sell Rules; When the histo changes to Red you place sell order ,stop loss just below the previous swing high Trade on a timeframe which best suits your trading style

Аттракцион невиданной щедрости - треть цены!
Индикатор отображает на графике другой популярный индикатор XO, представленный на рисунке в подвале. Важно! Сигнальным является 0 бар - не перекрашивается! Параметры индикатора: Zone Range (Pips) - размер зоны в пипсах без учета количества знаков; Line or Histogram Width - ширина линий или гистограммы; Zone Draw Type - способ отрисовки зон: в виде гистограммы или линий на графике; Up Zone Color - цвет зоны BUY; Down Zone Color - цвет з
CFF Bounced Trader Signals This is the most accurate reversal indicator for MT4 providing accurate signals to enter a trade without redrawing or delays. It can be applied to: commodities Only. The best results are on the timeframe M5+
IMPORTANT! Contact me after your purchase to get the detailed guide.
Benefits of CFF Bounced Trader Signals indicator
Entry signals without repainting or delays If a signal appears and is confirmed (if the signal candle is closed), it does NOT

This is a powerful indicator that is very easy to work with. Its default setting is for the euro-dollar pair, but with the right settings it can be used in all markets and all time frames less than daily. The basis of the work of the Ranging indicator is to find areas of price range and get signals from it. You can specify the duration of the valid sufferings and the minimum and maximum price in it. It is also possible to determine the number of reliable signals received from each range.
Othe

Introducing the Trend Detection System: Your Key to Unveiling Market Trends with Precision.
The Trend Detection System is a sophisticated MetaTrader 4 indicator meticulously engineered to equip traders with the tools needed to identify and ride market trends effectively. Built upon customized Moving Average principles, this innovative indicator offers unparalleled flexibility and accuracy in trend analysis.
Key Features: 1. Customized Moving Average: The Trend Detection System allows users t

Indotrend is a Smart indicator to detects the Trend and also view support & resistance, multiple timeframe to get validate the trend. it can be use for Forex,Index,Metal,Stock and Crypto. Parameters: Alerts - show popup alert message on Metatrader Hi Lo H1 Timeframe - Show LIne Hi/Low Price base on H1 timeframe Show Fibonaci level - Show Fibonaci retracement level
Show Support Resistance, - Show Support & Resistance H1 timeframe.
FREE

As simple to use it as any other moving averages, e.g. SMA , follows the trend and filters out the noise. Minimalist parameter set: Period: number of calculated bars; the larger, the smoother (default: 63, minimum: 4)
MA method: use LWMA or EMA (default: EMA)
Price: applied price (default: Typical)
Shift: shift right for prediction purpose (default: 0)
Although moving averages are fundamental to many technical analysis strategies, you ought to combine it
FREE

This indicator has two objects, a Lime and Red Point. This indicator takes and combines several built-in indicator functions / requirements and creates more conditions Lime indicates an uptrend and a red downtrend. This indicator reads the total rates in all timeframes and displays the amount in the comment. The likelihood of a correct prediction increases when two dots of the same color are close together. Thank you for visiting, good luck

Indicador de detecção de blocos de pedidos de multi-timeframe MT4.
Características
- Totalmente personalizável no painel de controle do gráfico, fornece interação completa.
- Oculte e mostre o painel de controle onde quiser.
- Detectar OBs em vários períodos de tempo.
- Selecione a quantidade de OBs para exibir.
- Interface de usuário de OBs diferente.
- Filtros diferentes em OBs.
- Alerta de proximidade OB.
- Linhas ADR de alta e baixa.
- Serviço de notificação (alertas de

Indicador de detecção MT4 Multi-timeframe Divergence e Overbougt / Oversold.
Características
- Totalmente personalizável no painel de controle do gráfico, fornece interação completa.
- Oculte e mostre o painel de controle onde quiser.
- Informação em tempo real sobre divergências não capitalizadas.
- Informações em tempo real sobre situações de sobrecompra / sobrevenda.
- Informações em tempo real sobre divergências regulares.
- Informações em tempo real sobre divergências ocu

Modified oscillator MACD. A classic indicator that combines a trend indicator with an oscillator to detect entry points. Has a multi-timeframe panel and 3 types of notifications
Benefits:
Works on all instruments and timeseries Trend indicator with oscillator for inputs Multi-period panel on all timeframes Pluggable arrows when signals appear Three types of notifications: push, email, alert
MT5 version -> HERE / Our news -> HERE
How the indicator works:
AW Classic MACD - Indicato
FREE
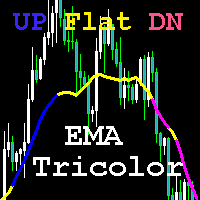
O indicador compara com a constante Difer a diferença ClosePrice entre o ponto de deslocamento Point1 e Bar1 (a última barra fechada). Se o valor for positivo e exceder Difer, então a linha Azul é desenhada, que corresponde à tendência UP. Se o valor for negativo e exceder Difer, é desenhada a linha Magenta, que corresponde à tendência DN. A ausência de tendência (Flat) é indicada pela cor amarela. Você também pode negociar cruzando a MA rápida e lenta. Esta opção é preferível para escalpela
THEQ HAG Indicator. ________________________________________________________________________________________________________________________ - O indicador THEQ HAG tem um algoritmo matemático de maximização de lucro e minimização de perdas exibindo sinais. - Negociar com a tendência com sinais e sinais de alerta de take profit. - Esse indicador nunca recalcula, pinta novamente, pinta novamente ou atrasa depois que a barra é fechada. - Todos os prazos e pares de moedas.
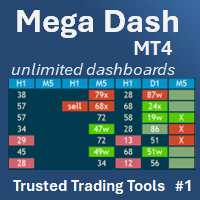
Create Unlimited Dashboards Each dashboard can be upto 28 Symbols x 24 Indicators. Mix and match from 23 leading indicators and all timeframes, to create unlimited unique dashboards. Create Group Alerts to be alerted when your chosen indicators are all aligned.
32 customizable trading strategy alerts (Trend, Breakout, Overbought, Oversold, Thresholds, Saucers etc). Scalper, Day or Long Term Trader? Mega Dash has you covered, design your dashboard to suit your trading style. Mega Dash is proba

Este indicador de desenho de linha de tendência automática exclusivo funciona em todos os intervalos de tempo, o que pode ajudá-lo a negociar facilmente reversões de tendência de curto prazo, bem como rompimentos de tendência de curto prazo, indicando o ativo mais forte no mercado. Ele permite que você entre CEDO para balanços pesados. As entradas incluem:
- Max Candles Look Back for Trend Lines
- Tipo e cor da linha
- Distância máxima para a banda externa e período da banda
- Opções para

The swing continuation pattern happens in a trend direction after a short reversal / pull back . As the name suggests , these patterns occurs along the swing high and swing lows of a trend , this makes the patterns very low risk patterns with potential high rewards . The swing continuation indicator also combines Currency Meter as a filter for its execution. The idea is to go with both the price trend flow and currency trend flow. Which means the price action must be supported by the currency st

World Trend is a hybrid trend indicator, as it is based on the signals of elementary indicators and a special algorithm for analysis. The indicator shows favorable moments for entering the market. The intelligent algorithm of the indicator determines the trend, filters out market noise and generates entry signals.
You can use the indicator as the main one to determine the trend. The indicator can work both for entry points and as a filter. Uses two options for settings. The indicator uses col

The Generic Trend indicator is a trend type indicator. It smooths out price fluctuations when generating a signal by averaging the data and the signal only at certain moments! In those moments when you need to make a decision to enter a position and give the trader a direction. The indicator gives the trader the opportunity to visually determine which trend will be present at a particular time interval.
This indicator was created to quickly determine the situation in the market, reflect the s

O indicador Fúria foi desenvolvido para trabalhar quando o mercado estiver em tendência, ou seja, raramente você verá algum sinal em zonas de consolidação. Pode ser usado tanto para Forex quanto para Opções Binárias. Os sinais plotados no gráfico não repintam nem recalculam, ainda que você feche e abra novamente seu MT4/MT5 eles estarão lá. Aguarde o sinal fixar na vela para poder fazer sua entrada na vela seguinte.
=======================================================
* BUFFERS: 0 (CALL)
These are ideal entry points for quality The tool is quite easy to set up and use. The best options are set by default The tool was developed for the forex market ( it was also decided to test it on binary options and there is also a good result) The tool is suitable for both beginners and experienced traders and will be a great addition to your trading system or will become the basis for it Settings are just one parameter Perion Chanel = 1.0 This parameter filters out market noises and false le

The new Analytical Concentration leading trend indicator uses adaptive anti-aliasing. It allows you to enter the market early. Indicator of a sharp turn to a dynamic change of direction. The Analytical Concentration indicator gives the trader the ability to visually determine which trend will be present at a particular time interval. An indicator that has a sufficiently powerful and effective mechanism for adapting to changing market conditions.
A new word in trend detection! It smooths out p

Free scanner available here: https://abiroid.com/product/abiroid-ema-scalper
Basic Strategy: 1: MA Crossover Up/Down Arrow (Mandatory Check) Optional Checks: 2: If NRTR Check On (Optional): For BUY: Check if NRTR blue and For SELL: NRTR Red If NRTR Shadow Distance On (Optional): Check price for 'x' bars back: at Shadow distance (ATR Multiplier distance) from NRTR line. 3: If High Volume bar On: Check if High Volume or if Medium (if on) Volume bar 'x' bars back 4: If HTF Trend Align On (Option

Time Session OPEN-HIGH-LOW-CLOSE This Indicator Will Draw Lines Of OHLC Levels Of Time Session Defined By User. It Will Plot Floating Lines On Current Day Chart. Time Session Can Of Current Day Or Previous Day. You Can Plot Multiple Session Lines By Giving Unique ID To Each Session. It Can Even Show Historical Levels Of Time Session Selected By User On Chart To Do Backdating Test. You Can Write Text To Describe The Lines.
FREE

This is a professional Trend Sim indicator. The intelligent algorithm of the Trend Sim indicator accurately detects the trend, filters out market noise and generates input signals and exit levels. Functions with advanced statistical calculation rules improve the overall performance of this indicator.
The indicator displays signals in a simple and accessible form in the form of arrows (when to buy and when to sell). Knowing the entry point of each of the currencies is very important for every

The Trend Line indicator shows the potential trend direction based on the cyclical-wave dependence. The Trend Line can be used as the direction of potential market movement.
Thus, all rays of the intersection will be optimal rays in the direction of which the price is expected to move, taking into account the indicator period. But do not forget that the approach must be complex, the indicator signals require additional information to enter the market.

The Supernatural channel is determined using a special algorithm, marker points are used to determine the movement of the channel. The Supernatural channel consists of two lines, red and blue, that make up the channel. Simple, visual and efficient use. Can be used for intra-channel trading. The indicator does not redraw and does not lag. Works on all currency pairs and on all timeframes.

The Oscillator Trend indicators are most useful in identifying trend decay. Nobody canceled the divergence. Correct use of this signal will give you a certain head start in the market. When working in flat. The principle of operation of the oscillator is based on the measurement of fluctuations. The indicator tries to determine the maximum or minimum of the next swing - an exit from the overbought and oversold zones. Do not forget that these signals are most interesting at the borders of the fl
The signal indicator WITHOUT REDRAWING gives recommendations for the direction of trading.
When the price moves through the internal channel, it gives signals (red and blue arrows), recommending a possible change in the direction of the price movement up or down.
When the price crosses the external channel, it gives signals (yellow arrows), warning that a strong price movement is possible, which will not immediately turn the trading direction. When the price crosses the average, it is possi

Indicator of fractals with adjustable indents. Designed according to an original simplified algorithm for use in EA.
The main ones in the indicator are lines showing the levels of the current fractals, which allows you to read the values of the last fractal in one operation.
It works on a closed bar, so it does not redraw and does not load the terminal with calculations.
It should be understood that the indicator is late with the detection of the fractal by the number of bars on the r

Trend indicator based on a combination of moving averages.
Symbols : BTCUSD, GBJPJPY, GOLD, GBPUSD Timframes M5-H4
The main advantage: an additional algorithm of auto-optimization. The indicator can adjust its parameters for any financial instrument and any timeframe.
During auto-optimization, the indicator calculates tens of thousands of combinations and finds the one that gives the best series of profitable trades. The best parameters are set by default
Indicator settings can

An indicator for BUYs only, it is good to trade into the Crypto market and Indices or Stocks, for spot trader (non-leverage / 1-1) it is good to buy and hold for long-term and you can also use it to scalp on smaller time-frame if you receive a buy signal on higher time-frame, basically look for buys on smaller time-frame then, it purely depends on how you approach your trade, some people would take a top-down approach before taking a trade, and for leveraged trader it would be good to place stop

CPR Pivot Lines It Will Draw Pivot Point R1,R2,R3 S1,S2,S3 Tc Bc Best Part Is That You Can Even Add Values Of High,Low,Close Manually Also To Get Your All Levels On Chart. So If Your Broker Data Of High ,Low ,Close Is Incorrect Then You Don’t Have To Depend On Them Anymore. You Can Even Modify All Lines Style. It Will Show Line In Floating Style And Not Continues Mess.
FREE

FX Flow indicator can be used as an anticipator of the next trend, preferably confirmed by Price Action or another oscillator (RSi, Stochastic ..).
It takes the money flows of the major currencies USD EUR GBP AUD NZD CAD CHF JPY into account, and processes them. Excellent tool for indices, but also for correlations between currencies. Works on each timeframes.
Blue line: Bull market Yellow line: Bear market
Note : if the indicator opens the window, but does not draw lines, load the histo

Lisek Stochastic oscillator indicator with Alarm, Push Notifications and e-mail Notifications. The Stochastic indicator is a momentum indicator that shows you how strong or weak the current trend is. It helps you identify overbought and oversold market conditions within a trend. The Stochastic indicator is lagging indicator, which means it don't predict where price is going, it is only providing data on where price has been !!!
How to trade with Stochastic indicator: Trend following: As lon
FREE
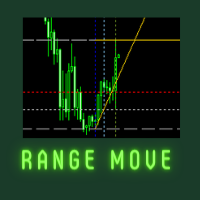
Welcome to Range Move Indicator page This indicator is suitable for Multitime frame and working with any pair including gold and silver pattern also. Very simple and profitable indicator forever. Buy open: when the candle break above the break line 100% sure buy call has open and buy tp line formed in yellow color. Sell open: when the candle break below the break line 100% sure sell call has open and sell tp line formed in yellow color.
FREE
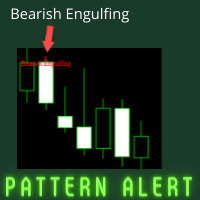
Welcome to pattern alert indicator page. This indicator designed for alerting purpose of Bullish and Bearish engulfing pattern alert. This stuff is suitable for 1 hour, 4 hour and 1 day time frame. high winning ratio is tested. Buy Alert: when the bullish engulfing pattern alert is noticed. Sell Alert: when the bearish engulfing pattern alert is noticed. See the attached screenshots for more clarity. Happy trading !!! Open Account (Get $15 cash back for each and every 1 lot trades has done) : ht
FREE

Instant Trend Line this indicator has been designed for multi time frame
Buy Call: When the Blue Moving average (MA) line crossed above the Red Moving average (MA) . Sell Call: When the Blue Moving average (MA) line crossed below the Red Moving average (MA) .
Happy and profitable trade for ever!!! this indicator is suitable for all time frame, but our recommended time frame is above 15 min chart. Suitable to all the forex chart
FREE
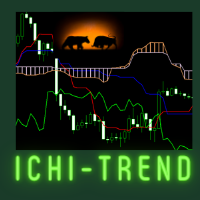
Welcome to our page This indicator is suitable for any time frame but our recommended time frames are 30M and above. Perfectly working with all pairs. Buy Call: When the candle has been crossed above the ichi cloud. (See the Screenshot Attachment) Sell Call: When the candle has been crossed below the ichi cloud. (See the Screenshot Attachment) Happy and profitable trade !!!
FREE

Step force index is a modified version of the famous force index indicator. As the name suggests it incorporates a step feature to filter the force index values thus eliminating small fluctuations in the indicator. It also utilizes the smooth algorithm library thereby providing multiple smoothing options for the index values. This personal implementation makes it a more easy to use and a reliable tool. Main features A wide range of parameters for signals optimization Alerts, emails and push noti
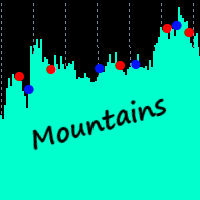
Visual helper for spotting peaks and troughs. Alerts. PSar settings for trend direction determination. Great for scalping. How to use: Simply attach to any chart. To spot peaks and troughs, zoom chart out completely. Sell on red dots. Best results when red dot appears on 3 or more time frames. Buy on blue dots. Best results when blue dot appears on 3 or more time frames. If used on lower timeframes (M1, M5, M15, M30), please make sure to check higher timeframes. Or backtest and use as you see fi
Новая серия индикаторов Veles Dynamic. Индикаторы не перерисовывают своих значений.
Эти индикаторы работают быстрее и точнее аналогичных по названию.
Индикатор Veles_dMA_Plus представляет собой динамическую МА, рассчитанную по текущим ценам инструмента.
Имеется возможность динамического сглаживания линии. Есть возможность отображения текущего трендового канала с изменением его волатильности.
Параметры: period - период динамической МА price - применяемая цена shift - сдвиг МА влево от
Новая серия индикаторов Veles Dynamic. Индикаторы не перерисовывают своих значений.
Эти индикаторы работают быстрее и точнее аналогичных по названию.
Индикатор Veles_dMACD представляет собой разницу показаний между двух динамических МА, рассчитанных по текущим ценам инструмента.
Хорошо показывает разворотные моменты, позволяет точно определять дивергенции. Имеет цветовое сопровождение изменения показаний.
Параметры: period_Fast - период быстрой динамической МА period_Slow - период
Новая серия индикаторов Veles Dynamic. Индикаторы не перерисовывают своих значений.
Эти индикаторы работают быстрее и точнее аналогичных по названию.
Индикатор Veles_dChannel представляет собой динамическую МА с расчетным каналом по текущим ценам инструмента.
Индикатор показывает полностью законченное движение в цикле.
Данный индикатор может использоваться в качестве установки и траллирования стопов при скальпинге.
Параметры: period - период динамической МА price - применяемая це
Новая серия индикаторов Veles Dynamic. Индикаторы не перерисовывают своих значений.
Эти индикаторы работают быстрее и точнее аналогичных по названию.
Индикатор Veles_dTrend представляет собой гистограмму, рассчитанную на основе нескольких динамических алгоритмов,
использующих текущие цены инструмента.
Пока индикатор не покажет смену тренда, будьте уверены, что тренд продолжит свое направление.
Кроме этого, есть зоны принятия решения, которые ограниченны уровнями.В этих зонах будет
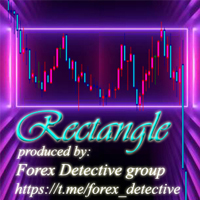
One of the most successful strategies in Forex, stick and metal market, is rectangle pattern. A hard pattern to find in multiple time frames, but, We made it so very easy for you. You can turn on this indicator in different currency pairs with different time frames and set the alarm on your computer or mobile phone. Working with this strategy is easy and enjoyable. Telegram: https://t.me/triangleexpert Instagram: https://www.instagram.com/p/CNPbOLMh9Af/?igshid=15apgc7j1h5hm
Note: This indica
O Mercado MetaTrader contém robôs de negociação e indicadores técnicos para traders, disponíveis diretamente no terminal.
O sistema de pagamento MQL5.community está disponível para todos os usuários registrados do site do MQL5.com para transações em todos os Serviços MetaTrader. Você pode depositar e sacar dinheiro usando WebMoney, PayPal ou um cartão de banco.
Você está perdendo oportunidades de negociação:
- Aplicativos de negociação gratuitos
- 8 000+ sinais para cópia
- Notícias econômicas para análise dos mercados financeiros
Registro
Login
Se você não tem uma conta, por favor registre-se
Para login e uso do site MQL5.com, você deve ativar o uso de cookies.
Ative esta opção no seu navegador, caso contrário você não poderá fazer login.