Conheça o Mercado MQL5 no YouTube, assista aos vídeos tutoriais
Como comprar um robô de negociação ou indicador?
Execute seu EA na
hospedagem virtual
hospedagem virtual
Teste indicadores/robôs de negociação antes de comprá-los
Quer ganhar dinheiro no Mercado?
Como apresentar um produto para o consumidor final?
Novos Indicadores Técnicos para MetaTrader 4 - 64

Индикатор превосходно показывает экстремумы цены. Для торговли по данному индикатору рекомендую торговать по сигналам старших таймфреймов. Индикатор не перерисовывается и не меняет значения в истории. The indicator perfectly shows price extremes. To trade on this indicator, I recommend trading on the signals of the higher timeframes. The indicator does not redraw and does not change the values in the history.

Индикатор уровней поддержки и сопротивления. Не перерисовывается и не меняет свои значения при переключении таймфреймов. С индикатором можно работать как на пробой уровней так и на отбой уровней поддержки и сопротивления Indicator of support and resistance levels. It does not redraw and does not change its values when switching timeframes. With the indicator, you can work both on the breakdown of levels and on the rebound of support and resistance levels

Индикатор Супер МА является трендовым индикатором и отлично справляется определением текущей тенденции. Ею можно пользоваться как для скальпинга так и для торговли внутри дня. Сигналы индикатора не перерисовываются и не меняют свои значения после закрытия бара The Super MA indicator is a trend indicator and does an excellent job of determining the current trend. It can be used both for scalping and for intraday trading. The indicator signals do not redraw and do not change their values after
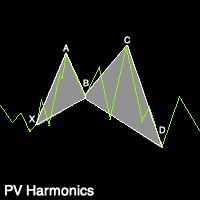
PV Harmonics - Paints harmonic triangles and patterns on live charts to show current live harmonic patterns. - Paints arrows on charts over the harmonic patterns to signal prime entry and exit points. - Extremely fast and versatile indicator. - Highly accurate. - Non repainting. (Does not repaint entry/exit signals) - Comes with numerous customization settings.
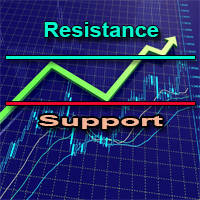
Индикатор уровней поддержки и сопротивления отлично показывает на графике все силовые уровни от всех таймфреймов. Рекомендую торговать уровни старших таймфреймов. Индикатор на текущем таймфрейме обновляться как только на графике появится новый сетап The indicator of support and resistance levels perfectly shows all power levels from all timeframes on the chart. I recommend trading higher timeframe levels. The indicator on the current timeframe is updated as soon as a new setup appears on the
Индикатор объёмов отличный помощник в трейдинге. Индикатор не перерисовывается и не меняет значения при переключении таймфреймов. Индикатор объёмов MTF, показывает текущую тенденцию на графиках. Рекомендую торговать в сторону сигналов старших таймфреймов The volume indicator is a great assistant in trading. The indicator does not redraw and does not change values when switching timeframes. MTF volume indicator, shows the current trend on the charts. I recommend trading in the direction of highe

Introduction This Indicator Is Based On Average Price/Maximum Price Moves, And Using Moving Bollinger Bands And Moving Averages.
The Advantage Of Using It With YOUR own Analysis Will Confirm Potential Supports And Resistances While it Compliments With Your Analysis
The Indicator Is Non-Repainting
AND Along With Our Special Trend METRE that Changes With The Conditions OF A Bullish Or Bearish Trend....
Recommend Time-Frames: H1 H4 M15
Usage: The Indicator Is Very Profitable If Use
FREE
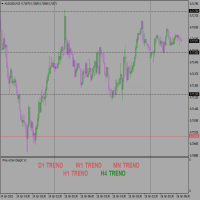
This is a price action traders delight, Too much of Indicators are bad on the chart so also to much of analysis can cause analysis paralysis. No need for Top down analysis, The EA does that for you based on Monthly, Weekly, Daily, And 4hrs trend readings on same window. Supports all time frame trading. Make your trading seem less and takes it to the next level. Its new and first of its kind with 5yrs development process. Just work with the colors ( Green for Bullish Market and Red for Bearish)

MT5 Version
Gaussian Channel MT4 Gaussian Channel MT4 is the first indicator in the market that uses Ehlers Gaussian Filter methods to define trends. Nowadays, this Gaussian Channel is highly known as a method to support HOLD techniques in crypto. If the price is above the channel the trend is strong, if it comes back to the channel this can react as a resistance and indicate the beginning of a bear market (or Winter) if the price breaks below it. Eventhough the use of this channel focuses on h

** All Symbols x All Time frames scan just by pressing scanner button ** *** Contact me to send you instruction and add you in "Harmonic Scanner group" for sharing or seeing experiences with other users. Introduction Harmonic Patterns are best used to predict turning point. Harmonic Patterns give you high win rate and high opportunities for trade in during one day. This indicator detects the best and successful patterns base on Harmonic Trading books . The Harmonic Patterns Scanner Scans All ch
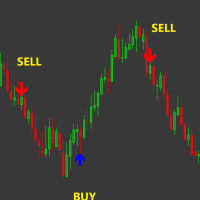
Buy sell indicator mt4 is a signal indicator that shows the price rollback points to the trader. At the points where the arrow appears, the indicator shows the trader that a price rollback is possible for a long or short distance. Thus, the trader can catch these moments and open trades. This works well for trading with a salping strategy. You see that an arrow appears, open an order in the direction of the arrow and place a TakeProfit in the amount of 15-25 points. Thus, you can open from 5 to

A trend indicator is a hybrid of several indicators that process data sequentially with signaling a trend change. Advanced net price action calculation to find LH and HL breakouts. Finishing the indicator data will give you excellent pivot points in the market. LH and HL signals can also be used for breakouts of the training. The indicator has proven itself well in a strategy based on impulse levels and false breakouts. When a breakout occurs, it indicates a strong reversal. A good filter for mo

Here is a sensitive indicator for Dublgis professionals. It is built on completely new algorithms and is more efficient, on any timeframes, since it filters random price movements. Finds and visually displays price reversal points. This tool can be used as confirmation when making a deal, as well as to determine the direction of the trend and its strength. The indicator was developed as a complement to a number of our other trading tools.

The Context Aviation indicator analyzes the price behavior and if there is a temporary weakness in the trend, you can notice this from the indicator readings, as in the case of a pronounced change in the trend direction. It is not difficult to enter the market, but it is much more difficult to stay in it. The Context Aviation indicator makes it much easier to stay in trend! This indicator allows you to analyze historical data and, based on them, display instructions for the trader for further a

The advantage of working with the Brian signal indicator is that the trader does not need to conduct technical analysis of the chart on his own. The tool generates ready-made signals in the form of directional arrows. This tool is an arrow (signal) one and works without redrawing.
Its signals are based on a robust algorithm. When used simultaneously on multiple timeframes, this indicator will truly "make the trend your friend". With it, you can follow trends on multiple timeframes in real time
MT5 Version
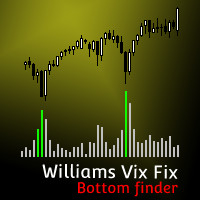
Williams Vix Fix MT4 Need help trying to time the bottoms in the market? Williams Vix Fix MT4 is based on the volatility of the market and grants a huge support for finding out when a correction is comming to its end. TRY IT FOR FREE NOW! Williams Vix Fix MT4 derivates from Larry Williams's VixFix indicator addapted for fitting every asset class . VIX reprensents the fear and greed in the market based on its volatility. A high VIX value shows fear in the market, this is usually a

Piccoline is a very interesting trend indicator. The Piccoline indicator helps to identify either a new or an existing trend. One of the advantages of the indicator is that it rebuilds rather quickly and reacts to various changes in the chart. Of course, it depends on the settings, namely, the specified CalcBars period. The larger it is, the smoother the trend line will be. The shorter the period, the more market noise will be taken into account when forming the indicator.
The indicator wa

After working during many months, with the help of Neural Networks, we have perfected the ultimate tool you are going to need for identifying key price levels (Supports and Resistances) and Supply and Demand zones. Perfectly suitable to trigger your trades, set up your future actions, decide your Take Profit and Stop Loss levels, and confirm the market direction. Price will always move between those levels, bouncing or breaking; from one zone to another, all the remaining movements are just mark

Bella is one of the most popular indicators that allows you to timely identify a trend reversal, get an early entry point and pinpoint the place of profit taking. The Bella indicator implements the main idea of the trader and generates a point of entry into the market in the direction of the trend.
Bella is used when there are additional indicators. To filter such signals, you can use the same indicator on older timeframes. Thus, the work with the indicator is improved, while maintaining its

重力拋物線系統 (Mostafa System)
輕鬆判別趨勢走向
提示完美進場點位
交易輔助清單
順勢交易系統
系統介紹:
重力拋物線系統,使用多項式非參數回歸方法計算拋物線重心及趨勢方向,而價格有非常高的機率會按照拋物線的趨勢方向前進,在依個上升趨勢拋物線中,綠線將會是我們第一個進場點,橘線會是第二個進場點,止損位置僅需要放置在橘線下方。此系統可大幅增加趨勢交易的勝率,交易者可清楚分辨當前交易方向,以及系統建議的進場位置。
影片教學:
UncleForex 外匯大叔 ( https://youtu.be/G4Xahx2Mivg )
今天大叔跟大家分享一套由歐洲的分析師,同時也是交易冠軍的 Mostafa Belkhayate 大師所創建的重力拋物線系統策略。
在交易的道路上我們時常聽到"順勢而為" ,按著趨勢方向去交易,然而大部分的交易者很難了解當下的盤面,到底是上升趨勢還是下降趨勢呢? 而重力拋物線系統,卻可以一眼輕鬆辨別趨勢?!
且還能找到最佳的進出場點位!趕緊觀看影片了解吧 ~

You can use the Viking Trend indicator as the main one to determine the trend. The indicator can work both for entry points and as a filter. This is a hybrid trend indicator, as it is based on the signals of elementary indicators and a special algorithm for analysis. The indicator reflects information in a visual form; it can be used both for pipsing on short periods and for long-term trading. The indicator does not redraw and does not lag. Take Profit is bigger than Stop Loss! Works on all curr
Extremums Max is an indicator of trend and trading signals, based on the principle of a combined analysis of calculated reference points within the channel as well as overbought and oversold levels.
The indicator forms arrows (by default, red and blue). The indicator is set in the usual way to any trading symbol with any time interval.
Indicator Benefits High accuracy; Work with any trade symbols; It works at any time intervals; Not redrawn. Input parameters Period - indicator period; Level

Qv² Stdev é um indicador desenvolvido com base no desvio padrão de preços e volume de negociação.
Os sinais de compra são indicados por setas para cima.
Os sinais de venda são indicados por setas para baixo.
Um detalhe importante é que o Volume Qv² possui duas bandas, uma superior e uma inferior, ambas servindo como alvo para o take profit.
Recomenda-se usá-lo em H1
Pode ser usado em todos os pares (eu uso em Gold).
Bom negócio, no mercado de tendências Para conhecer um pouco mais do meu

超級剝頭皮系統 (Super Golden System)
短線交易的系統
超快速進出場獲取利潤
系統自帶提示功能
自動分析出場位置
系統介紹:
由Jasonforex團隊編寫的價格判斷系統 , 分析當前週期趨勢方向,並結合Parabolic SAR 中短期指標技術,確認明確的反轉位置 , 及推薦出場位置 , 形成高勝率的短線交易模式 ,超級 剝頭皮系統在符合進場條件時,會在MT4上即時通知提示,提醒最佳的短線交易機會。
進出場設定位置:
買單(BUY)
TP(止盈價位): 箭頭或提示訊息出現,當前價位 + GoldenK-TP * 自定義倍數
SL(止損價位): 當前價位 - GoldenK-TP * 自定義倍數
賣單(SELL)
TP(止盈價位): 箭頭或提示訊息出現,當前價位 - GoldenK-TP * 自定義倍數
SL(止損價位): 當前價位 + GoldenK-TP * 自定義倍數
參數設定: 1. ShowArrows: 買單及賣單箭頭訊號提示
2. alertsOn: 所有通知訊息總開關(Message訊息/Soun

Trend Indicator, a revolutionary trend trading and filtering solution with all the important trend tool features built into one tool! The Step Success indicator is good for any trader, suitable for any trader for both forex and binary options. You do not need to set up anything, everything is perfected with time and experience, it works great during a flat and a trend.
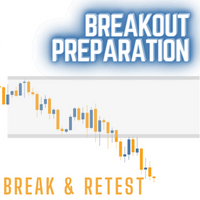
Breakout Preparation Choppy movement up and down on the opening range everyday. Trading breakouts on London session and New York session is recommended. Setting a bounce for a certain time zone and trade when the bounce reveals a break through. Input Parameter Indicator Name Days to Show Start Time to Analysis End Time to Analysis Bounce Show till Time Chart Setting Color Scheme Selection
Happy Trading and thanks for support.

Possible Price reversals levels - based on Fibonacci + Support + Resistance Levels Auto levels drawn based on input index (Bars Count ) ---->>> Price Over 50% Fibo line ---> UP TREND ---> BUY when price drop near Support Lines ---->>> Price Down 50% Fibo line ---> DOWN TREND ---> SELL when price goes up near Resistance Lines
--->>> The more close price levels ----> the more possibility for price reversals --->>> are you a scalper --> try it on M1 charts with big index like 5000 bars or

Highly configurable Awesome Oscillator (AO) indicator. Features: Highly customizable alert functions (at levels, crosses, direction changes via email, push, sound, popup) Multi timeframe ability Color customization (at levels, crosses, direction changes) Linear interpolation and histogram mode options Works on strategy tester in multi timeframe mode (at weekend without ticks also) Adjustable Levels Parameters:
AO Timeframe: You can set the current or a higher timeframes for AO. AO Bar Shift:
FREE

Diamonds Min5 - DM5-
DM5 is an indicator that suggests entering levels (sell or buy) ,it always follow the trends using parabolic sar , working on is so easy, you need just to attach it to the chart and all the magic will show , this indicator does not repeat itself or redraw signals .
After months of testing, it provides a very good result it works on all pairs with no excaption

Super Signals Channel Indicator
Its channel is a non-repaint indicator that reacts more with recent price movements. For this reason, the Super Signals Channel Indicator is a better match for short-term or day trading strategy. The Super Signals Channel only plots swing trading opportunities. So most of its trade signals appear during consolidation or sidelined periods of the market. Super Signals Channel Indicator for MT4 Explanation The green band below the price shows the dynamic support le

WIth this indicator you can find Engulfing pattern that touch bollinger bands + optional moving average rule. For bearish engulf to form, second body (bearish) must be bigger than first (bullish) and one of them must be touching upper bollinger band with closed price. For bullish engulf to form, second body (bullish) must be bigger than first (bearish) and one of them must be touching lower bollinger band with closed price. You can also use moving average rule, so bearish engulf must be below MA

WIth this multi time frame and pair Scanner, you can find Engulfing pattern that touch bollinger bands + optional moving average rule. For bearish engulf to form, second body (bearish) must be bigger than first (bullish) and one of them must be touching upper bollinger band with closed price. For bullish engulf to form, second body (bullish) must be bigger than first (bearish) and one of them must be touching lower bollinger band with closed price. You can also use moving average rule, so bearis

Os níveis do Intervalo de Pivot Central são formados em torno de um ponto de pivot central.
Estes níveis em relação ao pivô central podem ser utilizados para determinar numerosos comportamentos de mercado e possíveis resultados.
A distância do pivô central e o preço que os novos níveis formam em relação aos níveis do dia anterior podem ser utilizados para determinar a direção e a força da tendência dos dias seguintes.
As faixas de pivot central podem atuar como suporte e resistência, oferecer
FREE

Se você gosta deste projeto, deixe uma revisão de 5 estrelas. Como as instituições comercializam grandes volumes, não é incomum que eles
tentem tentar
defender sua posição em níveis específicos de porcentagem. Estes níveis servirão como um suporte natural e resistência que você pode usar
ou para entrar em um comércio ou estar ciente de possíveis perigos contra sua
posição. Este oscilador irá mostrar-lhe a variação percentual para o: Dia. Semana. Mês. Quarto. Ano. Em uma subjanela onde você ras
FREE
Fibonacci Breakout is a trading strategy using the Fibonacci retracement. This technique is actually a technique to allow us to enter the beginning of the trend. Its very easy to understand even for beginner. The strategy is that you just have to wait for the automatic custom fibonacci appear then manually place your pending order, stop loss and take profit at the level of Fibonacci. The position will be opened when the price make a successful retest. Fibonacci Breakout Suitable for Forex, Crypt

New, more accurate version of the Xmaster indicator. More than 200 traders from around the world have conducted more than 15,000 tests of different combinations of this indicator on their PCs in order to get the most effective and accurate formula. And here we present to you the "Xmaster formula indicator forex no repaint" indicator, which shows accurate signals and does not repaint. This indicator also sends signals to the trader by email and push. With the arrival of each new tick, it constan

Forex indicator " iron condor strategy " allows you to apply a very well-known strategy of options in the forex market. With the help of this indicator, you will know when to open a buy deal and when to open a sell deal. The "iron condor strategy" indicator shows you this information using the arrows on the chart. This will allow you to get information in which direction you need to open a deal by looking at the indicator signals in 5 seconds. Instead of analyzing the chart for an hour, now you

Qv² Trend é um indicador que visa identificar tendências.
Os sinais de tendência de compra são indicados por setas apontando para cima.
Os sinais de tendência de venda são indicados por setas apontando para baixo.
Pode ser usado em todos os prazos.
Pode ser usado em todos os pares.
Eu uso no H1 com um período de 24.
Observação importante: Eu recomendo usá-lo em mercados que apresentam tendências naturalmente. Para mercados de laterais (em acumulação), apresento meu outro indicador neste l

QV2 MA é um indicador que apresenta os resultados de duas médias móveis suavizadas aplicadas as velas.
Ítem 01 - Sinal de compra: As velas aparece na cor Aqua, quando a média móvel suavizadas de 4 períodos está em expansão e acima da média móvel suavizadas de 24 períodos.
Ítem 02 - Sinal de venda: As velas aparece na cor HotPink, quando a média móvel suavizadas de 4 períodos está em expansão e abaixo da média móvel suavizadas de 24 períodos.
Ítem 03 - As velas cinza é uma região de indefi
Highly configurable Macd indicator.
Features: Highly customizable alert functions (at levels, crosses, direction changes via email, push, sound, popup) Multi timeframe ability Color customization (at levels, crosses, direction changes) Linear interpolation and histogram mode options Works on strategy tester in multi timeframe mode (at weekend without ticks also) Adjustable Levels Parameters:
Stochastic RSI Timeframe: You can set the lower/higher timeframes for Stochastic RSI. Stochastic RSI
FREE

Average daily range, Projection levels, Multi time-frame ADR bands shows levels based on the selected time-frame. Levels can be used as projections for potential targets, breakouts or reversals depending on the context in which the tool is used. Features:- Multi time-frame(default = daily) Two coloring modes(trend based or zone based) Color transparency
FREE
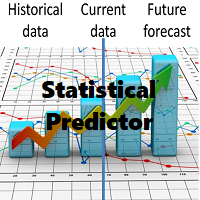
Waddah Attar Statistical Predictor
This indicator show you the Statistical Forecast for any symbol. it depends on a history data . the result show on a new day and still with no change until end of the day . with this indicator you can : know the main direction . know the range of the movement . know high and low in the current day . use indicator levels in any expert you made to auto trade .
Preferably used with main symbols like EURUSD, GBPUSD, AUDUSD, NZDUSD, USDJPY, USDCHF, USDCAD, Gold, S
FREE

Coral Trade Planner is a 3-in-1 tool for making smart trades. The Lot Size Calculator lets you determine the appropriate lot size based on risk, and see the impact on your risk as you change the stop loss distance and/or lot size. The Trade Planner is an innovative tool for visualizing your planned trades on the chart, and gives you immediate feedback on the value of the trade (both the risk of hitting your stop loss and the reward of hitting your take profit). Both Market and Pending order

The StrikePin indicator is a technical, analytical tool designed to identify trend reversals and find optimal market entries. The StrikePin indicator is based on the pin bar pattern, which is the Price Action reversal pattern.
An entry signal, in a trending market, can offer a very high-probability entry and a good risk to reward scenario.
Be careful: the indicator is repainting since it is looking for highest high and lowest lows. You should avoid to use it in experts but you can use it in
FREE

ADR 10 mostra l'intervallo medio di pips di una coppia Forex, misurato su un numero di 10 giorni . I traders possono utilizzarlo per visualizzare la potenziale azione dei prezzi al di fuori del movimento medio giornaliero.
Quando l'ADR è al di sopra della media, significa che la volatilità giornaliera è superiore al normale, il che implica che la coppia di valute potrebbe estendersi oltre la sua norma.
L'ADR è utile anche per il trading di inversioni intraday. Ad esempio, se una coppia di val
FREE

Description This scanner uses 3LZZ TRO ex4 and scans for Semafors at given “Shift” bar.
Scanner Detailed Settings: https://www.mql5.com/en/blogs/post/747456
Other Settings: Set Periods for Semafor 1,2,3 Set alerts on/off for Semafor 1,2,3 Shift bar (Bar on which semafor is scanned) Refresh After Ticks (Number of ticks when dash is refreshed) This scanner is pretty simplistic version. And a more detailed version with a different strategy is available here: https://www.mql5.com/en/market/product
FREE

Канальный индикатор "Snake" . Отлично показывает точки входа и выхода.
Не перерисовывает!
Хорошо подойдет для стратегий с сетками (усреднения), стратегий с пирамидами (стратегий добора), обычной торговли по тренду, торговли на коррекции.
Для любых типов инструментов: валюты, нефть, металлы, криптовалюты. Для любых таймфреймов: от M1 до D1 . Для любых стилей торговли: скальпинг, интрадэй, свинг, долгосрок .
Используйте в сочетании с трендовым индикатором, чтобы исключить риски входа про

Нестандартный индикатор определения текущего тренда. Альтернативный подход к определению текущей рыночной тенденции. В основе лежит уникальный алгоритм. Не используются скользящие средние , осцилляторы , супер-тренды и прочие стандартные индикаторы.
Для таймфреймов: от M15 до D1 . Для стилей торговли: интрадэй, свинг, долгосрок .
Может стать готовой торговой стратегией совместно с любым канальным индикатором. Например таким, как индикатор "Snake" . Внимание! Это индикатор, а не советник,
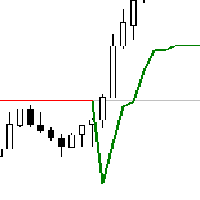
Based on supertrend indicator ,
get alert based on trend change of very popular SUPERTREND indicator..
Supertrend indicator can be used for both trend change setups or inline trend confirmation can be seen as trend continuation. providing as better entries and exits. or you can use supertrend indicator also as dynamic support and resistance zone.
When applied to chart Dashboard will scan and show current position of price with respect to supertrend indicator , and you will be able to get

This is a custom RSI of MA indicator consisting of 8 indices: AUDindex, NZDindex, CADindex, EURindex, CHFindex, GBPindex, USDindex and JPYindex. It can run on Forex brokers' servers having 28 currency pairs. No repaint.
How to Use When one of the 8 indices turns upwards, sell the strongest pair. When one of the 8 indices turns downwards, buy the lowest pair.
+ For newbies: Best trading has been detected on H1 chart in Euro session and US session to avoid sideways market Or use timeframe M5/M15

sarangani venom is 100% profitable, easy to use indicator, a chart without indicator is stressful and will lead you to many losses, this indicator is pleasing to the eye that will gives you more confident to trade when there is signal, your computer will gives sound and the spider will animate, it can be used to all time frame and to all currency, you have many options, when the candlestick touches to upper line it is buy, when it touches to lower line it is sell, when the rope is pull to buy ar
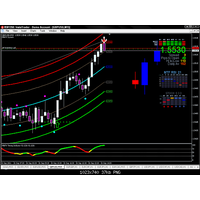
Gravity Timing Indicator -GTI-
O indicador GTI é o indicador mais fácil e preciso até agora. ele usa suporte e resistência de forma gravitacional. Trabalhar nele é tão fácil, ele consiste em 7 linhas, sendo as mais poderosas as linhas mais baixas e mais altas, então quando o indicador rebate, é o melhor momento para entrar.
funciona em todos os pares sem exceção
para o período de tempo, prefiro períodos de tempo pequenos, como 5 minutos e 15 minutos para escalpelamento.
FREE

Níveis Institucionais/Níveis Bancários...Níveis Psicológicos/Teoria dos Trimestres.
Este indicador desenhará automaticamente os níveis "000, 200, 500 e 800", o que conheço como 'Níveis Institucionais', OU, também pode desenhar os níveis "000, 250, 500 e 750" no gráfico.
Dependendo de onde aprendeu a teoria da negociação a nível institucional/quartos, pode conhecê-los como nomes diferentes, essencialmente a ideia central é que estes níveis atuam como fortes pontos de suporte e resistência na ma
FREE

Forex indicator for day trading for beginners. This indicator shows with arrows when the price turns in the other direction. At this moment, you can conclude deals. The indicator trades on H1, H4 timeframes. The indicator also shows the trend direction with lines. During the day, you can open deals in the direction of the trend and set a minimum 15-20 points of TakeProfit. When one deal is closed by take profit, you immediately open another deal in the direction of the indicator line.
How the D

Este indicador do painel de controle de zona de oferta e demanda com vários períodos e vários símbolos envia alertas quando o preço atinge uma zona de oferta / demanda. Também é possível usá-lo para ser alertado sobre topos / fundos duplos regulares em vez de zonas. Ele pode ser usado com todos os intervalos de tempo de M1 a MN. É possível usar RSI, divergência (MACD, OsMA, RSI ou Awesome) e filtros de padrões de velas (barra de pinos, engolfing, pinça e estrela da manhã / noite) para filtrar ap

Royal Wave is a Trend-Power oscillator which has been programmed to locate and signal low-risk entry and exit zones. Its core algorithm statistically analyzes the market and generates trading signals for overbought, oversold and low volatile areas. By using a well-designed alerting system, this indicator makes it easier to make proper decisions regarding where to enter and where to exit trades. Features Trend-Power Algorithm Low risk Entry Zones and Exit Zones Predictions for Overbought and Over
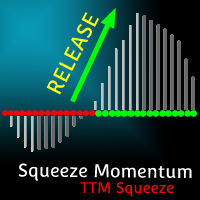
MT5 Version TTM Squeeze Momentum
TTM Squeeze Momentum is an enhanced indicator ideal for recognizing consolidation periods in the market and the start of the next explosive move. This improved version is a volatility indicator based on John Carter's "TTM Squeeze" in which the histogram is based on a linear regression rather than a simple momentum indicator. Red dots on the middle line indicate that the market has entered a "Squeeze" zone or consolidation period, indicated in this enhanced versi

Meta Trend Indicator is an efficient way to forecast and detect the trend in any market. It reveals the trend, support and resistance levels, volatility and the maximum potential target, all in one indicator. To adapt to the price and to decrease consecutive trend failures, the internal trend detector algorithm studies the market and dynamically chooses the right values for the internal parameters. This indicator is a perfect trend filter for any strategy or expert advisor. Features Super Adapti

Qv² OBOS é um indicador que visa identificar regiões de sobrecompra e sobrevenda considerando desvio padrão de preços e análise de volume.
Os sinais de sobrevenda são indicados por setas apontando para cima.
Os sinais de sobrecompra são indicados por setas apontando para baixo.
Pode ser usado em todos os prazos.
Pode ser usado em todos os pares.
Eu uso em H1
Nota importante, o histograma é exibido para melhorar a análise do trader. Mas os sinais de sobre compra e sobre venda são as setas

the first release of the new year's special promo price.normal price 150 USD. important user guide is here https://heyzine.com/flip-book/62a16c6955.html indicator to speed up finding support and resistance price.very easy to use very neat interface.doesn't display unnecessary confusing things.uses basic trading strategies for professional traders.....happy trading if something is still not clear,please contact me personally,i will reply later

ADR 20 mostra l'intervallo medio di pips di una coppia Forex, misurato su un numero di 20 giorni . I traders possono utilizzarlo per visualizzare la potenziale azione dei prezzi al di fuori del movimento medio giornaliero.
Quando l'ADR è al di sopra della media, significa che la volatilità giornaliera è superiore al normale, il che implica che la coppia di valute potrebbe estendersi oltre la sua norma.
L'ADR è utile anche per il trading di inversioni intraday. Ad esempio, se una coppia di valu
FREE

High Probability Reversal Indicator The indicator looks for trend exhaustion areas, and plots Buy/Sell arrow after confirmation of trend exhaustion. Signals can also be shown as popup alerts, or be sent as e-mail or mobile phone notification. Trades can be taken on breakout of the signal candle. Inputs
Signal Type: Aggressive/Normal History Bars : Can be set to 0 (zero) to show all historical signals, or can be set to a limited number of bars for faster execution. Show Alert : True/Fal

Se você gosta deste projeto, deixe uma revisão de 5 estrelas. Como as instituições comercializam grandes volumes, não é incomum que eles
tentem tentar
defender sua posição em níveis específicos de porcentagem. Estes níveis servirão como um suporte natural e resistência que você pode usar
ou para entrar em um comércio ou estar ciente de possíveis perigos contra sua
posição. Um exemplo de uma porcentagem usada comum é de 0,25% e 0,50% no EURUSD para o
semana, você pode ver este exemplo nas captu
FREE

Royal Scalping Indicator is an advanced price adaptive indicator designed to generate high-quality trading signals. Built-in multi-timeframe and multi-currency capabilities make it even more powerful to have configurations based on different symbols and timeframes. This indicator is perfect for scalp trades as well as swing trades. Royal Scalping is not just an indicator, but a trading strategy itself. Features Price Adaptive Trend Detector Algorithm Multi-Timeframe and Multi-Currency Trend Low
[ MT5 Version ] How to trade using the Fear and Greed Indicator: Click here Uncertain about when to take total or partial profits? The Fear and Greed is your reliable companion for making confident trading decisions. This innovative tool offers unparalleled insights into market sentiment, helping you identify key pivot zones and optimize your trading strategy. Why Choose Fear and Greed? Revolutionary Market Insight: Sentiment Analysis: The first indicator for that reveals the market's Fear and

Unknown Star is a Forex indicator that performs mathematical calculations, predicting market changes and greatly facilitating the calculation of prices in the future. The mission of market indicators does not end with price predictions. It informs the trader about important changes - including the second when the price gains or exceeds the value. The work of Unknown Star frees the trader from making calculations with his own hand. The market participant can only correctly assess the indicator's

Distinctive is a forex trending arrow indicator for identifying potential entry points. I like it, first of all, because it has a simple mechanism of work, adaptation to all time periods and trading tactics. Created on the basis of a regression channel with filters. Plotting the Lawrence indicator signals on a price function chart using a mathematical approach.
How it works - when the price breaks out in the overbought / oversold zone (channel levels), a buy or sell signal is generated. Everyt

Hacksaw is a trend indicator used in the Forex markets. Sharp price fluctuations are ignored, as well as noise around average prices. Signal points, where the color changes, can be used as potential market reversal points. The advantage of the indicator is its simplicity of settings and a call to action.
Naturally, do not forget that any indicator is only an assistant, and not a magic tool, by the will of which you will become fabulously rich.
Unfortunately, many novice traders forget about t

The trend step indicator Cattivo analyzes the state of the market, the phase of its movement and largely determines the success of a trader in his difficult work. Cross points of the Cattivo technical indicator can be used as potential market reversal points. Thus, all intersection points will be optimal points at which the movement changes taking into account the indicator period.
Many newbies who first enter the market are often more fortunate than a professional who has spent years learning

Determining the market trend is an important task for traders. The Inside indicator implements an improved algorithm for visualizing the market trend. The main purpose of the indicator is to evaluate the market on small timeframes (i.e. M1, M5 and M15) for scalping. If you are a scalper looking for a reliable indicator to improve the quality of your trading, Inside is what you need. The indicator works in a separate window, showing red and green bars on the histogram. Two consecutive green (red
O Mercado MetaTrader contém robôs de negociação e indicadores técnicos para traders, disponíveis diretamente no terminal.
O sistema de pagamento MQL5.community está disponível para todos os usuários registrados do site do MQL5.com para transações em todos os Serviços MetaTrader. Você pode depositar e sacar dinheiro usando WebMoney, PayPal ou um cartão de banco.
Você está perdendo oportunidades de negociação:
- Aplicativos de negociação gratuitos
- 8 000+ sinais para cópia
- Notícias econômicas para análise dos mercados financeiros
Registro
Login
Se você não tem uma conta, por favor registre-se
Para login e uso do site MQL5.com, você deve ativar o uso de cookies.
Ative esta opção no seu navegador, caso contrário você não poderá fazer login.