Conheça o Mercado MQL5 no YouTube, assista aos vídeos tutoriais
Como comprar um robô de negociação ou indicador?
Execute seu EA na
hospedagem virtual
hospedagem virtual
Teste indicadores/robôs de negociação antes de comprá-los
Quer ganhar dinheiro no Mercado?
Como apresentar um produto para o consumidor final?
Novos Indicadores Técnicos para MetaTrader 4 - 15
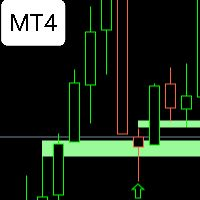
FVG WATCHER is an indicator that helps traders identify fair value gaps in the market. The indicator draws fair value gaps and alerts the user when the fair value gap has been swept. It allows users to specify how it should be swept, what time range to alert, and the size of the fair value gap to alert. It also allows the user to apply a moving average trend filter for better choice of alerts. The indicator also allows push mobile notifications. What makes FVG Watcher special is that it can be

McS Super Trend -This is one of the most popular classic trend indicators. It has a simple setting, allows you to work not only with the trend, but also displays the stop loss level, which is calculated by this indicator. Benefits:
Instruments: Currency pairs , stocks, commodities, indices, cryptocurrencies. Timeframe: М15 and higher. Trading time: Around the clock. Shows the direction of the current trend. Calculates the stop loss. It can be used when working with trading. Three types of no
FREE
Simple but effective entry improving indicator that you want to use. Combine with other indicators and your trading strategies. Explore different ways to use it and find your perfect entry.
Basic instructions: Buy Signal Example: colour change from red to green Sell Signal Example: colour change form green to red
Check screenshots below for examples of use.

Introducing our advanced MQL4 Indicator, a groundbreaking tool for identifying support and resistance zones with unmatched precision. Elevate your trading strategy with a host of features, including a dual-color upper and lower box system that allows for easy visual recognition of market trends.
Key Features: Dual-Color Box for the Support and Resistance Zones Customize your analysis with dual-color box. The upper and lower boxes offer distinct colors, providing a clear visual representation o

Introducing our revolutionary intra-day trading indicator, meticulously crafted to optimize your trading insights within the 24-hour market cycle. Immerse yourself in historical data with precision using two distinctive modes - "All History" and "Last X Hours."
Key Features: All History Mode Uncover a comprehensive view of the day's dynamics. Instantly analyze the preceding day's high and low, 50% mid-point, and the open versus close price for the current day. Decode critical patterns to infor

Introducing our groundbreaking indicator designed to elevate your trading strategy! Unlock the power of precise volume analysis with Buy, Sell, and Neutral indicators. Tailor your approach with customizable levels based on timeframes and moving average methods.
Key Features: Dynamic Volume Insights Instantly identify Buy, Sell, and Neutral volumes for informed trading decisions. Gain clarity on market sentiment like never before. Adaptable Level Configuration Customize and adapt levels to matc

LLAMA stands for Lag-Less Adaptive Moving Average it is a state of the art moving average that is very close to the price, specially those sudden moves that put every typical moving average away from the price. This finding comes from the latest research in adaptive moving averages, with a lag close to 0
This MA keeps a very high smoothing ability while keeping a lag almost null.
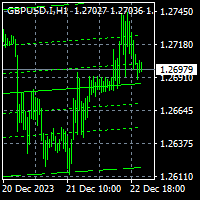
To get access to MT5 version click here . This is the exact conversion from TradingView: "Linear Regression Channel" by "LonesomeTheBlue". This is a repaint indicator. Buffers are not available for processing. You need to parse objects on chart. All input fields are available. You can message in private chat for further changes you need. Thanks for downloading
Indicador Universal RSI con Alertas de Oportunidad Este indicador para MetaTrader ha sido meticulosamente diseñado para adaptarse a todos los periodos de tiempo, proporcionando una herramienta versátil para los operadores de todos los niveles. Basado en el índice de fuerza relativa (RSI), este indicador destaca oportunidades potenciales en el mercado y te notifica de manera instantánea a través de alertas personalizadas. Características Principales: Universalidad de Periodos de Tiempo: Funciona
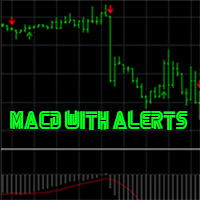
Indicador de Oportunidades MACD en Tiempo Real con Alertas de Precisión Descubre un indicador excepcionalmente preciso diseñado para potenciar tu experiencia de trading. Basado en el Moving Average Convergence Divergence (MACD), este indicador ofrece señales nítidas y oportunas, mejorando tu capacidad para identificar puntos de entrada y salida estratégicos. Además, este potente instrumento te mantendrá informado con alertas en tiempo real, proporcionándote una ventaja competitiva en los mercado
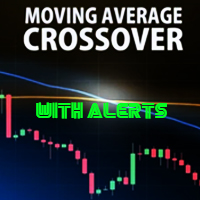
Descubre una nueva dimensión en el análisis técnico con CrossAlert MA, un poderoso indicador basado en cruces de medias móviles con funciones de alerta incorporadas. Diseñado para MetaTrader 4, CrossAlert MA utiliza la estrategia de cruce de medias móviles para identificar cambios significativos en la dirección del precio, proporcionando señales claras y oportunas. Características Principales: Cruces de Medias Móviles: CrossAlert MA aprovecha la potencia de los cruces de medias móviles para iden

PrecisionBands Descripción: Explora el mundo del trading con mayor precisión utilizando PrecisionBands, un indicador avanzado basado en las famosas Bandas de Bollinger. Diseñado para MetaTrader 4, PrecisionBands combina la versatilidad de las bandas de volatilidad con marcadores nítidos de señales de compra y venta, proporcionando una herramienta esencial para los traders que buscan tomar decisiones informadas. Características Principales: Bandas de Bollinger Mejoradas: PrecisionBands utiliza al

The Trend Analysis Indicator is an innovative tool designed for traders and investors who seek to navigate the complexities of the financial markets with greater precision and insight. This powerful indicator is engineered to adeptly identify whether a market is trending or not, offering users a vital edge in their trading strategy. Key Features: Accurate Trend Detection : The core functionality of the Trend Analysis Indicator lies in its ability to accurately detect market trends. It analyzes p

Apresentamos Market Structure Break Out para MT4 – Seu indicador profissional MSB e de Zonas Intactas Junte-se ao Canal Koala Trading Solution na comunidade mql5 para obter as últimas notícias sobre todos os produtos da Koala. O link de associação está abaixo: https://www.mql5.com/en/channels/koalatradingsolution
Market Structure Break Out: seu caminho para ter uma análise pura nas ondas do mercado
Este indicador foi projetado para desenhar a estrutura do mercado e as ondas de movimento,

O indicador básico de oferta e procura é uma ferramenta poderosa concebida para melhorar a sua análise de mercado e ajudá-lo a identificar áreas-chave de oportunidade em qualquer gráfico. Com uma interface intuitiva e fácil de usar, este indicador Metatrader gratuito dá-lhe uma visão clara das zonas de oferta e procura, permitindo-lhe tomar decisões de negociação mais informadas e precisas / Versão MT5 gratuita
Dashboard Scanner para este indicador: ( Basic Supply Demand Dashboard )
Carac
FREE

Este painel descobre e apresenta as zonas de oferta e procura no gráfico, tanto no modo de escalpelamento como de longo prazo, dependendo da sua estratégia de negociação para os símbolos seleccionados. Além disso, o modo de scanner do painel de controlo ajuda-o a verificar todos os símbolos desejados num relance e a não perder nenhuma posição adequada / Versão MT5 Indicador gratuito: Basic Supply Demand
Características
Permite-lhe ver oportunidades de negociação em vários pares de moedas , da

--- FREE VERSION - WORKS ONY ON EURUSD
------------------------------------------------------------------- This is a unique breakout strategy that is used for determination of the next short term trend/move. The full system is available on MQL5 under the name "Forecast System". Here is the link --> https://www.mql5.com/en/market/product/104166?source=Site Backtest is not possible, because calculations are done based on the data of all timeframes/periods. Therefore I propose you use the technol
FREE
Indicador convertido de outra plataforma que foi codificada por LuxAlgo.
Adicionei o tipo diferente de média móvel e também a variedade de dados de origem. Na versão original, a média móvel é SMA e a fonte de dados do mercado é recolhida apenas a partir do fecho das velas.
Nesta versão pode selecionar muitos tipos de médias móveis e também dados de origem como alto/baixo/HL2/HLC/HLC2/... .
aqui estão alguns detalhes do desenvolvedor original:
O indicador Range Detetor tem como objetivo

O indicador de níveis baseia-se nos dados do dia anterior. A fórmula matemática determina os níveis de entrada e saída.
Recomendações de negociação. Os níveis são negociados no início da sessão europeia quando a volatilidade aparece. Em caso de volatilidade insuficiente, use metade do take profit para sair. Se o preço inverteu a metade do take profit, então na inversão procure um objetivo também ao nível de metade do take profit. Se o preço saltou do nível de entrada, então na direção oposta
FREE

O IRDeS (Indicador de Detecção de Distância e Picos) é um indicador de força e distância a partir do nível zero, que permite entrar no mercado com um timing quase perfeito. Ele é composto por uma linha contínua de cor azul que detecta a distância e a volatilidade a partir do nível zero, e por um histograma, de cor vermelha acima do nível zero e verde abaixo do nível zero, que mede a intensidade e a força da negociação em uma vela específica, gerando um impulso forte, um "pico", em um ponto espec

40% DE DESCONTO PARA O NATAL! AUMENTO DE PREÇO PARA $250 EM 1º DE JANEIRO!
Apresentando GoldenGate Entries: Uma Solução de Negociação de Ponta!
Descubra uma abordagem revolucionária para a negociação com o GoldenGate Entries (GGE), um indicador avançado projetado para elevar sua experiência de negociação. O GGE oferece um conjunto abrangente de recursos para capacitar os usuários com precisão e confiança em suas decisões de negociação.
Pares: Qualquer (FX - Commodities - Equities - Ações

Martingale Arrow é um indicador mt4 do tipo seta projetado para negociação de opções binárias martingale, esta seta é impressa na barra aberta/intra e dá alerta. COMO USAR: abra a negociação no momento em que a seta aparecer, se a negociação for vencida, aguarde o próximo sinal e negocie o mesmo lote. Se a negociação perder o lote duplo no próximo sinal e continuar fazendo isso até que o sinal ganhe, então reinicie e negocie com o primeiro lote de negociação. PRAZO RECOMENDADO: QUALQUER Depósit

This indicator provides the ability to recognize the SMC pattern, essentially a condensed version of the Wyckoff model. Once the pattern is confirmed by RTO, it represents a significant investment opportunity. There are numerous indicators related to SMC beyond the market, but this is the first indicator to leverage patterns to identify specific actions of BigBoy to navigate the market. Upgrade 2024-03-08: Add TP by RR feature. The SMC (Smart Money Concept) pattern is a market analysis m

This indicator presents an alternative approach to identify Market Structure. The logic used is derived from learning material created by DaveTeaches (on X)
When quantifying Market Structure, it is common to use fractal highs and lows to identify "significant" swing pivots. When price closes through these pivots, we may identify a Market Structure Shift (MSS) for reversals or a Break of Structure (BOS) for continuations. The main difference with this "protected" logic is in how we determine

An indicator for visualizing time ranges of key trading sessions: Asian, European, and American. The indicator features functionality for setting the start and end times of each trading session, as well as an adjustable timezone of the trading server. The main advantages of the indicator include the ability to operate with minimal CPU load and memory usage. Moreover, it offers the option to specify the number of displayed historical days, providing the user with flexible market dynamics analysis
FREE

Introducing the advanced trading tools of 2023. MTF PPAAF Model S. This is sub window version of my best trading tool : MTF Precise Price Action Arrow Filtered. Click here to learn more about MTF PPAAF . This trading tool is equipped with various powerful features : MTF = Multi Time Frame = Time Frame can be changed. On/off button. Non Repaint Arrows. Customizable parameter, color etc. Can show all time frame (ATF) crossover arrows of fast stochastic main line & fast stochastic signal line (

ALQANNAS (Sniper) Indicator Overview: Welcome to ALQANNAS, your ultimate sniper in the forex market! ALQANNAS is a powerful and versatile trading indicator designed to enhance your trading experience. Whether you're a beginner or an experienced trader, ALQANNAS provides you with accurate non repainting signals, trend direction and strength, and advanced features to elevate your trading strategy. Key Features: Buy and Sell Signals: ALQANNAS is equipped with a sophisticated algorithm that genera

You can find full version here: Harmonic Pattern Scanner MT4 Harmonic Pattern Scanner MT5 Introduction Harmonic Patterns are best used to predict turning point. Harmonic Patterns give you high win rate and high opportunities for trade in during one day. This indicator detects the best and successful patterns base on Harmonic Trading books by Mr. Scott M.. Main Features Detect the best and most successful patterns : Gartley, Bat, Crab, Butterfly, Cypher, Shark, Alt_Bat, Deep_Crab Easy-
FREE

QuantumAlert CCI Navigator is a free indicator available for MT4/MT5 platforms, its work is to provide "alerts" when the market is inside "overbought and oversold" regions in the form of "buy or sell" signals. This indicator comes with many customization options mentioned in the parameter section below, user can customise these parameters as needful. Join our MQL5 group , where we share important news and updates. You are also welcome to join our private channel as well, contact me for the pri
FREE

This indicator is a histogram showing the trend based on 3 different moving averages. When all averages are set in ascending order, the indicator is green, and when in descending order, it is red. If the averages do not show a trend, the color is yellow. Additionally, each average can have different settings, such as Mode MA and Price MA. You can also set an alert and receive notifications on your phone.
To enable the alert and push notification, you need to activate them first in the MT4 setti
FREE

The indicator still has a few bugs but is ready for testing.
This is my first indicator that determines entry and exit points. The entry point is based on breaking the peaks determined by a channel indicating highs and lows (invisible channels). TP1 is a probable target at which most positions can be closed. The channel determining the opening and closing of positions is based on different assumptions. The red stop loss line is determined based on lows and highs.
The stop loss can be adjusted
FREE

The Cossover MA Histogram indicator is a simple tool showing the trend based on crossover of moving averages. Simply specify two mobving averages and addicional parameters like MA method and Applied price. When fast MA is above slow MA the histogram is green, indicating an uptrend. When MA fast is below MA slow the histogram is red, indicating an downtrend.
FREE

Are you searching for a tool that can uncover hidden market imbalances and guide your trading decisions? Look no further than the Fair Value Gap Indicator. This powerful tool acts as a magnet, pulling the price back to its starting point before making a move. By identifying these gaps on charts, you can take advantage of bearish bias trades and predict potential future price movements with greater accuracy. Created by a three-candle sequence, the Fair Value Gap Indicator is suitable for both bul

Just an excellent arrow indicator with 96 percent accuracy. It uses trend moving averages to detect trend direction change and alert with corresponding arrow. It does not repaint and the alert is optional on the basis of current bar or previous bar. Please this indicator is not responsible for every of your trading position and it must be used in conjunction with other indicators to make trading.

Introducing our cutting-edge product, an innovative MACD Oscillator with a dynamic level enhanced by a decimal point Moving Average (MA) also with the versatility of multiple moving average modes. This advanced trading tool brings precision and flexibility to your technical analysis, offering a seamless experience for traders seeking a competitive edge in the financial markets.
Key Features: Dynamic Level Precision Our MACD Oscillator is equipped with a dynamic level feature, providing traders
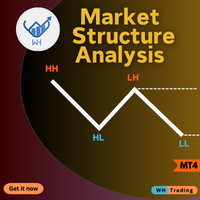
Are you tired of missing crucial market movements? Do you wish for a tool that not only identifies swing points but also provides insights into price action movements?
Look no further – our Market Structure Analysis indicator is here to revolutionize the way you analyze markets on MQL5! MT5 Version : WH Market Structure Analysis MT5 Key Features:
Swing Point Detection: Our indicator excels at identifying significant swing points in the market, helping you understand key turning points with p

تمكين الصفقات الخاصة بك مع مؤشر الأمل الجيد تحقيق التكامل لنقاط دخول قوية إذا كنت تبحث عن طريقة لتحسين تداولك في الفوركس، فإن مؤشر الأمل الجيد موجود هنا لإرشادك. يتميز هذا المؤشر بقدرته على الدمج الفعال لمختلف المؤشرات المعروفة، مما يؤدي إلى نقاط دخول قوية وتحليل شامل للسوق. ما الذي يميز الأمل الجيد؟ <أ ط=0>1. تكامل المؤشر: تتفوق شركة Hope Good في استخدام مجموعة متنوعة من المؤشرات المعروفة ودمجها بشكل فعال، مما يوفر لك تحليلًا شاملاً للسوق. <أ ط=0>2. نقاط الدخول القوية: يعمل المؤشر على توليد نق
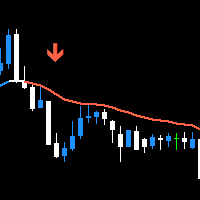
Trend Swift is the trend finding indicator that can estimate the trend volume for you. It help you seeking for the possible trend reversal so you can enter the trade with confident. Because it's indicator you can trade with your decision and really safe to use with any Prop Firms without worry about the rule that doesn't allowed to use EA to trade. This indicator isn't the the normal indicator that just blindly follow EMA, it's the trading system that surely find major trend with EMA but measur

Se você está utilizando o Inside Bar no TradingView, onde detectar inside bars é fácil e reconfortante, mas não o encontra no mercado MQL, sua busca termina aqui. Por que InsideBar Highlight? Tão fácil quanto o ABC: Inside bars simplificado. Nossa ferramenta foca no corpo da vela, para que você veja o que importa sem complicações. Seu estilo, sua escolha: Gosta colorido ou tudo igual? Você decide. Identifique movimentos para cima ou para baixo sem esforço. Ajusta como uma luva: Nosso destaque nã
FREE

O Perfil de Volume se destaca como uma ferramenta analítica excepcional, proporcionando aos traders uma visão detalhada da dinâmica do mercado, capturando o fluxo contínuo das flutuações de preços ao longo do tempo. Esta representação gráfica ao vivo organiza dados de leilão, revelando padrões de comportamento coletivo inerentes aos movimentos do mercado. No seu núcleo está a Área de Valor, que encapsula a faixa de preço que abriga 68% da atividade de negociação de um dia. Esta zona, equivalente

Este código foi originalmente publicado pela LuxAlgo a partir de outra linguagem de programação.
Tem capacidades aceitáveis de previsão de tendências que podem ser usadas para muitos fins comerciais:
Este indicador baseia-se nas suavizacoes de Nadaraya-Watson postadas anteriormente. Aqui criamos um indicador de envelope baseado no Kernel Smoothing com alertas integrados de cruzamentos entre o preço e as extremidades do envelope. Ao contrário do estimador Nadaraya-Watson, este indicador seg

O indicador para Opções Binárias e Forex "Highway profits" é baseado no princípio de encontrar o preço atrás das linhas do canal. Depois que o preço sair do canal e gradualmente começar a retornar a ele novamente, é quando os sinais aparecerão. Negociar esse indicador é muito fácil e conveniente. E eles podem ser negociados até mesmo por um comerciante iniciante ou comerciante com muitos anos de experiência.
Para cada ativo, você precisa selecionar suas próprias configurações. Por exemplo, o

O indicador é traduzido de outra linguagem de programação para MQL. O RTI é uma ferramenta poderosa para identificar a tendência do gráfico de uma forma oscilante.
Aqui estão algumas notas do programador original:
Visão Geral O Índice de Tendência Relativa (RTI) desenvolvido por Zeiierman é uma ferramenta inovadora de análise técnica projetada para medir a força e a direção da tendência do mercado. Ao contrário de alguns indicadores tradicionais, o RTI possui uma capacidade distinta de se a

Level Breakout Indicator é um produto de análise técnica que funciona a partir dos limites superior e inferior, que pode determinar a direção da tendência. Funciona na vela 0 sem redesenhar ou atrasos.
Em seu trabalho utiliza um sistema de diversos indicadores, cujos parâmetros já foram configurados e combinados em um único parâmetro - “ Scale ”, que realiza a gradação dos períodos.
O indicador é fácil de usar, não requer nenhum cálculo, usando um único parâmetro você precisa selecionar a grad
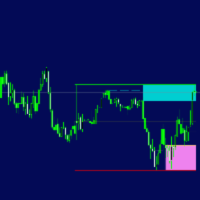
1. Updated usage instructions in blog below: Smart Market Structure Trading System and Automatic Scanner - Trading Systems - 13 October 2023 - Traders' Blogs (mql5.com) https://www.mql5.com/en/blogs/post/754495 2.1 YouTube video link for updated Panel control and new features: https://youtu.be/LM699E7JS3E 2.2 YouTube video link for feature introduction: https://youtu.be/tMU04wo0bc8 3. Smart Money Concepts, Support and Resistance, Buy Side Liquidity, Sell Side Liquidity, Monthly Highs/Lows, W
FREE

This is the best Support and Resistance Indicator on the market, and it shows both confirmed Support and Resistance as well as Retests. Support & Resistance: Support marks where buying demand halts price declines, acting as a safety net. Resistance caps price surges, driven by selling pressure. Traders leverage these levels to predict reversals, plan entries, exits, and manage risks, making them trading's fundamental guideposts. You can also find Premium and Discount Levels, Strong High/Low, Wea
FREE

up down stars indicator is no repaint indicator. it hold long way to signals. suitable all pairs and all timeframes. it needs at least 1000 bars on charts. 1 is critical level for signals. if red line reach 1 it gives red star to sell.. if blue line reach 1 it gives blue star to buy.. signals comes mostly exact time. sometimes lower timeframes it makes consecutive signals.
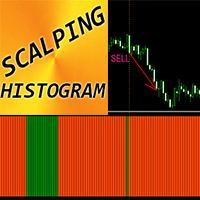
Indicador Forex "Histograma de Scalping" para MT4
O indicador Scalping Histogram pode ser usado para procurar sinais de entrada na direção principal do impulso do preço após uma pequena correção de preço O histograma Scalping pode ter 2 cores: laranja para impulso de baixa e verde para impulso de alta. Depois de ver pelo menos 10 barras consecutivas do histograma da mesma cor, significa que ocorre um forte impulso O sinal de entrada é uma coluna com cor oposta no histograma e a próxima coluna

Indicator is converted from another programming language code by programmer " sbtnc ". MQL version is simplified to be more useful by less settings complexity. There is some clues from programmer about indicator: The indicator tracks and reports the percentage of occurrence of daily tops and bottoms by the time of the day. At certain times during the trading day, the market reverses and marks the high or low of the day. Tops and bottoms are vital when entering a trade, as they will decide if y
FREE

Overview Automated smart money market structure identification following smart money concept and inner circle trader concept, it gives an unprecedented edge on your smart money and market structure analysis by automatically identifies valid market structure using smart money concept: Identify impulsive and corrective moves Identify valid pullbacks built by impulsive and corrective market moves Idenitfy bearish or bullish leg and their inducements for smart money concept Identify valid market st

Apresentando ISIS SCALPER para MetaTrader 4: Inovação além do tradicional! Descubra o futuro das estratégias de negociação com o nosso indicador inovador, cuidadosamente concebido para transcender as limitações dos produtos convencionais. Este não é apenas mais um indicador, mas uma ferramenta flexível e poderosa que permite aos traders explorar todo o potencial do mercado. Recursos excepcionais: Versatilidade ilimitada: Projetado para se adaptar a qualquer ativo e período de tempo, nosso indic

ADX MA: The Ultimate Trend Strength Guide
In forex trading, the Average Directional Index (ADX) is a vital indicator for gauging trend strength. Here's a streamlined approach to using ADX for effective trading:
1. Add ADX to your forex chart. 2. Interpret ADX values: <20 is weak, >40 is strong. 3. Identify trend direction: +DI above -DI indicates an upward trend, and vice versa. 4. Execute trades based on ADX and trend: Strong up trend, consider buying; strong down trend, consider selling;
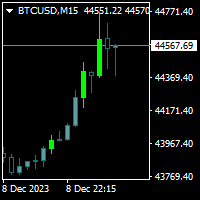
Trendfinder MA Pro are based on Colored candlesticks showing the trend based on two Moving Averages as Signal and two Moving Averages as a Buy and Sell Zone, the slope of the slow Signal moving average and ATR and Volume increasing. This indicator will give you the color change on the next bar on the confirmation candle and will provide alert on Buy and sell signal, when it enters the buy and sell zone and when the market test the buy or sell zones as support or resistance and will never repain
FREE

TREND HARMONY MT4 – Multi Timeframe Trend and Phase and Pullback Level Visualizer indicator for Metatrader4 The TREND HARMONY indicator automates deep trend analysis and generates visualizations for you. Take control of your trades by eliminating uncertainty! Revolutionize your trading experience with precision and insight through the TREND HARMONY Multi Timeframe Trend Indicator – your ultimate MT4 trend visualization indicator. Are you tired of missing trading opportunities or consistently e

Default settings:XAUUSD(GOLD)M1,M5,M15 No repaint, no redraw, no recalculate Can be optimized in all pairs You can fully optimize it and apply it to your strategy You can use it alone or in addition to your strategy. Suitable for beginners You will see the trading zones and identify the most profitable points to open positions. To open an order, the price must be in the yellow zone Full entry points, 5 different take profit zones https://www.mql5.com/en/users/ummuhan/seller For your questions an

The "Trend Edges" indicator determines whether the trend is rising or falling. It is suitable for any time frame (tested on DAX).
The indicator should be treated like Bollinger Bands, meaning that if it breaks out upwards, you can buy with a stop loss below the lower edge.
Find a trending pair, index or CFD. Additionally :
-Sound alert on trend change.
-Alert Notification
-Alert Notification on your mobile phone Check my other indicator "Trend Edges histogram"
FREE

This indicator is not only for trading but also for learning, thanks to it, you can learn to identify trend, support and resistance.
You've probably heard about the Dow trend theory, where higher highs and higher lows indicate an uptrend, and lower highs and lower lows indicate a downtrend. This indicator determines this trend based on the Dow Theory. You just need to enter a number representing the number of candles between extremes. The optimal solution is the number 3 (H1 TF), unless you
FREE

This indicator is an addition to "Trend Edges."
The "Trend Edges histogram" indicator determines whether the trend is rising or falling. It is suitable for any time frame (tested on DAX).
Find a trending pair, index or CFD. Additionally :
-Sound alert on trend change.
-Alert Notification
-Alert Notification on your mobile phone Check my other indicators.
FREE

Arrow signal indicator for scalping Has three sensitivity levels
Quickly detects changes in price direction and provides signals to open positions Equipped with built-in audio and visual alerts about trend changes. Can send notifications to a smartphone or email. Works on all timeframes, all currency pairs, metals, indices and cryptocurrencies. Can be used when working with binary options.
Distinctive features Does not redraw; Three sensitivity options; Three types of alerts; Simple and cl

You've probably heard about the Dow trend Theory, where higher highs and lows indicate an uptrend, and lower highs and lows indicate a downtrend. This indicator determines this trend based on the Dow Theory. You just need to enter a number representing the number of candles between extremes. The optimal solution is the number 3, unless you want to have the trend from M5 but you're on M1, then you need to multiply this number by 5. Check various combinations to trade with the trend. In the scree
FREE

Pivots Indicator Traders have been using this indicator for a long time, but the main difference or might better call it betterment applied to well known pivots indicator is that you can change how the pivot can be illustrated. There are two ways to get the pivots on the chart. you can use either number of candles or the movement of the market using points of retracement. you can find out more on the video. furthermore pivots lines can be drawn to see the possible support and resistance prices w

QuantumAlert Stoch Navigator is a free indicator available for MT4/MT5 platforms, its work is to provide "alerts" when the market is inside "overbought and oversold" regions in the form of "buy or sell" signals. This indicator comes with many customization options mentioned in the parameter section below, user can customise these parameters as needful. Join our MQL5 group , where we share important news and updates. You are also welcome to join our private channel as well, contact me for the p
FREE

The Starting Points indicator for MetaTrader 4 is a technical analysis tool that shows the monthly, weekly, and daily starting points, as well as the 1000-point and 500-point levels, in the forex market. The indicator is displayed as a series of horizontal lines that represent the starting points and levels. Benefits of Using the Starting Points Indicator Identify potential trend changes: The Starting Points indicator can help traders identify potential trend changes by highlighting areas wher
FREE

This indicator will show yesterday and today high low, very useful to understand the market sentiment. To trade within the range/ break out. Previous day low- can act as support- can used for pull back or break out Previous day high- can act as resistance- can used for pull back or break out The previous day high low breakout strategy refers to the day trading technique that provides traders with multiple opportunities to go either long or short . The main idea is to identify the trend in its m
FREE

Just another plain Super Trend indicator.
On this one i have added another buffer (on index 2) which can be used on EA; the values is -1 to identify a bearish trend while for bullish trend the value is 1.
Here a code snippet:
int trend = ( int ) iCustom ( NULL , Timeframe, "SuperTrend" , Period , Multiplier, 2 , 1 ); It work on every timeframe.
If you need help to integrate it on your EA, don't hesitate to contact me.
FREE

The Dot on Histogram Trend indicator is a straightforward tool in forex trading. When used in conjunction with other indicators, it can be highly rewarding.
The indicator consists of a blue and red histogram, representing positive and negative territories, respectively. Buy opportunities arise when the histogram is positive, while sell opportunities emerge when it's negative.
Signal Steps:
1. Dot at Zero Level: - Green Dot: Indicates a clear uptrend; take action. - Red Dot: Do nothi

FusionAlert StochRSI Master is an indicator available for MT4/MT5 platforms, it is a combination of RSI & Stochastic indicator which provide "alerts" when the market is inside "overbought and oversold" regions combined for both indicators, results in more precise and accurate signals to be used as a wonderful tool, in the form of "buy or sell" signals. This indicator comes with many customization options mentioned in the parameter section below, user can customise these parameters as needful. Jo
FREE

QuantumAlert RSI Navigator is a free indicator available for MT4/MT5 platforms, its work is to provide "alerts" when the market is inside "overbought and oversold" regions in the form of "buy or sell" signals. This indicator comes with many customization options mentioned in the parameter section below, user can customise these parameters as needful. Join our MQL5 group , where we share important news and updates. You are also welcome to join our private channel as well, contact me for the pri
FREE

This indicator allows you to overlay three different moving averages on the chart simultaneously. Each of these moving averages has additional settings such as: -Time frame
-Shift
-MA method
-Applied price
Using this indicator, you can easily set up three moving averages and find the one that suits you the best. You can also use this indicator to determine the trend when the moving averages cross.
FREE

The risk-to-reward ratio is used for assessing the potential profit (reward) against the potential loss (risk) of a trade. Stock traders and investors use the R/R ratio to fix the price at which they'll exit the trade, irrespective of whether it generates profit or loss. A stop-loss order is generally used to exit the position in case it starts moving in an opposite direction to what a trader anticipated.
The relationship between the risk and reward helps determine whether the potent
FREE
Você sabe por que o mercado MetaTrader é o melhor lugar para vender as estratégias de negociação e indicadores técnicos? Não há necessidade de propaganda ou software de proteção, muito menos problemas de pagamentos. Tudo é providenciado no mercado MetaTrader.
Você está perdendo oportunidades de negociação:
- Aplicativos de negociação gratuitos
- 8 000+ sinais para cópia
- Notícias econômicas para análise dos mercados financeiros
Registro
Login
Se você não tem uma conta, por favor registre-se
Para login e uso do site MQL5.com, você deve ativar o uso de cookies.
Ative esta opção no seu navegador, caso contrário você não poderá fazer login.