Conheça o Mercado MQL5 no YouTube, assista aos vídeos tutoriais
Como comprar um robô de negociação ou indicador?
Execute seu EA na
hospedagem virtual
hospedagem virtual
Teste indicadores/robôs de negociação antes de comprá-los
Quer ganhar dinheiro no Mercado?
Como apresentar um produto para o consumidor final?
Novos Indicadores Técnicos para MetaTrader 4 - 22

The Levels indicator has been created to simplify the process of plotting support and resistance levels and zones on selected timeframes. The indicator plots the nearest levels of the selected timeframes, which are highlighted in different colors. It significantly reduces the time needed to plot them on the chart and simplifies the market analysis process. Horizontal support and resistance levels are used to identify price zones where the market movement can slow down or a price reversal is lik

Introducing Auto Trendline Pro : Your Ultimate Trading Companion Are you tired of manually drawing trendlines on your forex charts? Do you wish for a tool that can simplify your trading while providing timely alerts? Look no further, because Auto Trendline Pro is here to revolutionize your trading experience. In the fast-paced world of forex trading, staying ahead of the curve is essential. Identifying trends, both upward and downward, can be a game-changer. This is where Auto Trendline Pro s
xTrend The trend becomes obviously! Advangtage ・The trend becomes obviusly:Connect different color and width rise line,fall line and range line to present the overall trend of the period from spefied past time to now.It's usefull for speedy discretionary trading! ・Pips can be displayed:Displaying pips to help to know how much changed in that line obviously and immediately! ・Simply to setting:Only few settings about the period,the color and width,and whether to display pips. ・Unique algorith

This is the Full Version, to get the free version please contact me. The free version works on “GBPCHF” charts. All symbols and time frames scanner. Harmonic Pattern
Harmonic patterns are used in technical analysis that traders use to find trend reversals. They are considered one of the most accurate technical analysis tools, as they allow traders to predict the future price movement direction and the potential trend targets. Also, unlike many other technical tools, the number of false signal

The indicator is specially designed for the trading utility Trade Shell (included Trade Shell SMC ) to get it working on visual strategy tester.
Backtest your trading ideas and indicators. Run Trade Shell on visual tester and then put this indicator on the chart. After that you will be able to control all functions of the Trade Shell as well as with live using! It does not work live! Use it with visual tester only. It does not require to set any setting on input parameters.
Have a good luc
FREE

Tester Periods is the useful indicator for visual strategy tester which extend chart periods. Its designed for the trading utility Trade Shell (included Trade Shell SMC ).
Run the Trade Shell on the visual tester. Then put the Tester Periods indicator on the chart. If you wanna see timeframes M1, M5, M10, M15 , for example, then you have to run visual tester on M1 and to define multipliers like that: TimeFrame_Periods_Multiplier = 1,5,10,15 If you wanna see timeframes M5, M20, M30, H1, fo
FREE
Drawdown Alerts Free ! Meta Trader 4 Indicator. Please leave a review about this product to help other users benefit from it. This Drawdown Alerts indicator shows the drawdown percentage in real time and alerts you when the limit you specify is reached. Calculation of drawdown depends on the amount of the trade balance. You can customize Drawdown Alerts for Corner - Left , Right , Up , Down X Y Color Number of decimal digits Popup messages and sound - Turn on / off notifications Notification
FREE
The indicator determines the best moments for entering the market.
It is written on the basis of well-known indicators such as Alligator and CC I. For fine-tuning, it contains all the parameters of parents. The indicator works on all timeframes.
The basic setting of the indicator is performed by changing the values of two parameters "Precision" and "CCI Period". All other parameters can be left unchanged.

This is the Full Version, to get the free version please contact me. The free version works on “USDJPY” charts. All symbols and time frames scanner. Contact me after payment to send you the User-Manual PDF File. OVER and UNDER
Over & Under pattern is an advanced price action trading concept in the trading industry. The Over & Under pattern is more than a confluence pattern or entry technique than a trading strategy. It is a reversal pattern that is created after a significant obvious trend. I

Recommended on M15 and higher timeframes
Sends alerts and notifications when the zone is create
Sends alerts and notifications if zones are retested
You will see the trading zones and identify the most profitable points to open positions. The indicator marks the supply and demand zones.
With this show you will now make profitable trades that will set the trends.
Shows all support and resistance zones.
Can work in all time zones.
No need to mess with complicated settings, all setti
FREE

The Multi-Timeframe High Low Points (MTF High Low Points) indicator is a powerful tool for traders using MetaTrader 4 (MT4) to analyze price movements across different timeframes. This versatile indicator helps traders identify significant support and resistance levels by displaying the highest and lowest price points within a specified number of bars on multiple timeframes simultaneously. Key Features: Multi-Timeframe Analysis: MTF High Low Points allows traders to monitor high and low price le
FREE

The KT 4 Time Frame Trend is an invaluable forex indicator for traders seeking to identify the trend direction across 4-time frames accurately. This innovative indicator allows users to simultaneously observe and analyze price trends across four different timeframes. Whether you're a beginner or an experienced trader, this tool offers an enhanced understanding of trend dynamics, leading to improved trading strategies on your trading platform. The capability to concurrently monitor multiple timef

The Awesome Cross Trend Signal Indicator is a powerful tool designed to assist traders in making informed decisions in the financial markets. This advanced indicator leverages cutting-edge algorithms and technical analysis to identify potential entry points with high accuracy.
Features: 1. Precision Entry Points: The indicator generates precise arrow signals on the chart, highlighting potential entry points for various trading strategies.
2. Trend Identification: By analyzing price mov
The Real Strong Signal Signal Indicator is a powerful tool designed to assist traders in making informed decisions in the financial markets. This advanced indicator leverages cutting-edge algorithms and technical analysis to identify potential entry points with high accuracy.
Features 1. Precision Entry Points: The indicator generates precise arrow signals on the chart, highlighting potential entry points for various trading strategies.
2. Trend Identification: By analyzing price movem
Nombre del Indicador: Two Lines Color 1 Telegran:13 Crow Trading Club
Descripción: Este indicador personalizado para MetaTrader 4, "Two Lines Color 1", es una herramienta de análisis técnico diseñada para ayudarte a identificar oportunidades de trading en los mercados financieros. Este indicador utiliza dos Medias Móviles Simples (SMA) de diferentes períodos y las representa en el gráfico con dos líneas de colores distintos.
Las características clave de este indicador son las siguientes:
FREE

Nombre del Indicador: Two Lines Color II Descripción: El indicador "Two Lines Color II", desarrollado por 13 Crow Trading Club, es una versión más rápida de su predecesor, el "Two Lines Color 1". Este indicador ha sido diseñado para brindar señales aún más tempranas sobre posibles cambios de tendencia en el mercado financiero. Características Principales: Mayor Velocidad de Señales: Two Lines Color II ofrece señales más rápidas en comparación con su versión anterior. La rápida velocidad de las s
FREE
The KT Risk Management Indicator provides a comprehensive overview of the profit/loss and risk management characteristics of your Metatrader account, offering valuable insights and information. It efficiently categorizes the displayed information at account and symbol levels, ensuring a clear and organized presentation of crucial data. Risk is inherent when trading the Forex market - a reality that seasoned traders acknowledge and beginners quickly realize. To succeed in this volatile market, t

The KT Trades Info indicator is useful for traders wishing to stay informed about their trading performance. This indicator provides real-time updates on the profitability of all ongoing and completed trades, enabling traders to make well-informed decisions. By incorporating key financial metrics, it provides a comprehensive picture of a trader's financial status at a glance. This means traders can monitor their performance with increased accuracy and precision, facilitating better risk manageme
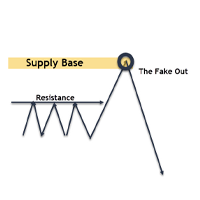
Fakeout Detector Indicator The "Fakeout Detector" indicator is a tool designed to assist traders in identifying potential false price movements (fakeouts) in the financial markets. A fakeout is a condition where the price of an asset appears to be moving in one direction but then reverses, causing losses for traders who incorrectly take positions. This indicator helps traders avoid or anticipate fakeouts by identifying key points in price movements. Indicator Output Functions: Arrow Up (Upward A

Title : UT_Bot - ATR-Based Trading Indicator Introduction : Discover the power of "UT_Bot," the ultimate trading indicator that leverages the Average True Range (ATR) to provide unparalleled accuracy in your trading decisions. If you're seeking a more reliable alternative to the Super Trend indicator, look no further. UT_Bot is your key to precision trading. Key Features : ATR-Powered Precision: UT_Bot uses the ATR to deliver accurate signals that adapt to market volatility. Enhanced Trend Detec

Title : Market Bias Indicator - Oscillator-Based Trading Tool Introduction : Discover the potential of the "Market Bias Indicator," a revolutionary oscillator-based trading tool designed for precise market analysis. If you're in search of a robust alternative to traditional bias indicators, your quest ends here. Market Bias Indicator offers unparalleled accuracy in identifying market sentiment and is your gateway to confident trading decisions. Recommended Trading Pairs : Market Bias Indicator i
ATR Stops is an indicator which shows Dynamic support and resistance lines by considering ATR value and also a multiplier. its highly effective to find out the trend direction and also is useful for using as stop loss levels. it could be used in different ways one usual way is to buy when line becomes green and sell when it becomes red. when its combined with money management rules and risk reward considerations there is good results.

Pivot Point Super Trend is another type of famous super trend indicator which is equipped with pivot points in different way. this indicator used to be available in the Trading view and this is converted from there to the MT4 language. MT5 version of the indicator is also available and you can find in my products. there are also buy/sell signals shown on the screen.

Pure Safe Trend indicator is designed for signal trading. This indicator generates trend signals.
It uses many algorithms and indicators to generate this signal. It tries to generate a signal from the points with the highest trend potential.
This indicator is a complete trading product. This indicator does not need any additional indicators.
The indicator certainly does not repaint. The point at which the signal is given does not change.
Features and Suggestions Time Frame: H1

Indicador: Engulfing Candle Strategy El indicador "Engulfing Candle Strategy"! Este indicador personalizado para MetaTrader 4 identifica y resalta automáticamente las formaciones de velas "Engulfing", una poderosa señal técnica utilizada por traders de todo el mundo. ¿Qué es una vela "Engulfing"? Una vela "Engulfing" es una formación de dos velas consecutivas en un gráfico de precios. La primera vela es más pequeña y está completamente contenida dentro del rango de la segunda vela, que es sign
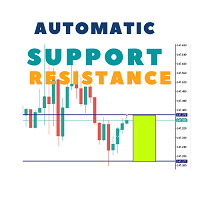
This Automatic support/resistance indicator calculates various peaks and troughs of the price action, identifies relevant levels and draws support and resistance automatically. It uses the built-in "ZigZag" indicator in Metatrader as a data source hence, very much accurate indicator. The support and resistance lines are contineusely updated as new levels and formed. The indicator has only 5 parameters to set, and mostly it can be used with the default values: The description of the settings is

Apresentamos o ON Trade Waves Patterns Harmonic Elliot Wolfe, um indicador avançado projetado para detectar diversos tipos de padrões no mercado, usando métodos manuais e automáticos. Aqui está como ele funciona: Padrões Harmônicos: Este indicador pode identificar padrões harmônicos que aparecem em seu gráfico. Esses padrões são essenciais para traders que praticam a teoria de negociação harmônica, conforme popularizada no livro de Scott Carney "Harmonic Trading vol 1 e 2". Seja desenhando-os m

This product is a part of ON Trade Waves Patterns Harmonic Elliot Wolfe
you can test free version on EURJPY from this link Wolf Waves Indicator
Descubra as Wolf Waves - Sua Ferramenta de Negociação Definitiva! Você está em busca de uma ferramenta poderosa para identificar facilmente as Wolf Waves em qualquer período de tempo? Não procure mais! Nosso indicador de Wolf Waves faz esse trabalho com facilidade. Veja por que ele é perfeito para você: Recursos Principais: Detecção Automática: Nos

Este indicador é baseado no famoso indicador fractal mas com muita customização e flexibilidade,
esta é uma ferramenta poderosa para identificar reversões de tendências e maximizar seu potencial de lucro.
Com seus recursos avançados e interface amigável, é a escolha definitiva para traders de todos os níveis. Versão MT5: Ultimate Fractals MT5 Características :
Contagem customizável de velas Fractal. Linhas de reversão. Configurações personalizáveis. Interface amigável. Parâmetros princi
FREE
O indicador "Signal histogram scalper" é um indicador geral na forma de histograma e sinais sem redesenho ou atraso. O indicador "Signal histogram scalper" mostra no gráfico os melhores pontos de entrada ao longo da tendência. É melhor usá-lo em conjunto com outros indicadores de tendência como filtro. O indicador mostra bons resultados no período M5. O sinal é gerado após o fechamento da vela e aparece na forma de círculos verdes e vermelhos. O indicador "Signal histogram scalper" destina-se ao

Indicador Técnico para Detectar Padrões de Ação de Preço Fortes: Pin Bar, Inside Bar e Outside Bar Introdução: No âmbito da análise técnica, os padrões de ação de preço são indicadores vitais de possíveis movimentos de mercado. Desenvolvemos um indicador técnico sofisticado que agiliza a identificação de padrões sólidos de ação de preço em gráficos. Nosso indicador é especializado em detectar três padrões essenciais: Pin Bar, Inside Bar e Outside Bar. Principais Padrões Detectados: Pin Bar: O pa

Apresentamos o "ON Trade VSA" - Sua Ferramenta Definitiva para Análise de Volume e Distribuição! Desbloqueie o poder da Análise de Volume e Distribuição (VSA) com nosso indicador avançado - "ON Trade VSA". O VSA é uma metodologia poderosa usada por traders para avaliar a força do mercado, identificar tendências e tomar decisões informadas. Vamos explorar as principais características que tornam o "ON Trade VSA" uma ferramenta indispensável para o seu arsenal de negociação: Candles de Volume Mult

The Cyber Trend indicator analyzes the price action and if there is a temporary weakness in the trend, you can notice it from the indicator readings, as in the case of a pronounced change in trend direction. Entering the market is not difficult, but staying in it is much more difficult. Keeping up with the trend will become much easier with the Cyber Trend indicator! This indicator allows you to analyze historical data and, based on them, display instructions to the trader for further actions.
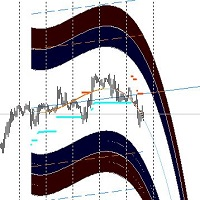
The forex market, like nature, moves in cycles — oscillating between peaks and troughs, bullish runs and bearish retreats. But what if you had a compass to chart these cycles and anticipate every turn? Austin Market Levels Indicator is crafted to be that compass, designed meticulously to decode market cycles and pinpoint profit opportunities.
---
Mastering Market Cycles
The secret to consistent forex trading success often lies in understanding the underlying patterns. Austin Market

The indicator displays overbought and oversold levels, calculating them using the Fibonacci golden ratio formula.
It enables both trend-following and counter-trend trading, accommodating breakouts and rebounds from these levels.
It operates on all timeframes, across various currency pairs, metals, and cryptocurrencies.
Suitable for binary options trading.
Key Features: Based on the Fibonacci golden ratio Shows overbought and oversold levels Suitable for market and pending orders Sim
FREE

The " Countdown Candle Timer " indicator is a visual tool for the MetaTrader 4 platform that displays an accurate countdown of the time remaining until the next candle on the chart. It provides real-time information about the remaining duration of the current candle, allowing traders to track time precisely and optimize their trading decision-making. The indicator can be customized in terms of color, font size, and position on the chart, providing flexibility and convenience to the user. You can
FREE

The Trends Trg indicator determines the prevailing trend. They help to analyze the market at the selected time interval. Easy to set up and works on all pairs and all time frames. Trend indicators make it possible to classify the direction of price movement by determining its strength. Solving this problem helps investors enter the market on time and get a good return.
It is extremely important for any trader to correctly determine the direction and strength of the trend movement. Unfortunate

The indicator provides a superior alternative to price action analysis. It enables the identification of normalized patterns, which are then transformed into a graphical representation to forecast future steps within a time series. In the top-left corner, you'll find information regarding the expected prediction accuracy, determined through a complex MSQE calculation. You have the flexibility to adjust the time window, making it easy to validate the indicator's performance. Additionally, you can

In the ever-evolving world of Forex trading, understanding the different trading sessions is paramount to making informed trading decisions. Each trading session brings its own unique characteristics, opportunities, and challenges, and recognizing these can greatly enhance your trading strategies. Whether you're a novice or a seasoned trader, the Forex market's three main trading sessions – Asian, London, and New York – are crucial milestones that dictate market behavior and potential trade set
The "REVERSAL" indicator is a pointer indicator without redrawing and delay. The "REVERSAL" indicator shows the best trend entry points on the chart. It is better to use it in tandem with other trend indicators as a filter. The indicator shows good results on all timeframes. The signal is generated after the candle closes and appears as blue and red arrows. If you reduce the amplitude, then you can trade in the style of scalping
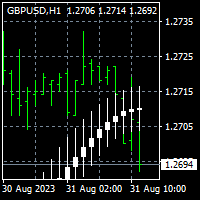
To get access to MT5 version please click here . This is the exact conversion from TradingView: "Smoothed Heiken Ashi Candles v1" by " jackvmk ". This is a light-load processing and non-repaint indicator. All input options are available. Buffers are available for processing in EAs. You can message in private chat for further changes you need. This is not a multi time frame version.
KT Momentum Histogram provides traders with a visualization of the momentum of a particular asset, which helps determine the strength and potential direction of a market trend. The indicator calculates and operates based on momentum in trading.
What Exactly is a Momentum Histogram
Momentum is the rate of acceleration of an asset's price or volume. In other words, it measures the speed at which the price of an asset is moving in a particular direction over a specific period of time. Positive
The KT Pull Back Arrows shows the pull back arrows using the RSI (Relative Strength Index) to identify suitable pull-back entry areas within the overbought and oversold zones. The indicator effectively pinpoints favorable moments for initiating pull-back trades by leveraging these RSI thresholds. Trend trading is often considered the most profitable strategy in the Forex market. It is the equivalent of riding the wave, going with the flow, and capitalizing on market momentum. However, timing is
The KT Raff Channel is an enhanced and refined iteration of the original Raff channel concept pioneered by Gilbert Raff in 1996. This indicator builds upon Raff's initial work, incorporating modifications and advancements to provide traders with a more sophisticated and powerful tool. Gilbert Raff, a renowned name in the field of financial market analysis, is the developer of the Raff Regression Channel. This technical tool is designed for discerning and validating possible market price trends.

Attraverso l'indicatore Savius Zone potrai finalmente: Definire delle zone oggettive da attenzionare Ridurre la discrezionalità Filtrare i tuoi pattern operativi Avvalerti di un metodo comprovato Qui di seguito alcune funzioni dell'indicatore Savius Zone: Zone Buy & Sell L’indicatore fornisce delle zone buy e sell ogni giorno dopo l’apertura del mercato cash sui seguenti mercati: DAX, S&P500, Nasdaq, Russel2000, Dow Jones
Occasioni giornaliere Savius Zone fornisce occasioni di trading tutti i

This is the Full Version, to get the free version please contact me.
The free version works on “AUDNZD” and “XAUUSD” charts.
All symbols and time frames scanner
Head and Shoulder
One of the most popular Price Action patterns is the Head and Shoulders pattern. The pattern has three local tops that resemble the left shoulder, head, and right shoulder. The head and shoulders chart pattern appears in all kinds of markets, including Forex, cryptocurrency, commodities, stocks, and bonds. The
The KT Knoxville Divergence is a powerful tool that reveals unique price divergences in a financial instrument by employing a carefully crafted combination of the Relative Strength Index (RSI) and a momentum oscillator. This indicator effectively captures subtle variations in market dynamics and assists traders in identifying potentially profitable trading opportunities with greater precision. Knoxville Divergences is a type of divergence in trading developed by Rob Booker. Divergence in tradin

The " Multi Kernel Regression " is a versatile trading indicator that provides graphical interpretations of market trends by using different kernel regression methods. It's beneficial because it smoothes out price data, creating a clearer picture of price movements, and can be tailored according to the user's preference with various options.
What makes this indicator uniquely versatile is the 'Kernel Select' feature, which allows you to choose from a variety of regression kernel types, such
FREE

ON Trade Pivots is A technical indicator that Draws all Pivot levels depending on time frame that defined in settings.
Notes It will be good tool for all traders who use pivot levels in their trades. Let me inform you that this indicator draw this level as buffers not as objects then you can connect it easily to EA. This indicator allow you to find pivots levels for any time frame not only daily you are free to choose time frame from settings.
Parameters Use_System_Visuals - Enable /Disable
FREE

This indicator will give you entries as result of scalping strategy that will be applied on 14 symbols in same time and you are able to be notified with this entries
Note : This indicator for scalping on 5 minutes timeframe only .
How to use it :
1-Open chart and adjust settings (edit symbols names as your platform names , activate the alert system if you need it . 2-Wait for any signal you have it from this scanner you will have it as alert and as notification and you will see it on bo

This indicator gives you the signal of real cross on stochastic indicator. This indicator is easy to attach to an ea. This indicator will work best on All time frames. Arrow appears depending on many algorithms that study the cross parameters.
Indicator properties Use_System_Visuals: enable/disable visual styles. Stochastic_K_Period. Stochastic_D_Period. Stochastic_Slowing. Use_Notifications: enable/disable Push Notifications. Use_Alert: enable/disable Alerts. Use_E_Mail: enable/disable Email
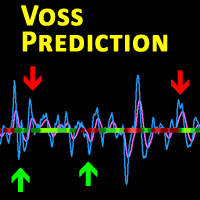
Description This is a modified version of the popular Voss Predictive Filter - A peek into the future by Dr. John Ehlers. It contains 2 lines - V-Line (blue) and F-Line (red), a trend indication and BUY/SELL signals.
Usage Buy Green dots indicate an up trend. Open a BUY position if the V-Line crosses the F-Line from below and an up trend is signaled (green dots) Close BUY position if V-Lines falls beneath F-Line again Sell Red dots indicate a down trend Open a sell position if V-Line fall
The KT Buy Sell Volume is a powerful tool traders use to gauge the strength and weakness of price movements. In the whirlwind of the Forex market, traders aim to identify and ride the waves of a bullish or bearish trend that exudes strength and potential. However, recognizing these trends necessitates a method, metric, or indicator to quantify their strength. One crucial factor that traders examine for this purpose is volume. Volume refers to the number of shares or contracts traded in a securit

Claro, aqui está a tradução para o português: Apresentando o Indicador de Astronomia para MT4: Seu Companheiro Celestial Definitivo no Trading Você está pronto para elevar sua experiência de trading a alturas celestiais? Não procure mais do que o nosso revolucionário Indicador de Astronomia para MT4. Essa ferramenta inovadora transcende os indicadores de trading tradicionais, aproveitando o poder de algoritmos complexos para fornecer insights astronômicos incomparáveis e cálculos de precisão. Um
O DYJ Peak Valley Indicator é um avançado sistema de negociação de média ponderada quadrada. Ele contém linhas de tendência futuras e ângulos de tendência, bem como a exibição do ângulo do vale de cada pico.
No final do pico do SQWMA, há uma tendência descendente,
No fundo do SQWMA, há uma tendência ascendente. Os sinais do indicador simulam as estatísticas de abertura de volume, permitindo que você tenha uma visão mais detalhada da probabilidade do sinal.
Please download the XAUUSD param
O supermercado DYJ é um sistema de transações de fusões e aquisições altamente preciso.
O indicador marca a cor do segmento longo (verde) e o segmento curto (vermelho) na média.
Horários e preços de admissão são os horários e preços das velas na interseção das linhas verde e vermelha.
A próxima entrada é o ponto de saída da ordem anterior.
Input
inpPeriod = 50 inpAtrPeriod = 5 InpLineWidth = 3 clr_buy = clrSpringGreen clr_sell = clrRed InpMup = 40

This Expert advisor does not do any trade, but it scans the whole symbols in your market watch and scan each shares one by one in different timeframes and at the end it shows you which symbol in which timeframe has a powerful engulfing candle. Furthermore, you can define a MA period and a high and low RSI limit, and it shows you which symbols in which timeframe is going to cross the adjusted moving average, and which symbol in which timeframe is going to cross high or low limit of the RSI. The

Um indicador técnico que calcula suas leituras nos volumes de negociação. Na forma de histograma, mostra o acúmulo da força do movimento do instrumento de negociação. Possui sistemas de cálculo independentes para direções de alta e baixa. Funciona em quaisquer instrumentos de negociação e prazos. Pode complementar qualquer sistema de negociação.
O indicador não redesenha seus valores, os sinais aparecem na vela atual.
É fácil de usar e não carrega o gráfico, não requer cálculos de parâmetros a

Alright. This indicator works on MT4 and is very easy to use. When you receive a signal from it, you wait for that candle with the signal to close and you enter your trade at the beginning of the next new candle. A red arrow means sell and a green arrow means buy. All arrows comes with Popup Alert like for easy identification of trade signal. Are you okay with that?
100% non repaint
Work All Major currency Pair,
1 minute time frame 1 minute expire
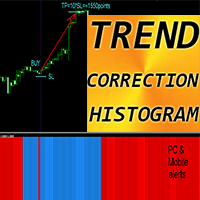
Indicador Forex "Histograma de correção de tendência" para MT4
O histograma de correção de tendência pode ter 2 cores: vermelho para tendência de baixa e azul para tendência de alta 7 colunas consecutivas do histograma da mesma cor significam o início de uma nova tendência Indicador de histograma de correção de tendências projetado com o objetivo principal - minimizar perdas e maximizar lucros Possui parâmetro - “Período”, responsável pela sensibilidade do indicador Alertas integrados para di
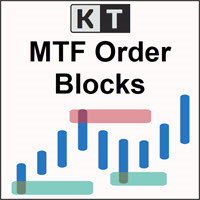
The KT MTF Order Blocks automatically plots the institutional order blocks by using a unique blend of price action with comprehensive multi-timeframe analysis. This advanced approach reveals the area of price reversal, originating from significant buy and sell orders strategically placed by major market players.
Features
Algorithmic Precision: A refined and distinctive order block algorithm meticulously crafted to precisely identify the most pivotal order blocks, often triggering price reve
Please feel free to contact me if you need any further information.
Please let me know if you have any questions.
I hope the above is useful to you. MT Sideway Filter : It is an indicator that is built to find many sideways, when a sideway is formed, the graph will jump out into a trend. After that, you can continue to strategy your trading. It's an opportunity to make good profits. indicator for trade by yourself
TRADE: Forex TIME FRAME: All Time Frame SYMBOL PAIR: All Symbol
SETTINGS
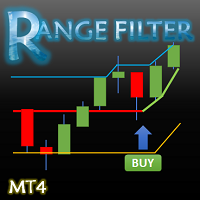
This indicator converted from 5 min Buy and Sell Range Filter - guikroth version on TradingView Popularity of the Range Filter
The Range Filter is a very popular and effective indicator in its own right, with adjustments to the few simple settings it is possible to use the Range Filter for helping filter price movement, whether helping to determine trend direction or ranges, to timing breakout or even reversal entries. Its practical versatility makes it ideal for integrating it's signals into

Channel Vertex is a price action pattern formed by price Chanel and a triangle pattern . Price channels basically indicates possible support and resistance zones around a price movement and retracement or breakout at these levels can indicate possible trend continuation or reversal .
Majority of the times price fluctuations forms triangle patterns defined by 3 vertexes , these triangle patterns most times defines a trend continuation. A triangle pattern is a trend continuation pattern tha

The Scaled Awesome Oscillator (SAO) represents a refined adaptation of the Awesome Oscillator, aimed at establishing consistent benchmarks for identifying market edges. Unlike the standard Awesome Oscillator, which records the variation in pips across different commodities, the only unchanging reference point is the zero line. This limitation hampers investors and traders from pinpointing specific levels for trend reversals or continuations using the traditional Awesome Indicator, a creation of
FREE

The SuperTrend AI indicator is a novel take on bridging the gap between the K-means clustering machine learning method & technical indicators. In this case, we apply K-Means clustering to the famous SuperTrend indicator. USAGE Users can interpret the SuperTrend AI trailing stop similarly to the regular SuperTrend indicator. Using higher minimum/maximum factors will return longer-term signals. (image 1) The displayed performance metrics displayed on each signal allow for a deeper interpretat
Perhaps you have previously read in technical analysis books about such a concept as "market slope", or "trend slope". Metatrader has such a tool as "trend line by angle". But when working on auto-scaled charts, this tool becomes completely abstract, and as a consequence, useless. The idea of this new parameter, included in the AllAverages_Speed indicator, is to give such a concept as "trend slope" specific numerical values, as well as the further use of the new parameter in work.
Modific
If you are a Price Action Trader this indicator will help you so much Every trader must have it ! I'm a trader so i know what you need ! Message me if you wanna see the video you should send me message
don't worry i will help you to learn how to use my indicators
i also have other indicators, please watch them stay tuned i also have other useful indicators and Experts Telegram ID: @forex_ex4
#forex #priceaction #indicator #mt4 #mt5 #trade #trader

Buy Sell Scalper - a signal Forex indicator for scalping. It indicates possible price reversal points to the trader. A red dot indicates downward price reversal points, while blue dots indicate upward price reversal points. Recommended currency pairs are EURUSD, GBPUSD, XAUUSD, USDCHF, USDJPY, USDCAD, AUDUSD, EURGBP, EURAUD, EURCHF. Recommended timeframes are M5, M30, H1. The signals from this indicator are also used in the operation of an automated robot: https://www.mql5.com/en/market/product
The indicator shows the current timeframe and symbol name. It is also possible to turn on the indication of time until the end of the current bar. In the settings, you can specify: - the location of the indicator in relation to the terminal window, top left, top right, bottom left and bottom right - a row of text display arrangements so that the inscriptions do not overlap each other - color - font - font size.
FREE
O Mercado MetaTrader é a única loja onde você pode baixar um robô demonstração de negociação gratuitamente para testes e otimização usando dados históricos.
Leia a visão geral e opiniões de outros clientes sobre os aplicativos, faça o download para o seu terminal e teste um robô de negociação antes de comprá-lo. Apenas no Mercado MetaTrader você pode testar um aplicativo de forma absolutamente gratuita.
Você está perdendo oportunidades de negociação:
- Aplicativos de negociação gratuitos
- 8 000+ sinais para cópia
- Notícias econômicas para análise dos mercados financeiros
Registro
Login
Se você não tem uma conta, por favor registre-se
Para login e uso do site MQL5.com, você deve ativar o uso de cookies.
Ative esta opção no seu navegador, caso contrário você não poderá fazer login.