Conheça o Mercado MQL5 no YouTube, assista aos vídeos tutoriais
Como comprar um robô de negociação ou indicador?
Execute seu EA na
hospedagem virtual
hospedagem virtual
Teste indicadores/robôs de negociação antes de comprá-los
Quer ganhar dinheiro no Mercado?
Como apresentar um produto para o consumidor final?
Novos Indicadores Técnicos para MetaTrader 4 - 16

Features:
Sharkfin Alerts Multi-timeframe Multi-currency SM TDI: To show TDI lines with sharkfin levels Zigzag MTF: To see Higher Timeframe trend Detailed blog post and extras: https://www.mql5.com/en/blogs/post/759138
Arrows works on a single timeframe and single currency. But it’s visually helps see that sharkfins. You can also get the simple arrows from mql5 site product: https://www.mql5.com/en/market/product/42405
About Scanner: It is an easy to use simplified scanner. It will show when
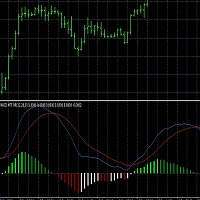
This script generates a MACD with 6 color-coded histogram bars based on the position (above or below zero) and direction (rising or falling) of the histogram. It provides multi-time frame support , allowing users to view the MACD from different time frames on a single chart. The indicator uses customizable settings for MACD periods, histogram width, and vertical scaling. This script could be useful for traders who want a visually enhanced MACD with clearer trend and momentum representation acro
FREE
Nadaraya Watson Envelope Multicurrency Scanner MT4: Key Features The Nadaraya Watson Envelope Multicurrency Scanner Dashboard provides a streamlined way to monitor crucial reversal signals across multiple currency pairs and timeframes. Built on the popular TradingView indicator known for its accurate reversal calls, this scanner adapts the same core logic into an MT4/MT5-friendly format. It focuses on short-term opportunities in lower timeframes and strong trend signals in higher ones, helping
Simple SuperTrend indicator, similar to that of TradingView's.
Links: All-In-One Supertrend MT5 Version
It has buffers for buy and sell signal, if you want to integrate this into an EA.
It helps traders easily identify trends by providing clear buy and sell signals based on price movements. Designed for simplicity, it’s easy to use and integrates well with various trading strategies, making it a great option for traders of all levels.
Happy trading!
FREE
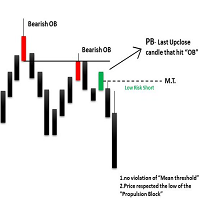
The ICT Propulsion Block indicator is meant to detect and highlight propulsion blocks, which are specific price structures introduced by the Inner Circle Trader (ICT). Note: THIS IS MTF version. Single Timeframe version avaiable at here
Propulsion Blocks are essentially blocks located where prices interact with preceding order blocks. Traders often utilize them when analyzing price movements to identify potential turning points and market behavior or areas of interest in the market.
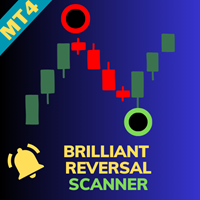
The Brilliant Reversal Multicurrency Scanner Dashboard is a powerful tool for monitoring multiple currency pairs and timeframes using the Brilliant Reversal indicator. It organizes signals in a grid format, displaying buy/sell signals with their strength: S : Strong M : Medium W : Weak You can find the MT5 version here Brilliant Reversals MultiCurrency Scanner MT5 For detailed documentation click here Brilliant Reversal Integration: Configurable parameters include Small Bar Count, Medi

This scanner uses Quarters Theory. It finds the nearest quarters to current price. And when price gets close within a few points, then it highlights and sends alerts. Features: Define Major Quarters Distance for every timeframe Option to use: Half Point between majors Quarters between half point and majors Search for nearest quarter point and price Show Highlight and send Alerts Show/Hide Quarter Lines Show/Hide Price and QP Distance
Detailed post and Extras: https://www.mql5.com/en/blogs/post/
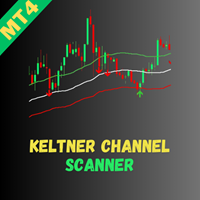
Welcome to the Keltner Channel Multicurrency Scanner , an advanced tool designed to enhance your trading by detecting Keltner Channel breakouts and real-time insights. This MT4 indicator is built to scan multiple currency pairs simultaneously, helping you capitalize on market trends more effectively. Key Features: Effortless Multicurrency Scanning
Monitor multiple currency pairs in real-time and receive instant alerts when key Keltner Channel breakout signals are detected. This allows you to re
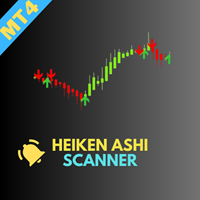
Welcome to the Heiken Ashi Multicurrency Scanner , an advanced tool designed to help traders efficiently monitor market trends using the Heiken Ashi indicator. This MT4 scanner allows you to scan multiple currency pairs simultaneously, enabling quick identification of market trends and reversal opportunities. Key Features: Effortless Multicurrency Scanning
Track numerous currency pairs in real-time and receive instant alerts when significant Heiken Ashi signals are detected. Stay ahead of marke

Leonardo Breakout SMC – Advanced Trading Indicator
Overview The Leonardo Breakout SMC is a masterpiece of precision and innovation, crafted for those who seek to understand and harness the unseen forces within the market. Just as Da Vinci observed the natural world with meticulous detail, this MetaTrader 4 (MT4) indicator reveals the hidden structures of price movement, enabling traders to capture the essence of smart money concepts (SMC) and execute flawless breakout strategies. Every eleme
FREE

Dynamic Forex28 Navigator - A ferramenta de negociação Forex de última geração. ATUALMENTE 49% DE DESCONTO.
Dynamic Forex28 Navigator é a evolução dos nossos indicadores populares de longa data, combinando o poder de três em um: Indicador Advanced Currency Strength28 (695 avaliações) + Advanced Currency IMPULSE com ALERTA (520 avaliações) + Sinais CS28 Combo (Bônus).
Detalhes sobre o indicador https://www.mql5.com/en/blogs/post/758844
O que o Next-Generation Strength Indicator oferece? Tudo

O indicador mede o desequilíbrio entre os touros e os ursos durante um período escolhido e mostra uma linha reta entre os dois pontos.
Se os touros tiverem mais volume do que os ursos, a linha fica verde. Se os ursos tiverem mais volume, a linha fica vermelha. A linha também mostra a diferença percentual no volume.
O indicador mostra os mesmos dados numa janela separada. Também é possível ver o volume dividido.
O indicador tem dois modos.
Para este efeito, existe um botão no canto superio

[As of Jan 18, downloaded by 125 traders] [ Disclaimer ] We're letting u download it for free to support the launch of the main products & training for CyberBot Members ! Hurry up download limited quota. The cool part is u can use it on your chart without having to run it with the main product. Just a heads up, though—alerts might pop up since this product isn't linked to the main one. Plus, you can experiment with it by downloading the free trial of the following main products 8 Symbols
FREE
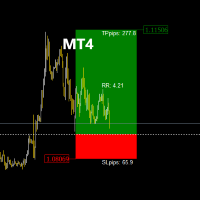
RR_TradeManager Visualizer é uma ferramenta de gestão de trades projetada para ajudar os traders a visualizar facilmente seus níveis de stop loss (SL) e take profit (TP) em um gráfico. Esta versão inicial oferece uma representação gráfica simples que mostra as zonas de SL e TP, bem como o preço de entrada. Observe que esta versão atual se concentra apenas na visualização gráfica das zonas de SL e TP como figuras no gráfico. Características da versão atual: Visualização das Zonas SL e TP: Visuali
FREE

Melhore sua experiência de trading com o indicador Your Chart! Esta ferramenta gratuita e altamente personalizável permite que os traders combinem vários períodos de tempo em uma única exibição limpa de velas, sem alterar o gráfico original. Com o Your Chart, você pode ajustar o número de barras por cada vela personalizada – por exemplo, combinar cada 18 velas de M1 em uma só para ter uma visão mais ampla das tendências do mercado. Características principais: Formação de velas personalizadas : E
FREE
Order Block Tracker is here to solve one of the biggest challenges traders face: identifying order blocks. Many traders fail to spot these critical zones, often missing out on key market entries. But with Order Block Tracker , you no longer have to worry about that. This advanced indicator automatically highlights these crucial zones for you, giving you the confidence to enter the market at the right time. MT5 Version - https://www.mql5.com/en/market/product/123362/ Key Features of Order Block
O Indicador Ephraim Umpan é um ótimo indicador para o Forex Trader que deseja fazer negociação manual. Com este indicador, cada trader obterá uma vantagem em suas negociações e terá resultados excelentes e constantes. Este indicador não é apenas uma prova de como podemos aprender com o Mercado. Além disso, este indicador é uma ótima ferramenta. Vamos utilizar esta ferramenta para gerar grandes receitas no Mercado Forex.
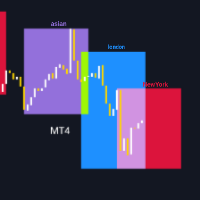
Antes de mergulhar nas funcionalidades deste indicador, por favor, classifique este produto, deixe um comentário para compartilhar sua experiência e inscreva-se na minha página para ficar atualizado com os últimos lançamentos e ferramentas. Seu apoio é valioso e me ajuda a melhorar continuamente minhas criações! Descrição: O TradingSessionVisualizer é um indicador poderoso projetado para MetaTrader 4, que oferece uma visualização clara e personalizável das principais sessões de negociação nos se
FREE
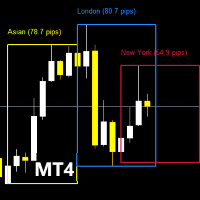
Antes de mergulhar nas funcionalidades deste indicador, não se esqueça de avaliar este produto, deixar um comentário para compartilhar sua experiência e se inscrever na minha página para ficar informado sobre as últimas atualizações e novas ferramentas. Seu apoio é inestimável e me ajuda a melhorar constantemente minhas criações! Descrição: TradingSessionPipsVisualizer - A ferramenta profissional para dominar as sessões de trading Visualize instantaneamente as sessões Forex e otimize seu tempo

Special offer! https://www.mql5.com/ru/users/bossik2810 Gold Pro Scalper
Precise entry points for currencies, crypto, metals, stocks, indices! Indicator 100% does not repaint!!!
If a signal appeared, it does not disappear! Unlike indicators with redrawing, which lead to loss of deposit, because they can show a signal, and then remove it.
Trading with this indicator is very easy.
Wait for a signal from the indicator and enter the deal, according to the arrow
(Blue arrow - Buy, Red - Sell).

An imbalance bar or candle, also called a fair value gap (FVG) or inefficiency, shows strong buying or selling in the market or weak buying or selling that causes prices to move quickly with high momentum. This is why it's an important part of price action analysis. Our indicator offers three main benefits: Clear Design: The imbalance bar is built into the candle with a simple, clean look that makes it easy for traders to spot while keeping the chart tidy. Easy to Use: A hotkey lets traders quic
FREE

This scanner is for showing Cross of various TDI elements: PriceLine, Trade Signal Line and Market Base Line And for getting alerts, so you can be prepared for finding good trade setups before they happen. It also shows TDI signals, trend, volatility and different timeframe alignment.
Detailed blog post:
https://www.mql5.com/en/blogs/post/759050
Features: Show TDI Signal and Trend Show Volatility & Overbought/Oversold Show cross between: PriceLine & TSL PriceLine & MBL MBL & TSL PriceLine and

BotM5 MT4
Exact entry points for currencies, crypto, metals, stocks, indices!
Special offer - https://www.mql5.com/en/users/bossik2810
Indicator 100% does not repaint!!!
Version MT5 - https://www.mql5.com/en/market/product/123028
If a signal appeared, it does not disappear! Unlike indicators with redrawing, which lead to loss of deposit, because they can show a signal, and then remove it.
Trading with this indicator is very easy.
Wait for a signal from the indicator and enter the deal

Este indicador irá ajudá-lo a traçar as linhas do horizonte ( Marcelo Ferreira ) do Grafico semanal. Você poderá mudar trabalhar por exemplo em M5 ou M15. As linhas semanais permanecerão lá. Analisar as tendências em gráficos semanais antes de fazer uma entrada no mercado Forex é essencial para identificar a direção predominante do mercado a longo prazo. Esse tipo de análise ajuda a evitar decisões impulsivas baseadas em flutuações de curto prazo e fornece uma visão mais clara sobre o movimento
FREE

CYCLE WAVE OSCILLATOR indicator is an indicator based on cyclical price fluctuations. This indicator can help you determine overbought and oversold levels, and help you predict price trends within the cycle. MT5 Version here! You can combine it with our indicators below to make your trading decisions more accurate: Supply Demand Ribbon MT4 Basic
Feature: - Three Trend Types: + Zero + Basic + Advanced
FREE
The Stochastic Multicurrency Scanner Dashboard MT4 is a powerful tool for monitoring multiple currency pairs and timeframes using the Stochastic oscillator. It organizes signals in a grid format, displaying each symbol’s status across timeframes from M1 to MN1. Traders can enable or disable specific timeframes to suit their strategies. You can find the MT5 version here Stochastic Oscillator Multicurrenty Scanner MT4 For detailed documentation click here Stochastic Oscillator Integration: Th
The indicator provides a moving average with buy and sell arrows
Only buy arrows are shown above the moving average and only sell arrows are shown below the moving average
Added a Rsi filter to reduce arrows
The moving average can be adjusted as preferred - Default is 200 EMA
The arrows is non repaint after close of candle to lock it in place
The arrows also has alerts if needed
Suitable to any timeframe or instrument of choice
Test in demo before purchase
Enjoy
This indicator managge all kind of ICT FVG include: FVG, SIBI, BISI, Inverse FVG. The advantage point of this indicator is mangage FVG on all timeframe. FVG - Fair value gap ICT Fair value gap is found in a “three candles formation” in such a way that the middle candle is a big candlestick with most body range and the candles above & below that candle are short and don’t completely overlap the body of middle candle. * This indicator allow filter FVG by ATR. So you can just show valid FVG which

Hello Traders, Introducing a powerful indicator designed to enhance your buy/sell decisions by combining 15 different indicators into one. This unique combination helps minimize false entries, providing you with a more reliable trading strategy. The indicator is easy to use: an upward arrow signals a buy opportunity, while a downward arrow suggests a sell. The indicator is highly versatile and can be applied to any currency pair and any timeframe. However, for optimal performance, I recommend us

The Real Cloud indicator for MT4 is a popular and useful Forex indicator. This indicator provides traders with an easy way to identify potential trading opportunities in the Forex market. The Real Cloud indicator uses a unique algorithm to analyze price action and generate signals. It is designed to identify strong trends and provide traders with an edge in their trading. The Real Cloud indicator is easy to use and requires no additional setup. Simply attach the indicator to your chart and it wi
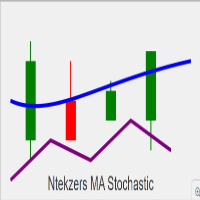
Please remember to leave a review for improvements thank you Overview of Key Functionalities: Buy Signal Conditions : The Stochastic Oscillator's main line crosses above the signal line. The closing price of the current candle is higher than the previous candle's close. The current closing price is above the EMA (Exponential Moving Average). The Stochastic value is below 50. When these conditions are met, a buy arrow is plotted, and alerts (audible or push notifications) are triggered. Sell Sign
FREE
Индикатор Order blocks Mtf строит уровни на основе smart mony(умные деньги) Строит уровни как сразу получил излом тренда, индикатор очень удобен и практичен для использование на форекс и на бинарных опционов В него в шита система поиска сигналов на касании старших уровней таким же уровней излома тренда и ретеста к среднему значению При касании уровня очень хорошо отрабатывает на бинарных опционах,
Ephraim Umpan Gold Coins Magnet Indicator is an Indicator that helps traders do the decisions. With this Indicator, Every trader will now have an edge in trading and will be more profitable in their trades. Accordingly, this indicator can help increased the winning capability of every trader. Would you like to try of this indicator? Now is your chance to do so.

Stratos Pali Indicator is a revolutionary tool designed to enhance your trading strategy by accurately identifying market trends. This sophisticated indicator uses a unique algorithm to generate a complete histogram, which records when the trend is Long or Short. When a trend reversal occurs, an arrow appears, indicating the new direction of the trend.
Important Information Revealed Leave a review and contact me via mql5 message to receive My Top 5 set files for Stratos Pali at no cost!
Dow
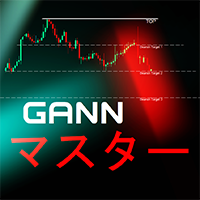
Os alvos precisos de GANN são calculados com base em seus métodos testados pelo tempo e apresentados bem à sua frente. Esta ferramenta foi projetada para tornar a negociação mais fácil e intuitiva. Ao mover a linha branca para cima ou a linha verde para baixo, você verá imediatamente por que as técnicas de GANN continuam a ser influentes no mundo do trading.
As estratégias de GANN se concentram em prever movimentos de mercado com alta precisão, e esta ferramenta traz esse poder para suas mãos

CVB Cumulative Volume Bands: Potencialize Suas Operações com Volume Acumulado! O CVB Cumulative Volume Bands é um indicador avançado projetado para traders que desejam insights precisos baseados em volume acumulado. Utilizando bandas de volume acumulado, este indicador oferece uma leitura clara das pressões de compra e venda no mercado, ajudando a identificar reversões e movimentos fortes. Cumulative Volume Bands for MT5 !
Principais Características: Análise de Volume Acumula
FREE

Zen Market Flow - MTF SuperTrend
O MTF SuperTrend é um sistema que pode ser utilizado em qualquer intervalo de tempo. Este indicador multi-timeframe exibe sinais de 1 a 3 intervalos de tempo simultaneamente e indica seu alinhamento.
Se você gosta do indicador SuperTrend, vai adorar esta versão.
Você também pode testar os sinais e desenhos do indicador no backtest, onde pode exibir sinais multi-timeframe.
O indicador fornece sinais quando todos os intervalos de tempo mostram a mesma direção.
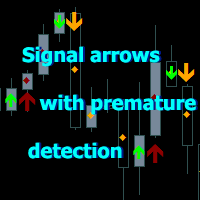
Indicador de seta que mostra reversões de preços e segue uma tendência.
O indicador determina reversões de preços no gráfico e é adequado para scalping no TF 1M-5M e negociação diária no TF 1H e 4H. As setas de compra e venda são apresentadas no gráfico como sinais de entrada. Os diamantes são apresentados atrás das setas como continuação do sinal.
Não são redesenhados e são formados após o fecho da vela.
As setas vermelhas são sinais de compra.
As setas laranja são sinais de venda.
O indicador

The Block Master Pro indicator is designed to visually identify areas on the chart where significant volumes from major market participants are likely concentrated. These areas, known as order blocks, represent price ranges where large players place their orders, potentially signaling a price reversal and movement in the opposite direction. Key Features:
Order Block Identification: Block Master Pro effectively identifies order blocks by pinpointing price ranges where large orders are placed. Th

Buy Sell Storm
Professional indicator for trading on financial markets, designed for MT5 platform .
Trading on the indicator is very simple, Blue arrow to buy , Red arrow to sell.
Special offer - https://www.mql5.com/en/users/bossik2810
The indicator does not redraw and does not change its values.
( see the video of the EA on the indicator).
In the default settings the Period parameter is set to - 1
You can change this parameter for more accurate signals.
If you have any
This is Multiple Timeframe of Malaysia SNR Levels and Storyline. The single timeframe version here Features: + Display level on multiple timeframe (higher or lower) + Turn on/off level on timeframe + Alert when price touch level 1. if high > resistance level but close of candle < resistance level , this level become unfresh - Name of level will have "(m)" meaning mitigated if close of candle > resistance level , this level become invalid and can be removed in chart (there is setting for keep

Introducing Volume Orderflow Profile , a versatile tool designed to help traders visualize and understand the dynamics of buying and selling pressure within a specified lookback period. Perfect for those looking to gain deeper insights into volume-based market behavior! MT5 Version - https://www.mql5.com/en/market/product/122657 The indicator gathers data on high and low prices, along with buy and sell volumes, over a user-defined period. It calculates the maximum and minimum prices during this

ATR Bands with Take-Profit Zones for MT4 The ATR Bands indicator for MT4 is designed to assist traders in managing risk and navigating market volatility. By using the Average True Range (ATR), it helps identify key price levels and set realistic stop-loss and take-profit zones. Key Features: ATR-Based Bands : The indicator calculates dynamic upper and lower bands using ATR. These bands adjust based on price volatility, helping to indicate potential support and resistance levels. Customizable Par
FREE

The indicator calculates a combination of two moving averages and displays their trend in derivative units. Unlike traditional oscillators, the maximum and minimum values in this indicator always correspond to the number of bars you want to track. This allows you to use custom levels regardless of volatility and other factors. The maximum and minimum values are always static and depend only on the initial Bar review settings.
The indicator can be used as an independent trading systemtrading
FREE
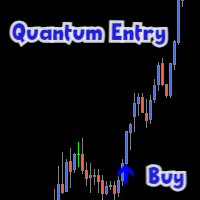
Top Quantum Entry MT4 indicator that gives signals to enter trades.
Perfect entry points for currencies, cryptocurrency, metals, stocks and indices.
Special offer - https://www.mql5.com/en/users/bossik2810
The indicator 100% does not repaint!!!
If a signal appears, it does not disappear anymore! Unlike indicators with redrawing, which lead to loss of deposit, because they can show a signal, and then remove it.
Trading with this indicator is very easy.
Wait for a signal from the indicat
Engulfing Pattern is a free indicator available for MT4/MT5 platforms, its work is to provide "alerts" when a "Bullish" or "Bearish engulfing pattern forms on the timeframe. This indicator comes with alerts options mentioned in the parameter section below. Join our MQL5 group , where we share important news and updates. You are also welcome to join our private channel as well, contact me for the private link. Engulfing Pattern Indicator MT5 Other Products Try our Martini EA with 2 years of liv
FREE
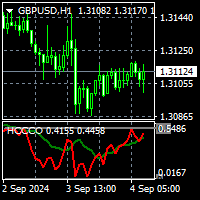
For MT5 version please click here . - This is the exact conversion from TradingView source: "Hurst Cycle Channel Clone Oscillator" By "LazyBear". - The screenshot shows similar results from tradingview and Metatrader when tested on ICMarkets on both platforms. - This is a non-repaint and light processing load indicator. - All input options are available. - Buffers are available for use in EAs and optimization purposes. - You can message in private chat for further changes you need.
Welcome to enhanced pattern detection with the Double Top and Bottom Pattern Scanner ! Transform your trading approach with this powerful MT4 indicator designed for efficient pattern scanning and actionable alerts. Key Features: Advanced Zig Zag Pattern Detection : The Double Top and Bottom Pattern Scanner uses the zig zag pattern to detect tops and bottoms. It identifies points where the price bounces back twice from the same level after a long trend, signaling potential market reversals. Real

This is a very simple multiple moving average indicator.
It can display 12 moving averages. The time axis of the moving averages can be changed in the input field of the indicator. The process is faster than the 12 moving averages included with MT4.
We also have a buffer set up so you can access it from an Expert Advisor. *For advanced users.
If you have any questions or requests, please message me.
Thank you. MT5 Version: https://www.mql5.com/en/market/product/124997
FREE

The indicator is getting the four most important trading sessions: New York London Sydney
Tokyo The indicator auto calculate the GMT time. The indicator has buffers that can be used to get the current session and the GMT.
You can use it as stand alone indicator and you can turn the draw off and call it from your EA. INPUTS Max Day: Max days back to get/draw. London Session On: Show/Hide London Session. New York Session On: Show/Hide New York Session. Sydney Session On: Show/Hide Sydney Session
FREE

The Multi Pairs Forex Indicator is an advanced trading too l that allows traders to track and analyze the performance of multiple currency pairs in real-time on a single chart. It consolidates data from various Forex pairs, providing an at-a-glance overview of market conditions across different currencies and helps you save time. Useful for various trading styles, including scalping, day trading, and swing trading. Whether you're monitoring major pairs like EUR/USD, GBP/USD, or more exotic pair
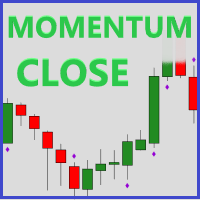
Momentum Close is a useful tool to identify volume based on the strength of a candle close. A strong candle close is when there is a small wick in comparison to the candle body and is a sign that the market will continue in that direction. *This is a NON-repainting indicator*
How this can help you? Identify trend strength Trend confirmation Seeing potential reversals (strong rejection candle) Developing entry and exit strategies Strong confluence to add to your strategy Volume analysis
Featur
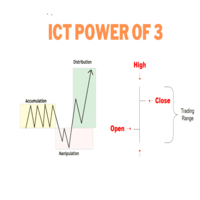
ONLY LOOK TO TRADE DURING TIMES AS SEEN IN SCREENSHOT. START TO LOAD THE INDICATOR BEFORE TO CALCULATE THE BARS SO IT SHOWS THE PHASES ACCORDING TO ICT. 1. London Silver Bullet (3:00 AM - 4:00 AM NY Time) Before 3:00 AM : The market is typically in the Accumulation Phase before the London open, where price consolidates, and large market players accumulate positions. You watch for this quiet consolidation leading up to the manipulation. 3:00 AM - 4:00 AM : Manipulation Phase occurs. During this

The Multi MA Trend Change MT4 indicator is designed to help traders identify and capitalize on trend shifts with precision. By monitoring multiple moving averages, it highlights areas where trends are either gaining strength or beginning to reverse. This makes it an excellent tool for spotting early trend changes and anticipating market movements before they become apparent. The indicator excels in identifying potential retracement entries, ensuring that traders can catch pullbacks during establ

In the context of trading, Malaysia SNR (Support and Resistance) refers to the technical analysis of support and resistance levels in financial markets, particularly for stocks, indices, or other assets traded. There are three type of Malaysia SNR level Classic , GAP and Flipped 1. Classic Support is the price level at which an asset tends to stop falling and may start to rebound. It acts as a "floor" where demand is strong enough to prevent the price from dropping further. Resistance

Advanced UT Bot & HTS Indicator This indicator is an advanced technical analysis tool that combines two methods: UT Bot and HTS (Higher Timeframe Smoothing) , to generate accurate buy and sell signals. 1. Indicator Structure Works within the main chart window and utilizes 11 buffers to store various data points, including arrows (buy/sell signals) and bands from both UT Bot and HTS systems. Uses colored arrows to represent different trading conditions: Blue arrows : Normal buy signals. Red arro

Advanced ATR Trailing Stop with EMA Filter Indicator Introducing the ATR Trailing Stop with EMA Filter Indicator , a powerful tool designed to enhance your trading strategy with advanced signal filtering. This indicator combines the precision of ATR (Average True Range) trailing stop calculations with the flexibility of an EMA (Exponential Moving Average) filter, ensuring you capture the best opportunities in the market. Key Features: Dual Signal Arrows: The indicator provides two types of arrow

This is a comprehensive multi-timeframe , multi-indicator dashboard designed to simplify and enhance your trading experience. The dashboard provides real-time insights across multiple currency pairs and timeframes, helping traders quickly assess market conditions and make informed decisions. With a user-friendly interface, customizable settings, and a robust selection of indicators, this tool is an essential addition to any trader's arsenal.
Key Features: Multi-Timeframe Analysis: Monitor key
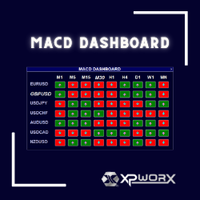
Simplify Your Trading with the MACD Dashboard
Are you tired of juggling multiple MetaTrader charts to monitor MACD across different timeframes and symbols? The MACD Dashboard is the solution you've been waiting for. This innovative MetaTrader indicator provides a centralized view of MACD signals on multiple charts, making it easier than ever to identify trading opportunities and manage your risk.
Key Features: Multi-Timeframe Monitoring: Track MACD signals on multiple timeframes simultaneousl

Trend Cutter é um indicador de tendência que pode ser usado em qualquer período de tempo, incluindo períodos mais baixos, como M1 e M5. O indicador é ideal para traders que preferem negociações intradiárias e também será útil para aqueles que preferem negociações de longo prazo. Você pode usar este indicador como base para o seu sistema de negociação ou como uma solução de negociação independente. O indicador fornece todos os tipos de alertas, incluindo notificações PUSH. O indicador é muito fác

Um indicador de seta sem repintura para ajudar nas entradas Melhores sinais são dados em mercados em tendência Aguarde a barra atual fechar para travar a seta no lugar Basta carregar no gráfico sem configurações para confundir A cor e o tamanho da seta podem ser ajustados O indicador pode ser usado com qualquer par ou período de tempo - Forex, criptografia ..... Melhor negociar com a tendência de prazo maior -------------------------------------------------- ----------------------
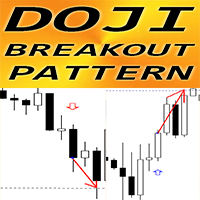
Indicador Crypto_Forex "Doji Breakout Standard" para MT4.
- O indicador "Doji Breakout Standard" é pura negociação de Price Action: sem repintura, sem atraso; - O indicador deteta o rompimento do padrão Doji na direção da tendência, em que a vela Doji está no meio do padrão e a última vela é o rompimento: - Padrão Bullish Doji Breakout - Sinal de seta azul no gráfico (ver fotos). - Padrão de quebra Doji de baixa - Sinal de seta vermelha no gráfico (ver fotos). - Com alertas de PC, telemóvel e
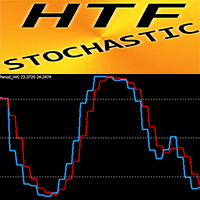
Indicador Crypto_Forex HTF Estocástico para MT4.
- O oscilador estocástico é um dos melhores indicadores do mercado - ferramenta perfeita para muitos traders. HTF significa - Prazo Superior. - Zona de sobrecompra – acima de 80; OverSold um - abaixo de 20. - O indicador HTF Stochastic é excelente para sistemas de negociação Multi-Time Frame, especialmente com entradas de Price Action. - Este indicador permite-lhe anexar o Estocástico de um período de tempo superior ao seu gráfico atual -> esta
RSI Aprimorado: Um Indicador Híbrido para uma Análise Técnica Mais Profunda O RSI Aprimorado é um indicador técnico versátil e personalizável, projetado para fornecer aos traders uma análise de mercado mais completa e precisa. Combinando as melhores características de médias móveis, RSI e MACD, este indicador oferece uma visão multidimensional do momentum e da força de uma tendência. Principais Características: Hibridização Perfeita: O RSI Aprimorado combina as capacidades das médias móveis, RSI

O indicador Escobar Reversal foca em fornecer sinais únicos de compra e venda inteligentes. Além disso, você obterá um nível de stop loss e várias metas de take profit para escolher!
Vem com um analisador de tendências integrado que aparece no centro, abaixo do nome. Esse analisador de tendências pode nos ajudar a confirmar entradas e aumentar a precisão.
Agora, lembre-se, este pode ser um bom indicador com funções fáceis para iniciantes, mas isso não significa que você não deve adicionar al

WaPreviousCandleLevels MT4 shows the previous candle levels, it shows the previous candle Open High Low Close levels (OHLC Levels) in different time frame. It's designed to help the trader to analyse the market and pay attention to the previous candle levels in different time frame. We all know that the OHLC Levels in Monthly, Weekly and Daily are really strong and must of the time, the price strongly reacts at those levels. In the technical analysis, the user can use them as a support and res
FREE

!!!The free version works only on "EURUSD"!!! WaPreviousCandleLevels MT4 shows the previous candle levels, it shows the previous candle Open High Low Close levels (OHLC Levels) in different time frame. It's designed to help the trader to analyse the market and pay attention to the previous candle levels in different time frame. We all know that the OHLC Levels in Monthly, Weekly and Daily are really strong and must of the time, the price strongly reacts at those levels. In the technical analys
FREE
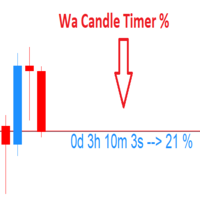
Wa Candle Timer Percentage MT4 is an indicator which shows the user how much time is remaining until the next candle will form. The percentage of the evolution of the current candle is also displayed. The user can set the percentage that the candle timer will change the color. These are the settings: 1- The percentage that the candle timer will change the color. 2- Color of Candle Timer when it's BELOW the percentage set by the user. 3- Color of Candle Timer when it's ABOVE the percentage set b
FREE

Volume PRO is an innovative and modernized indicator for analyzing trading volumes, which is an advanced version of traditional analysis tools. This high-tech indicator allows traders to effectively monitor trading activity without the need for complex calculations. It displays ticks for the selected time interval corresponding to the selected time frame in the form of a dynamic cumulative histogram, which is updated in real time as new trades are received. Key features: Innovative volume analys

This indicator is based on the Gann Signal indicator and acts as a market scanner. All you need to do is fill in the selected currency pairs in the settings and that’s it. Next, the indicator itself will view all these currency pairs and time frames from M5 to D1 simultaneously. When a new signal appears, the indicator will give you an Alert and also draw the letter N where this new signal will be.
O Mercado MetaTrader é a única loja onde você pode baixar um robô demonstração de negociação gratuitamente para testes e otimização usando dados históricos.
Leia a visão geral e opiniões de outros clientes sobre os aplicativos, faça o download para o seu terminal e teste um robô de negociação antes de comprá-lo. Apenas no Mercado MetaTrader você pode testar um aplicativo de forma absolutamente gratuita.
Você está perdendo oportunidades de negociação:
- Aplicativos de negociação gratuitos
- 8 000+ sinais para cópia
- Notícias econômicas para análise dos mercados financeiros
Registro
Login
Se você não tem uma conta, por favor registre-se
Para login e uso do site MQL5.com, você deve ativar o uso de cookies.
Ative esta opção no seu navegador, caso contrário você não poderá fazer login.