Conheça o Mercado MQL5 no YouTube, assista aos vídeos tutoriais
Como comprar um robô de negociação ou indicador?
Execute seu EA na
hospedagem virtual
hospedagem virtual
Teste indicadores/robôs de negociação antes de comprá-los
Quer ganhar dinheiro no Mercado?
Como apresentar um produto para o consumidor final?
Novos Indicadores Técnicos para MetaTrader 4 - 3

Using the Likdon Forex indicator algorithm, you can quickly determine the current trend in the market. The Elephant indicator tracks long trends and can be used without restrictions on instruments or timeframes. With its help, you can try to predict future price values, but its main purpose is to generate buy and sell signals.
The indicator tracks the market trend, ignoring sharp fluctuations and market noise around the average price. It implements a technical analysis method based on the ass

Gann Retracements Octaves Indicator Enhance your trading strategy with the Gann Retracements Octaves indicator, meticulously designed to integrate Gann's theories with modern technical analysis. This custom indicator provides you with precise retracement levels based on Gann's octaves, helping you identify key support and resistance levels, as well as potential reversal points in the market. Key Features: 24 Indicator Buffers : Tracks multiple retracement levels (-7/8 to 15/8) with distinct colo
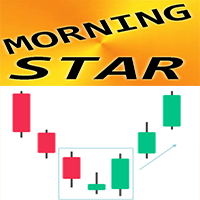
Indicador Forex "Padrão Morning Star" para MT4
O indicador "Padrão Morning Star" é um indicador muito poderoso para negociação de Price Action: Sem repintura, Sem atrasos; Indicador detecta padrões de alta da Morning Star no gráfico: sinal de seta azul no gráfico (veja fotos) Alertas de PC, celular e e-mail estão incluídos Também seu irmão - indicador de baixa "Padrão Evening Star" está disponível (siga os links abaixo) Indicador "Padrão Morning Star" é excelente para combinar com Níveis de S

Indicador Forex "Padrão Evening Star" para MT4
O indicador "Padrão Evening Star" é um indicador muito poderoso para negociação de Price Action: sem repintura, sem atrasos; O indicador detecta padrões de baixa do Evening Star no gráfico: sinal de seta vermelha no gráfico (veja fotos) Alertas de PC, celular e e-mail estão incluídos Também seu irmão - indicador de alta "Morning Star Pattern" está disponível (siga os links abaixo) Indicador "Padrão Evening Star" é excelente para combinar com Níve
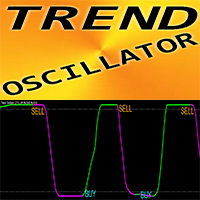
Trend Oscillator - é um indicador personalizado avançado, ferramenta de negociação eficiente!
É usado um novo método de cálculo avançado - 20 opções para o parâmetro "Preço para cálculo" O oscilador mais suave já desenvolvido Cor verde para tendências ascendentes, cor vermelha para tendências descendentes Valores sobrevendidos: abaixo de 5; Valores de sobrecompra: acima de 95 Existem muitas oportunidades para atualizar até mesmo estratégias padrão com este indicador com alertas de PC e celula
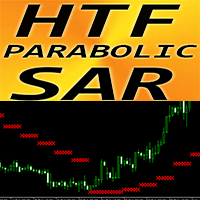
Indicador Forex Parabólico SAR Maior Prazo para MT4
Atualize seus métodos de negociação com o excelente indicador auxiliar HTF PSAR para MT4. HTF significa - Prazo Maior O PSAR é usado para determinar a direção da tendência e possíveis reversões no movimento dos preços. Este indicador é ótimo para usar para fins de Trailing Stop Se o PSAR estiver localizado acima do preço - é uma tendência descendente Se o PSAR estiver abaixo do preço - é uma tendência ascendente Este indicador é excelente pa
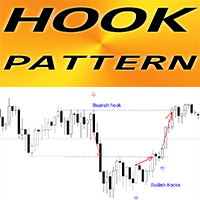
Indicador Forex "Padrão de gancho" para MT4
O indicador "Padrão de gancho" é um indicador muito poderoso para negociação de Price Action: sem repintura, sem atrasos; O indicador detecta padrões de gancho de alta e baixa no gráfico: Gancho de alta - sinal de seta azul no gráfico (ver fotos) Bearish Hook - Sinal de seta vermelha no gráfico (ver fotos) Alertas de PC, celular e e-mail estão incluídos Indicador "Padrão de gancho" é bom para combinar com níveis de suporte/resistência: https://www.m

Histogramă PERFECTĂ Acest indicator este indicatorul săgeților PERFECT transformat într-un indicator histogramă. Faceți cumpărături la cercul albastru. Vindeți cercului roșu. Acest indicator este de câteva ori mai bun decât BRICS indicator. Și asta este foarte bine. În primul rând pentru că dă semnale mai des. Se poate tranzacționa de mai multe ori pe zi folosind mai multe valute Perechi. În al doilea rând, tranzacțiile sunt, în general, mai lungi. Profitul țintă poate depăși 10 sâmbur

The Dreadnought indicator carefully analyzes price dynamics, identifying temporary weakening of the trend and sharp changes in its direction. By monitoring this indicator, you can easily notice changes in the market and take appropriate action. Entering the market may be easy, but maintaining a position is much more difficult. With Dreadnought, you have reliable support to successfully stay ahead of the trend. This indicator analyzes historical data and provides the trader with the necessary in

The Radiant Trend indicator calculates the saturation levels of the price chart. A signal to exit the oversold zone indicates a buy, and a signal to exit the overbought zone indicates a sell. For this indicator, it is usually necessary to set relative values for the overbought and oversold levels – Bottom and Top.
Often a good trend can be seen visually on the price chart. However, an experienced trader must clearly understand the current market situation before opening a position. The indi

The Geliosx indicator is designed to visually display the trend. One of the key tasks when monitoring the currency market is to determine the trend - a stable direction of price movement. Geliosx uses special calculations to smooth out sharp fluctuations that do not have a significant impact on the overall picture of the price movement.
This indicator is created for those who value their time and money.
The trend can be ascending (bull trend) or descending (bear trend). Typically, the trend

The Arriator forex indicator algorithm allows you to quickly determine the current trend in the market. The Elephant indicator accompanies long-term trends and can be used without restrictions on instruments or timeframes. This indicator not only helps predict future values, but also generates buy and sell signals. It tracks market trends, ignoring wild swings and market noise around the average price. The indicator implements a type of technical analysis based on the idea of market cyclicalit

The Sirius X indicator reliably tracks market trends, ignoring wild swings and market noise. Suitable for trading on any timeframe, effectively filtering sudden price spikes and corrections by reducing market noise around the average price. For calculations, the indicator uses iLow, iHigh, iMA and iATR. The output based on these reliable indicators is also reliable. You can set up a sound signal and notifications, for example by email. The indicator does not redraw and works stably.
Configura
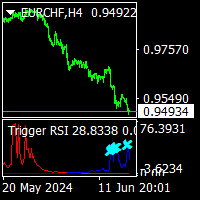
Trigger RSI is a no repaint trend indicator. it can use all pairs and all time frames. easy for use beginner and experienced tarders. it put aqua and gold point on histograms. if aqua point on the blue histogram that is buy signal. if gold point on the red histogram that is sell signal. cnt value has been set to default 1000. you can increase it to see back signals.if there is enough bars on charts. minimum value cnt is 500.

The Onion Trend Indicator is a revolutionary trend trading and market data filtering solution that combines all the important features of a trend tool in one tool! It is great for any trader, be it Forex or binary options. No settings are required, everything is optimized by time and experience, it works effectively both in flat conditions and in trend conditions.
The Onion Trend Indicator is a technical analysis tool for financial markets that reflects current deviations in the price of

Indicatorul ANDROMEDA
Bun venit!
Indicatorul Andromeda este o creație nouă.
Acest indicator funcționează foarte bine pe H1.
Fiecare semnal asigură un profit cuantificat minim de 5, 10 sâmburi. Pentru profituri mai mari, se folosesc linii de rezistență, benzi TMA, Bollinger etc.
Singura problemă sunt știrile. Remediul pentru aceasta este Stop Loss.
Dacă indicatorul nu este afișat, citiți comentariul meu în secțiunea de comentarii pentru a afla cum să faceți acest lucru.
Verific

This indicator uses horizontal lines to identify support and resistance levels based on Zigzag legs and On-Balance Volume (OBV) analysis. Here is a summary of how the indicator works: Resistance and Support Lines : A horizontal line above the current price level indicates resistance. A horizontal line below the current price level indicates support. Drawing Horizontal Lines : Draw horizontal lines on every Zigzag leg within the last X legs, where X is a specified number (e.g., 10). Only the most
FREE

Support and Resistance Levels is an intelligent indicator that displays horizontal support and resistance levels, suitable for traders of different trading frequencies. You can select your preferred trading frequency, and the indicator will automatically calculate the support and resistance levels relevant to that frequency. Among these, the Bull-Bear Line is an interval used to distinguish the strength of bullish and bearish forces, and is an important level.
You can combine it with other in

Lyre Histogram
Greetings!
The Lyre Histogram indicator is created for the M15 and M5 intervals.
Note Este posibil ca acești indicatori pe care îi punem în vânzare să nu funcționeze pe anumite platforme. De câțiva ani, unele platforme cu noi versiuni MT4 nu afișează toți indicatorii personalizați.
O soluție la această problemă este să descărcați acești indicatori pe o altă platformă de la un alt broker sau să reveniți la o versiune mai veche a MT4.
Am avut această problemă cu indicat
Muon g-2
Bună ziua! Indicatorul Muon g-2 funcționează cel mai bine pe H1, M30 și H4 și pe toate perechile valutare.
Se poate tranzacționa de mai multe ori pe zi folosind mai multe perechi valutare.
Acest indicator pare să depășească indicatorul PERFECT.
Semnalele de cumpărare-vânzare sunt sub formă de săgeți.
Vă doresc succes!
Verificați mai întâi indicatorul sau expertul pe un cont DEMO, înainte de a-l cumpăra!
Analizați-l bine! Vorbeste cu vanzatorul! Închiriați-l pentru o per

Mysterium is a channel indicator without redraws, which is based on double smoothing of moving averages. Unlike channel indicators such as Bollinger, Mysterium uses double smoothed moving averages. This allows you to more accurately determine the direction of market movement, although it reduces the sensitivity of the indicator. However, double smoothing provides a clearer and more stable display of channels on the chart, which helps traders make informed trading decisions.

Volatility Range is an indicator that calculates the range of volatility, predicting key levels such as potential resistance above and potential support below. The indicator can display volatility forecast ranges for the latest 50 days, 10 weeks, or 4 months. By observing these ranges, you can better identify reliable levels where combining with price action enhances trade accuracy significantly.
You have the option to fill the rectangle area with color for easier observation, or leave it unf

Price Action Scanner is an indicator that identifies price behaviors and provides alerts. This indicator can simultaneously detect signals for up to 6 different symbols across various timeframes. By setting a separator, you can add different symbol names and timeframes.
The indicator can detect multiple common signal types such as Pinbar, Engulfing Pattern, Inside Bar, Morning Star, Evening Star, Fakey, and display corresponding information in separate subcharts, indicating the direction of t

Price Action Scanner Pro is an indicator that identifies price behaviors and provides alerts, offering more features and customization compared to Price Action Scanner ( https://www.mql5.com/zh/market/product/118937?source=Site+Profile+Seller ) . This indicator can simultaneously detect signals for up to 15 symbols across different timeframes. You can configure it to detect signals during specific trading sessions such as Asian, European, and US sessions, using different timeframes. This
Working with the Channel Motion Tracker indicator is as simple as possible. Just react to the arrows that the indicator displays. Each arrow represents an explicit command to action. The signals generated by this indicator are accurate enough to allow you to trade based on this information.
One of the main advantages of the indicator is its ability to build high-quality channels and generate signals for entering the market. This is great for the trader who always finds it difficult to choose
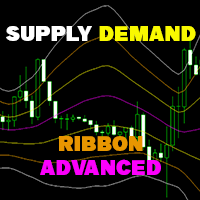
Supply Demand Ribbon is an indicator with moving supply and demand lines that help you identify price zones more easily.
The indicator helps you determine flexible entry, stop loss, and take profit areas.
There are also strategies for algorithmically changing ribbon colors.
From there you can come up with many trading strategies for yourself! You can try the Basic version here ! MT5 version: Click here! Feature in Advanced version: Hide/Show 2 Supply/Demand Over lines. Hide/Show 2
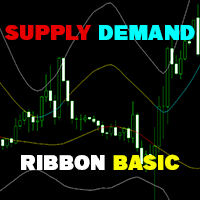
Supply Demand Ribbon is an indicator with moving supply and demand lines that help you identify price zones more easily. The indicator helps you determine flexible entry, stop loss, and take profit areas. There are also strategies for algorithmically changing ribbon colors. From there you can come up with many trading strategies for yourself! MT5 Version: Click here!
You can explore many feature in Advanced version here ! Feature in Basic version: Show 2 Supply/Demand Over lines. Sh
FREE
CandleCloseCountdown is technically an indicator. Its purpose is to show the time a candle has left on a given timeframe before it closes. All possible time frames of MetaTrader 4 are supported. The way the remaining time is displayed depends on the selected timeframe. For M1 only the seconds are displayed. Above that at all timeframes up to H1 the remaining minutes and seconds are displayed and so on for timeframes above D1.
FREE

The Candlestick Pattern Detector is an advanced MetaTrader 4 indicator designed to identify and highlight candlestick patterns on your charts. Currently, the indicator detects one specific candlestick pattern - the pinbar, known for its significance in technical analysis and trading strategies. This tool provides traders with visual cues, making it easier to spot potential market reversals or continuations. Features: Customizable Colors: Users can customize the colors of the bullish and bearish

Product Description: Precision Pattern Indicator for Consistent Profits Elevate your trading with the Precision Pattern Indicator, an advanced tool designed to spot a highly profitable and specific trading pattern. This indicator is your key to unlocking consistent profits with minimal effort. Key Features: Accurate Entry Signals: Receive clear entry signals with green arrows for buy opportunities and red arrows for sell opportunities, ensuring you never miss a profitable trade. Defined Risk Man
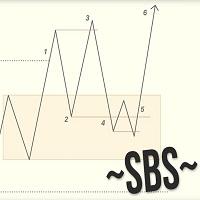
Swing Breakout Sequence | SBS presents a comprehensive trading strategy designed to help traders identify and capitalize on market swings and breakouts. The Swing Breakout Sequence (SBS) strategy is built around a series of well-defined steps to optimize trading decisions and improve profitability. Key Components of the SBS Strategy: Breakout Identification : The initial step involves identifying potential breakouts in the market. This is a crucial phase where traders look for key levels where t
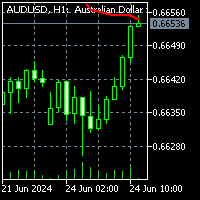
To download MT5 version please click here .
- This is the exact conversion from TradingView: "Chandelier Exit" By "everget". - This is a non-repaint and light processing load indicator - input options related to coloring and labels are removed to fit into MetaTrader graphics. - Buffers are available for processing within EAs. - You can message in private chat for further changes you need.
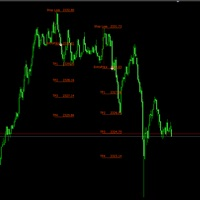
Best indicator for trend reversals Can be optimized for crypto trading or all currency pairs How to use:When the arrow appears, wait for the candle to close and open the order Level lines appear when candle closes, The system shows you the best entry levels It is simple and easy to use, no additional settings are required. Best indicator for beginners and professionals You can set the displayed stop loss and desired profit levels. You can use it alone or in addition to your strategy. Recommend
The LewshaGen indicator is a technical analysis tool used in the Forex market. It helps traders make decisions when to enter or exit a trade based on analysis of market data. Let's look at how it works and why it can be useful.
How the LewshaGen indicator works: Trend Analysis: The indicator analyzes chart data and identifies key turning points and trends in the market. In the chart above, you can see how the indicator helps identify a decline of 180 points (PIP) and a subsequent rise of 330

BullseyeSignal – NoRepaint é um sinal que, como o nome sugere, nunca repinta em nenhuma circunstância. O sinal é emitido na mesma vela observada na imagem. É ideal para mercados altamente voláteis, como forex, criptomoedas, ações, índices e futuros. Você verá apenas uma seta verde para compra e uma seta vermelha para venda, mas há muitos indicadores trabalhando juntos por trás deles para fornecer uma experiência de negociação mais simplificada. Ele é especificamente projetado para fornecer entra
o indicador PERFEITO
Este indicador é várias vezes melhor que o indicador do BRICS. E isso é muito bom.
Em primeiro lugar porque dá sinais com mais frequência. Pode-se negociar várias vezes ao dia usando vários pares de moedas.
Em segundo lugar, as transações são geralmente mais longas. O lucro alvo pode exceder 10 pips. Embora eu recomende que a segurança seja de 10 pips. Mas isso pode ser feito dependendo da situação.
Em terceiro lugar, este indicador aplica-se a todos os pares.
Eu
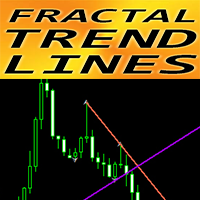
Indicador Forex "Linhas de Tendência Fractal" para MT4
Este indicador é excelente para traders que utilizam Análise Gráfica com breakouts!!! "Fractal Trend Lines" mostra linhas gráficas de tendência ascendente (violeta) e tendência descendente (cor tomate). As linhas de tendência de alta e tendência de baixa são construídas em 2 fractais correspondentes mais próximos O indicador possui poucos parâmetros responsáveis pela cor e largura das linhas de tendência O indicador possui alerta integr
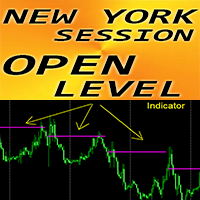
Indicador Forex "Nível Aberto da Sessão de Nova York" para MT4
O indicador "Nível Aberto da Sessão de Nova York" é um indicador auxiliar muito útil para negociação intradiária O nível de preço de abertura da sessão é muito importante porque muitas vezes o preço retorna a essa área durante o dia. O indicador mostra o nível de preço de abertura da sessão de NY diariamente para cada dia O indicador também mostra o nível de abertura da semana às segundas-feiras É útil para os traders intradiários
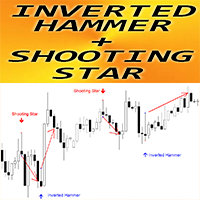
Indicador Forex "Padrão de martelo invertido e estrela cadente" para MT4
O indicador "Padrão de martelo invertido e estrela cadente" é um indicador muito poderoso para negociação de ações de preço: sem repintura, sem atrasos; O indicador detecta padrões de alta do Martelo Invertido e da Estrela Cadente de baixa no gráfico: Martelo Invertido de Alta - Sinal de seta azul no gráfico (ver fotos) Bearish Shooting Star - Sinal de seta vermelha no gráfico (ver fotos) Alertas de PC, celular e e-mail
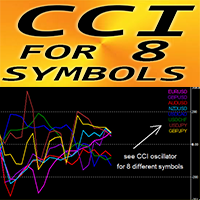
Indicador Forex "CCI para 8 símbolos" para MT4.
CCI é um dos osciladores mais populares para negociação O Commodity Channel Index (CCI) mede a diferença entre o preço atual e o preço médio histórico. Níveis importantes: +/-200; É ótimo receber entradas de venda acima da zona +200 e entradas de compra abaixo de -200 "CCI para 8 símbolos" dá a oportunidade de controlar valores CCI de até 8 símbolos diferentes em apenas um gráfico Este indicador também é excelente para combinar com entradas de P
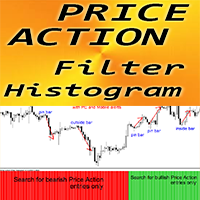
Histograma de filtro de ação de preço - é uma ferramenta de negociação auxiliar eficiente para negociação de ação de preço!
Este indicador sugere ao trader a direção das entradas. Então, o trader só precisa procurar sinais de Price Action nessa direção. O histograma do Filtro de Ação de Preço deve ser combinado com padrões de Ação de Preço e níveis de suporte/resistência Histograma de cor verde – Procure entradas de alta Histograma de cor vermelha – Procure entradas de baixa Existem muitas op
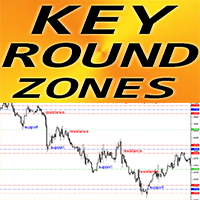
Indicador Forex "Zonas Redondas Chave" para MT4
O indicador "Key Round Zones" deve ter um indicador auxiliar para traders que levam em consideração suporte/resistência Os níveis de 1000 e 500 rodadas são respeitados pelo preço - o preço se recupera deles com muita frequência Os principais níveis 1000 também têm fortes zonas de Suporte/Resistência (100 pontos em cada lado) ao seu redor Além disso, os níveis de 1.000 e 500 rodadas são bons para colocar Take Profits (na frente do nível da rodada

Consolidation Zone Indicator is a powerful tool designed for traders to identify and capitalize on consolidation patterns in the market. This innovative indicator detects consolidation areas and provides timely alerts when the price breaks above or below these zones, enabling traders to make informed trading decisions. MT5 Version : https://www.mql5.com/en/market/product/118748
Key Features:
1. Consolidation Detection : - Precise Identification : The Consolidation Zone Indicator accurat
FREE

The Tin indicator is designed to visually display the current trend in the market. One of the key aspects of foreign exchange market analysis is to determine the trend, which is the sustainable direction of price movement. To do this, the Tin indicator uses algorithms that smooth out sharp fluctuations that do not have a significant impact on the overall trend.
A trend can be either upward (bullish) or downward (bearish). Typically, a trend persists for a long time before abruptly changing di

The indicator calculates delta, the difference in tick volumes between buyers and sellers.
Displays the imbalance of market purchases and sales.
Delta imbalance is a special style of presentation based on the ratio of supply and demand volumes
Using the indicator in real trading mode, you can observe the behavior of the mood of large market participants, thereby you can visually see who currently controls the price and maintains further control.
You can also see the absence of large v

Average Entry Positions Indicator The Average Entry Positions Indicator provides traders with a clear visual representation of their average buy and sell entry prices on the chart. This indicator calculates the average entry prices for both buy and sell positions and displays them as horizontal lines with customizable colors and labels. By using this tool, traders can quickly assess their overall entry positions, aiding in better decision-making and trade management. Key Features: Displays avera
This indicator has a lot of numerology analyzing methods that can support your analyzes or can work as custom strategy by it self ..we will start to explain them one by one : this the trial version of this product to have this product here is the link : https://www.mql5.com/en/market/product/118782 1- Range channel that draws the limits of daily movements to detect places of buy and places of sell .
2- Angler will detect Dynamic numeral levels that result of time and price squaring with cus
FREE

This indicator has a lot of numerology analyzing methods that can support your analyzes or can work as custom strategy by it self ..we will start to explain them one by one : 1- Range channel that draws the limits of daily movements to detect places of buy and places of sell .
2- Angler will detect Dynamic numeral levels that result of time and price squaring with custom numeral method that works like support and resistant and will support your analyzes
3- Shepherd Levels it is l

Extreme TMA Variations Indicator The Extreme TMA Variations is an innovative MetaTrader 4 (MT4) indicator designed for traders seeking precise market analysis and actionable trading signals. This indicator leverages an advanced Triangular Moving Average (TMA) framework to provide a robust analysis of price trends and volatility, helping traders to identify optimal entry and exit points in various market conditions.
Limited-time Special Opportunity: Seize the moment! Be among the first 10 (Purc
FREE

Jingle is a versatile forex indicator that provides traders with various tools for market analysis. It includes different types of indicators such as MACD, RSI, DMI, and Mom, allowing traders to adapt their approach to the market according to the current situation. Indicator Parameters: Indicator : The type of indicator (MACD, RSI, DMI, Mom) that can be selected according to your preferences and trading strategy. Length : The periods of the indicator, which are determined based on the selected t
This indicator implements the following idea: if the current closing price (or the current average price) overcomes the smoothed value of the minimum/maximum prices for the selected period, this indicates a change in trend. The indicator effectively follows price movements in trending areas of the market and clearly demonstrates areas of sideways price movement. The product can be useful for both beginners and experienced traders as it is easy to use and intuitive. The indicator allows you to se

Why the RSI Alert Indicator is Essential for Your Trading Toolkit
In the fast-paced world of trading, timely and accurate information is crucial. The RSI Alert Indicator is a powerful tool designed to help you stay ahead of the market by providing real-time alerts when the Relative Strength Index (RSI) reaches critical levels. Whether you're a novice trader or a seasoned professional, this indicator can significantly enhance your trading strategy by pinpointing potential market reversals with

The SuperTrend MTF indicator is an excellent trend tracking indicator . It can not only display SuperTrend trends within the timeframe of the chart, but also set up to display SuperTrend trends for larger time frames simultaneously . This will be beneficial for grasping trends at a larger time scale and predicting future trends . At the same time, the price of the trend line can also be displayed at a glance, making it easy to observe. Input parameters : ATR period used at chart timeframe

TMA Channel is a price channel obtained through a special calculation method based on traditional TMA . The channel has upper, middle, and lower tracks . When the price approaches or exceeds the upper track, it is already in an overbought state, and attention should be paid to the situation of reversal and decline; When the price approaches or falls below the lower track, it is already in an oversold state, and attention should be paid to the situation of reversal and rise . The indicator will d

RSI With Alert
Relative strength index (RSI) indicator is a popular technical indicator in the family of oscillators.
RSI oscillates between 0 and 100 and traders use it to spot overbought and oversold states in the market.
Typically, a value above 70 means that the instrument is overbought and due to a retracement. A value below 30 means that the trading instrument is oversold.
RSI indicator strategies
This indicator allows you to get notifications when some conditions trigger. You c
FREE
Cumpără Vinde semnal M15
Bine ați revenit pe pagina noastră.
Cumpărați semnalul de vânzare Indicatorul M15 funcționează cel mai bine pe M15. Pe intervale mai lungi de timp, semnalele sunt mai rare.
Este un indicator de tip oscilator.
Aș recomanda o țintă de profit de 10 sâmburi sau la primul nivel de suport sau rezistență etc.
Poate fi folosit cu succes pe M5.
Feriți-vă de stop-loss. Ar trebui plasat astfel încât să nu fie lovit de mișcări aleatorii ale prețurilor.
Noroc!
This indicator is used to measure bullish and bearish candles on each time frame and I provide notifications for reminders
Indikator ini digunakan untuk mengukur bullish dan bearish candle pada setiap time frame dan saya berikan notifikasi untuk pengingat
This indicator is used to measure bullish and bearish candles on each time frame and I provide notifications for reminders
FREE
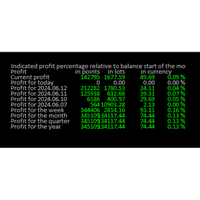
Online Diary: This indicator is designed to help traders keep track of profits and losses over various time periods, such as current profit, today’s profit, yesterday’s profit, and so on, up to the profit for the current year. The indicator offers several configuration options, such as the calculation of profit percentage relative to the balance at the beginning of the day, week, month, quarter, or year. It also allows for the customization of text placement and colors to suit the user’s needs

The Trend DashBoard Indicator for MT4 BULLISH or BEARISH trend information and provides UP and DOWN arrow signals. The trend information is based on MACD, Stochastic, Moving Average, and RSI MetaTrader indicators. So, forex traders can use them in any technical trading strategy to BUY and SELL based on the arrow signals. The indicator works well for new and advanced forex traders. It’s available as a free download and is easy to install.
FREE

The KeyLevels Pro indicator is a powerful tool designed to identify significant support and resistance levels based on pivot highs and lows in the price action. This indicator is perfect for traders who rely on market structure and key price levels to make informed trading decisions. It features customizable parameters, automatic detection of pivot points, and visual representation of key levels with optional labels. Features Pivot Detection : Automatically detects pivot highs and lows based on

* Pivot Points Magic : Effortlessly Plot Pivot Levels on Any Chart**
Pivot Points Magic simplifies the process of identifying critical pivot levels on any chart, across all timeframes. With just a few clicks, traders can instantly visualize pivot points, enabling them to make more informed trading decisions.
We value your feedback! Share your experience with Pivot Points Magic and help us improve. Your reviews and suggestions are essential for shaping future updates and enhancements to the

This is a Halftrend Scalper for MT4. Meant for Swinging markets with good volatility. Not suitable during low volatility. Features:
Wait for Price to cross Halftrend line. Select which HTF halftrend(Main Signal) Check Halftrend alignment between Higher Timeframes Check High Volume Bar (Optional) Halftrend Trends stacked (Optional) What's in the Downloads Package Extras:
- HT Scalper Scanner Dashboard (Keep in same directory as your Arrows indicator - or else won't work)
- Modified MTF Ha

The indicator is a double Rsi based oscillator with color change.
The coloring sometimes repaint one bar because of smoothing.
Check out my indicators and Expert Advisors - https://www.mql5.com/en/users/ptr777/seller
# Please note the demo doesn't perform correctly in the backtester.
The values and colors can be changed as preferred.
The fast line gives earlier signals but if you want confirmation wait for the cross or slow line to change color also.
Buy when lines is closer to


The “Sharp Scalper” indicator is high-frequency trading tool designed for quick, short term trades in the forex market. It focus on identifying rapid price movement and generating signals for best entry. This indicator is known for its ability to capture small profit opportunities multiple times throughout the day making it ideal for scalpers looking to capitalize on market volatility. The” sharp scalper” indicator employs advance algorithms to detect market trends and fluctuation, helping trade

The 10PIPS Dynamite is a semi-automated cutting-edge Forex indicator designed to automatically revolutionize your trading skills from a being a losing trader to becoming a profitable trader simply by Scalping 10 pips per Trade setup generated by the software. 10PIPS Dynamite Indicator once attached on the main chart it starts an in-depth market analysis based on its unique in-built advanced algorithm which seamlessly combines powerful indicators, statistical analysis, and trend recognition
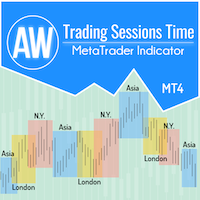
Para comodidade dos traders na obtenção de dados sobre o desempenho dos mercados e na melhor formulação de estratégias de negociação, desenvolvemos um indicador de sessão de negociação. O horário de funcionamento de várias bolsas afeta as negociações, pois afeta a atividade do mercado e os volumes de negociação. Estes factores determinam a volatilidade e as oportunidades de negociação de diferentes instrumentos. O indicador AW Trading Sessions Time exibe os horários de negociação dos mercados a
FREE

Max Payne é um indicador de sinal de reversão/tendência que emite sinais em forma de seta, este indicador emite seu sinal no fechamento da mesma barra, este indicador pode cair várias vezes no gráfico com períodos diferentes para obter confirmação dupla/tripla dos sinais o indicador é altamente ajustável para se adequar a qualquer estilo de negociação, embora nunca seja repintado ou pintado de volta. Você obterá o sistema completo mostrado nas capturas de tela após a compra, juntamente com os m
Saiba como comprar um robô de negociação na AppStore do MetaTrader, a loja de aplicativos para a plataforma MetaTrader.
O Sistema de Pagamento MQL5.community permite transações através WebMoney, PayPay, ePayments e sistemas de pagamento populares. Nós recomendamos que você teste o robô de negociação antes de comprá-lo para uma melhor experiência como cliente.
Você está perdendo oportunidades de negociação:
- Aplicativos de negociação gratuitos
- 8 000+ sinais para cópia
- Notícias econômicas para análise dos mercados financeiros
Registro
Login
Se você não tem uma conta, por favor registre-se
Para login e uso do site MQL5.com, você deve ativar o uso de cookies.
Ative esta opção no seu navegador, caso contrário você não poderá fazer login.